Most manufacturing automation projects are killed before they start — not because the technology does not work, but because the business case does not hold up to finance department scrutiny. The most common failure is an ROI model built only on labour savings, which underestimates the true return by 40–60% by ignoring quality improvements, throughput gains, reduced downtime, and the compounding cost of inaction. Average industrial robot payback has dropped from 5.3 years in 2019 to approximately 1.3 years in 2024, and collaborative robots now achieve payback in 6–18 months for well-scoped applications. This guide provides the complete framework that operations directors and CFOs need to calculate the true cost and return of manufacturing automation — with the right cost inputs, the right return categories, and the financial analysis structure that survives a capital committee review. If you want to see how a maintained automation asset affects your maintenance cost model, OxMaint's asset management platform is worth exploring alongside this framework.
OxMaint — Operations Finance Guide
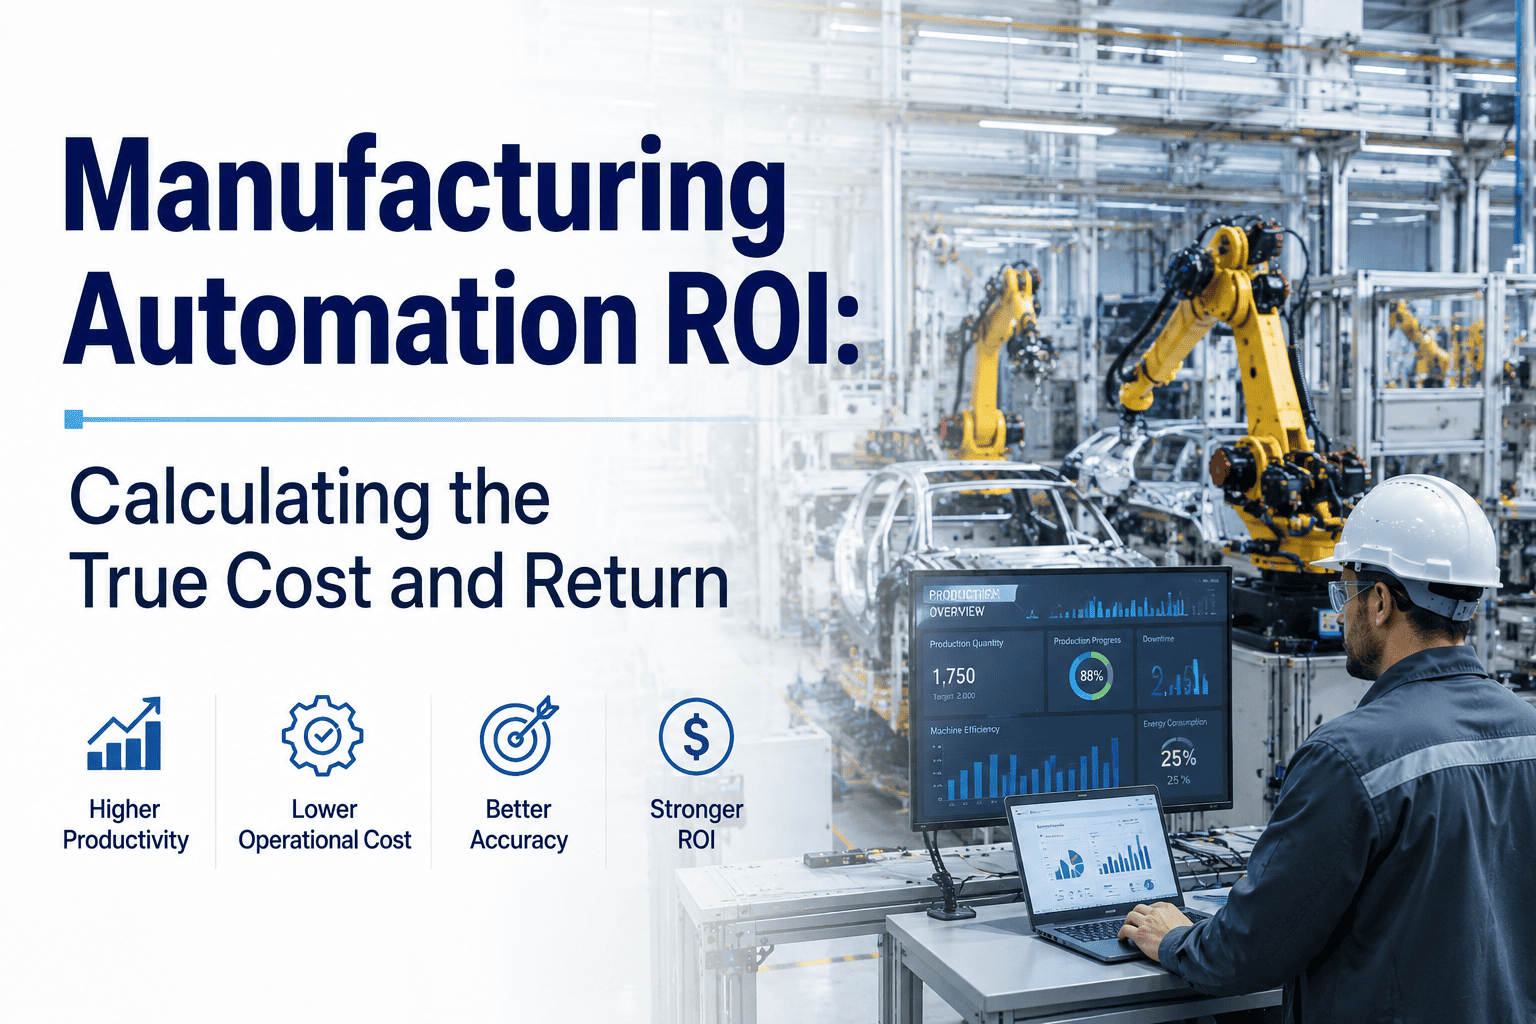
Manufacturing Automation ROI: Calculating the True Cost and Return
A complete framework for operations directors and CFOs evaluating automation investments — labour savings, quality returns, throughput gains, and the cost of doing nothing.
1.3 yrs
Average industrial robot payback in 2024 (McKinsey)
6–18 mo
Cobot payback range for high-utilisation applications
1.3–1.6×
True fully-burdened labour cost multiplier (vs. base wage only)
18.9%
CAGR of global cobot market 2025–2030
Why Most ROI Models Fail
The Three Mistakes That Get Automation Projects Rejected by Finance
Operations teams regularly present automation business cases that are factually correct but structurally weak. Finance teams reject them — not because automation is a bad investment, but because the ROI model is incomplete, presenting only the most visible savings while omitting the return categories that often represent 40–60% of the true case.
01
Using Base Wage Instead of Fully-Burdened Labour Cost
A $22/hour operator does not cost $22/hour. Benefits, payroll taxes, workers' compensation, training, supervision overhead, and turnover cost bring the fully-burdened rate to $28.60–$35.20/hour in US manufacturing — a 30–60% uplift. A model using base wage understates the labour saving by that same margin, making the payback look longer than it actually is.
02
Ignoring Quality and Scrap Reduction Returns
Robots achieve ±0.02–0.05mm repeatability versus ±0.5–1.0mm for skilled human operators over long shifts. For a manufacturer producing $2M annually with a 2% scrap rate, eliminating half that scrap through automation delivers $20,000/year in recovered material — often enough to fund months of the automation loan repayment alone.
03
Not Modelling the Cost of Inaction
Every month without automation is a month of continuing the costs the model claims automation will eliminate. A competitor who automates first gains throughput capacity, price flexibility, and quality consistency that compounds over years. The ROI model should include a "do nothing" scenario with its own cost trajectory — otherwise the comparison is not complete.
Cost Inputs
Step 1 — Getting the Investment Number Right
The most common error in automation cost modelling is using only the robot price. The true total cost of ownership (TCO) includes integration, installation, programming, training, ongoing maintenance, and consumables. Underestimating investment cost makes payback look shorter than it is — and creates credibility problems when actual costs arrive.
| Cost Category |
Cobot (Simple Application) |
6-Axis Robot (Complex Cell) |
Notes |
| Robot hardware |
$30,000–$60,000 |
$80,000–$200,000 |
End-of-arm tooling adds $5,000–$40,000 |
| System integration |
$15,000–$40,000 |
$50,000–$150,000 |
Often equals or exceeds robot cost for complex cells |
| Safety infrastructure |
$2,000–$8,000 |
$15,000–$60,000 |
Cobots reduce safety fencing cost significantly |
| Facility modifications |
$2,000–$10,000 |
$10,000–$50,000 |
Electrical, compressed air, floor anchoring |
| Programming and validation |
$5,000–$20,000 |
$20,000–$80,000 |
Include cycle time validation and FAT |
| Training |
$3,000–$8,000 |
$5,000–$20,000 |
Operator and maintenance technician training |
| Annual maintenance |
$3,000–$8,000/yr |
$8,000–$25,000/yr |
Include in TCO over 5-year horizon |
Use your company's weighted average cost of capital (WACC) — typically 8–12% for mid-size manufacturers — as the discount rate in your NPV calculation. A single payback number invites challenge; NPV and IRR over a five-year horizon demonstrate investment-grade rigour.
Return Categories
Step 2 — All Five Return Categories Your Model Must Include
Labour savings alone rarely tell the full story. The complete automation ROI picture has five return categories, each requiring its own calculation rather than an estimate. Missing even two of these significantly understates the return.
01
Labour Cost Reduction
Formula
Operators displaced × Hours/year × Fully-burdened rate
Use fully-burdened rate (base × 1.3–1.6). Include benefits, payroll taxes, workers' comp, and an estimate of turnover costs ($5,000–$15,000 per position per year in manufacturing environments with high churn.
02
Throughput and Capacity Gain
Formula
Additional units/hour × Margin per unit × Operating hours/year
Robots run at consistent cycle times without fatigue degradation. If automation allows a shift extension to lights-out operation, calculate the additional shift contribution at near-zero incremental labour cost.
03
Scrap and Rework Reduction
Formula
Annual production value × Current scrap % × Expected reduction %
Robots deliver ±0.02–0.05mm repeatability. For high-volume precision parts, even a 50% scrap reduction on a 2% rate returns substantial annual value. Rework labour eliminated is a separate calculation — track it at the fully-burdened rate.
04
Injury and Safety Cost Avoidance
Formula
Historical injury cost/year × Probability reduction × Direct + indirect cost multiplier
OSHA estimates indirect costs of a workplace injury are 4–10× the direct workers' compensation cost. Removing a human from a repetitive or ergonomically stressful task eliminates both the direct injury cost and its substantial indirect multiplier.
05
Maintenance Cost Predictability
Formula
Reactive repair cost reduction + Parts inventory optimisation saving
Automated equipment with predictive maintenance integration generates defined, scheduled maintenance needs rather than unpredictable reactive failures. This converts a variable cost line into a fixed, plannable one — which has real financial value for budget management and insurer premiums.
OxMaint and Automation Assets
Your Automation ROI Depends on Keeping That Equipment Running. OxMaint Keeps It Running.
A robot that is down for an unplanned repair does not deliver ROI. OxMaint's predictive maintenance platform monitors your automated equipment health in real time, predicts failures 2–4 weeks ahead, and auto-generates work orders to prevent the downtime that erodes your payback period.
Payback Benchmarks
Real Payback Period Data by Automation Type and Application
Payback periods vary significantly by automation type, application, and shift utilisation. The single biggest variable in payback is shift count — a robot running 16 hours per day pays back in roughly half the time of the same robot running 8 hours. Benchmark your expected payback against industry data before presenting to a capital committee.
Collaborative Robot (Cobot)
Assembly, machine tending, pick-and-place
Typical Payback
6–18 months
Lower upfront cost, no safety fencing, redeployable across tasks. Best ROI for SME manufacturers.
Material Handling Automation
Conveyors, palletising, AGVs, pick systems
Typical Payback
10–18 months
High labour displacement in warehousing and end-of-line. Returns driven by throughput gains and overnight operation.
Welding Automation
MIG, TIG, spot welding cells
Typical Payback
12–24 months
Strong quality return from consistent weld quality. Also strong safety return from removing operators from arc welding exposure.
Complex Custom Automation
Multi-step assembly, aerospace, medical device
Typical Payback
30–48 months
Higher integration cost and longer validation cycles extend payback. Returns are substantial but require patience and longer financial horizon.
Building the Business Case
Structuring the Automation ROI Presentation for Capital Committee Approval
A capital committee sees dozens of investment requests. The ones that get approved are not always the ones with the highest ROI — they are the ones that present the analysis with the most rigour, the most transparency about assumptions, and the clearest downside scenario. Here is the structure that withstands scrutiny.
Section 1
Problem Statement and Status Quo Cost
Document the current operational problem in cost terms. What does the current process cost per year — including labour at fully-burdened rate, scrap, rework, overtime, and injury history? This is the baseline the automation must beat. Including a 3-year cost trajectory for the status quo shows the committee what inaction costs over time.
Section 2
Total Investment Cost (Complete TCO)
Present the full capital cost including hardware, integration, safety, facility modifications, programming, training, and 5-year maintenance estimate. Committees that later discover additional costs that were not disclosed will not approve future projects.
Section 3
Quantified Return by Category
Present each of the five return categories separately with its formula, assumption, and annual value. Show sources for productivity improvement estimates — manufacturer data sheets, similar customer deployments, or engineering time studies. Unsourced numbers invite challenge.
Section 4
Payback, NPV, and IRR at WACC
Present simple payback, discounted payback, 5-year NPV at WACC, and IRR. Include sensitivity analysis at ±20% on the three most critical assumptions (typically: operator displacement count, cycle time improvement, and annual operating hours). This demonstrates analytical rigour and confidence in the numbers.
Section 5
Risk and Downside Scenario
Present the worst-case scenario explicitly: what happens if the automation delivers only 60% of projected labour savings and takes 50% longer to deploy? Show that even in the downside scenario, the investment reaches payback within an acceptable timeframe. Proactively addressing risk builds credibility with finance audiences.
Frequently Asked Questions
Manufacturing Automation ROI — Questions From Operations Directors and CFOs
What is a realistic payback period for manufacturing automation in 2025?
Collaborative robot deployments typically achieve payback in 6–18 months for well-scoped applications. Six-axis robot cells and complex custom automation run 12–48 months depending on application complexity and shift utilisation. The average industrial robot payback has decreased dramatically — from 5.3 years in 2019 to approximately 1.3 years in recent benchmarks — driven by lower hardware costs and better integration practices.
OxMaint helps extend automation ROI by reducing unplanned downtime on automated assets.
Should we automate even if our labour costs are relatively low?
Yes — because automation ROI extends well beyond labour cost. Quality improvement, throughput gain, overnight operation capability, safety cost reduction, and the competitive cost of not automating while competitors do are all significant even in low-labour-cost environments. The return shifts composition, not magnitude. Model all five return categories before concluding that low wages make automation unviable.
How does shift count affect automation payback?
Shift count is the single most powerful lever in automation payback. A robot running two shifts pays back in roughly half the time as the same robot on one shift — the fixed capital cost is spread over twice the operating hours while labour and quality returns accumulate proportionally. A robot capable of lights-out operation on a third shift can make a borderline project clearly viable. Always model payback at multiple shift scenarios.
What is the connection between automation ROI and maintenance costs?
Automated equipment that experiences unplanned downtime does not deliver its projected ROI. Every unplanned hour a robot is offline extends the payback period. Integrating automated assets with a predictive maintenance platform that monitors equipment health and prevents failures protects the financial case — which is why maintenance planning for automated equipment should be part of the investment proposal, not an afterthought.
Book a demo to see automated equipment maintenance management.
What is the best way to present automation ROI to a finance committee that is sceptical?
Lead with the cost of inaction over three years — most finance teams have not seen a well-modelled status quo cost trajectory. Then present each return category with its calculation formula and data source. Include sensitivity analysis showing the downside case still reaches payback. Proactively disclosing risks and showing they have been modelled builds credibility faster than presenting only the optimistic scenario.
OxMaint — Protecting Automation Investments
Automation ROI Depends on Uptime. OxMaint Delivers Uptime.
Every unplanned breakdown on an automated line erodes the ROI that justified the capital investment. OxMaint monitors your automated equipment health continuously, predicts failures 2–4 weeks ahead, and generates work orders automatically — so your automation delivers the payback your business case promised.