Smart cities run on thousands of interconnected utility assets — water valves, streetlight nodes, traffic controllers, sewer pumps, and broadband cabinets — and each one needs a verified location, a real-time status reading, and a maintenance schedule that survives staff turnover. When asset data lives in PDF maps and spreadsheets, every emergency call becomes a hunt for information the city already paid to collect. OxMaint AI's analytics and reporting platform unifies geospatial asset records, IoT sensor feeds, and predictive maintenance workflows into a single dashboard that municipal teams actually use — or book a 30-minute live demo to see how a unified smart city utility map looks in practice.
Map Every Asset. Predict Every Failure. Dispatch in Minutes.
The global smart city platforms market reached USD 1.96 trillion in 2026, yet most municipalities still run utility maintenance from disconnected GIS layers, paper logbooks, and complaint-driven dispatch. OxMaint AI turns fragmented utility data into a live operations dashboard.
The Real Cost of Fragmented Utility Data
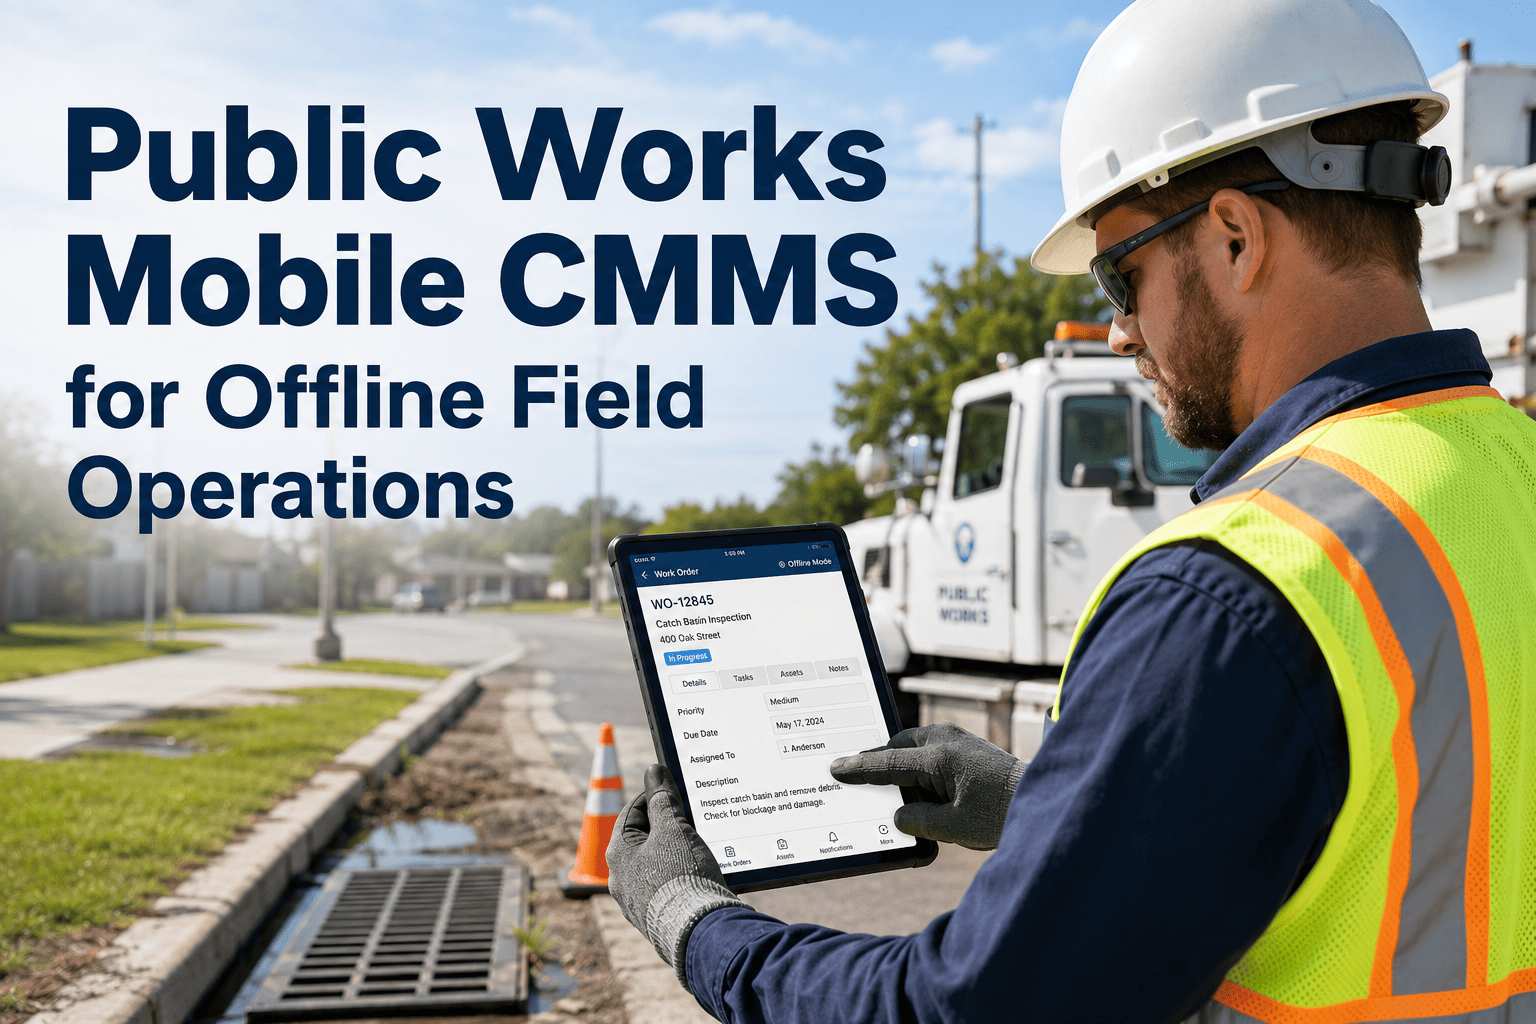
City utility teams do not lack information — they lack accessible, current, decision-ready information. Water department maps live in one GIS system, streetlight inventories in another, electrical SCADA on a separate network, and field crew completion notes in a paper logbook back at the depot. When a sinkhole opens on Main Street, the team responding has minutes to identify which utilities cross the failure zone, but the data they need is locked in four systems they cannot query from the field.
What a Unified Smart City Dashboard Actually Tracks
A working smart city utility dashboard is not a pretty map — it is a queryable operations console. Every asset has a verified location, a live status indicator, a maintenance history, and a calculated risk score. Field crews see only the layers relevant to their work order, while finance directors see aggregated capital metrics. Below is the asset coverage standard OxMaint deploys for municipal customers.
| Asset Category | Tracked Data | Update Frequency | Primary KPI |
|---|---|---|---|
| Water Distribution | Valve location, last operated date, pressure zone, leak history, material, install year | Real-time pressure, monthly inspection | Non-revenue water percentage |
| Streetlight Network | Fixture type, wattage, dimming schedule, photocell status, outage log | Real-time fault telemetry | Lit hours and uptime rate |
| Traffic Signals | Controller model, timing plan, MMU faults, detector status, conflict monitor | Real-time SCADA feed | Mean time between failures |
| Sewer & Stormwater | Pump runtime, wet well level, blockage events, CCTV inspection score | Real-time SCADA, annual CCTV | Overflow events per year |
| Public Buildings | HVAC runtime, building automation alarms, FCI score, energy consumption | 15-minute interval BAS data | Facility Condition Index |
| EV & Public Charging | Charger uptime, kWh dispensed, session count, OCPP fault codes | Real-time OCPP feed | Uptime against state mandate |
Stop Chasing Information Across Six Systems
OxMaint imports your existing GIS layers, SCADA feeds, and CMMS records into a single operations dashboard — without ripping out the systems your teams already know. A 30-minute demo shows how your assets would look on day one.
From Sensor Alert to Closed Work Order — In Under 12 Minutes
The measurable value of a smart city dashboard is not visualisation — it is workflow compression. A vibration anomaly on a water pump should not require a phone call, a manual lookup, and a paper work order to become an action. OxMaint AI closes the loop between sensor data and field response automatically, so the same staff can manage a 4× larger asset portfolio without adding headcount.
What City Leadership Sees on Monday Morning
Field crews need work orders. Department directors need fleet-wide metrics. City council and the mayor need capital narratives that survive public scrutiny. OxMaint AI builds each role its own view from the same underlying data — so the council briefing, the budget request, and the field dispatch all draw from a single verified source of truth.
- Open work orders by district and crew
- Live asset fault feed with priority
- Crew GPS positions and ETA estimates
- SLA timers for citizen-reported issues
- Failure-trend analytics by asset class
- Pressure, vibration, and runtime curves
- Predictive risk scores by district
- Mean time between failures benchmarks
- Deferred maintenance backlog in dollars
- Facility Condition Index by building
- Replacement curve by asset cohort
- Multi-year capital request justification
- Citizen response time trend lines
- Service-level performance scorecards
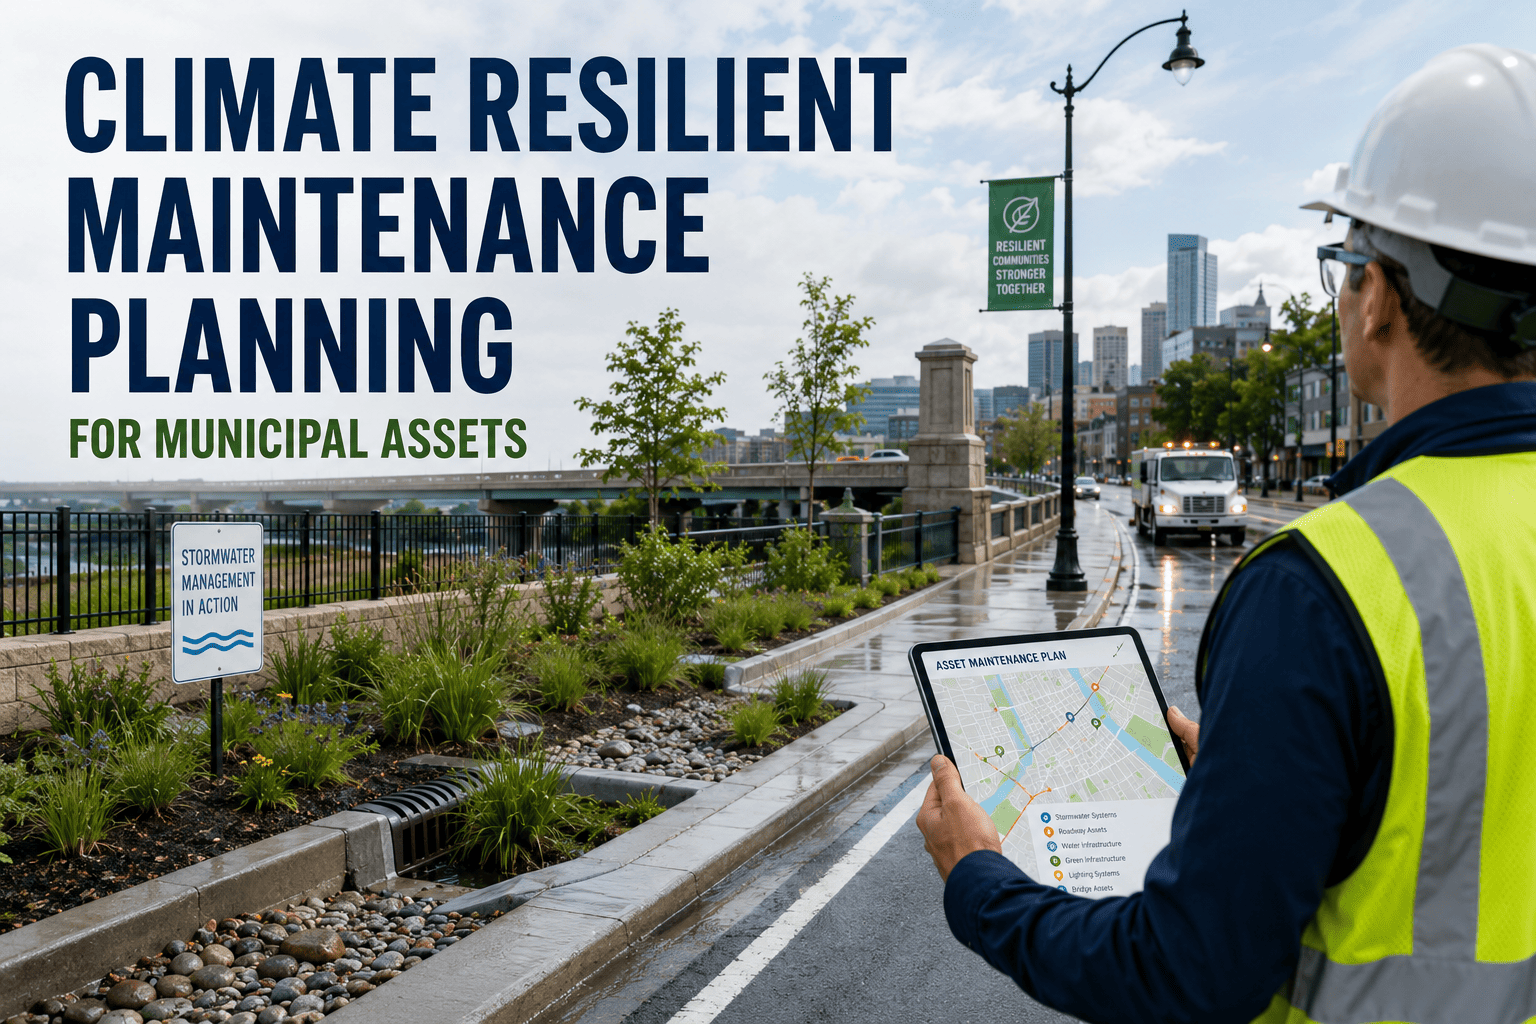
- Resilience readiness by infrastructure
- ESG and sustainability disclosures
Expert Review
Frequently Asked Questions
Your City Already Has the Data. OxMaint Makes It Actionable.
Every asset on one map. Every sensor in one feed. Every work order tracked from creation to closure. See the smart city operations console that municipal leadership teams are deploying ahead of the next budget cycle.