Local governments spend more than $7 billion every year powering and heating their own buildings — courthouses, libraries, schools, water plants, fire stations, public works depots — yet most agencies cannot answer a basic question on demand: which 10 buildings in our portfolio are wasting the most energy this quarter, and why? Energy benchmarking ordinances now cover more than 40 U.S. cities, and EPA's own data shows buildings that benchmark consistently cut consumption by 2.4% per year on average — but only when the benchmarking data actually drives maintenance decisions. Oxmaint's Energy & ESG Reporting module turns ENERGY STAR Portfolio Manager data, utility bills, and BMS feeds into work orders your team can act on this week. Or book a 30-minute demo to see the government benchmarking dashboard live.
Government Energy Benchmarking and Utility Cost Analytics
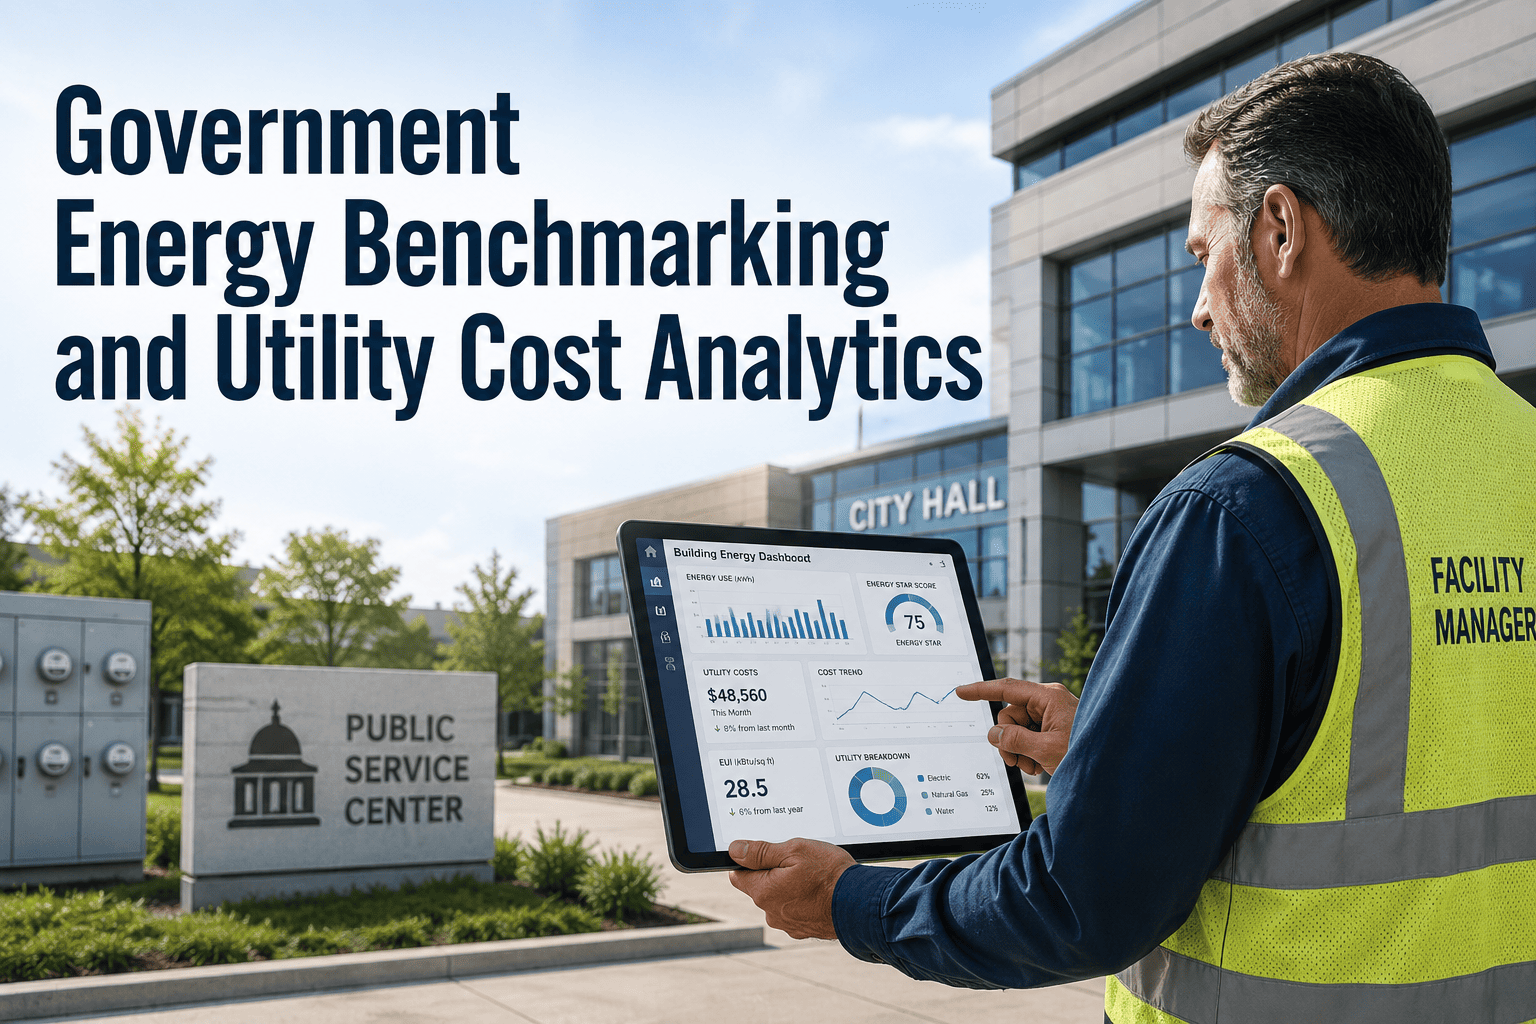
How municipal, state, and federal agencies turn ENERGY STAR Portfolio Manager scores, utility cost data, and BMS analytics into compliance-ready reports and maintenance work orders that cut energy spend 10–30% within 24 months.
Why Benchmarking Without Analytics Fails the Government Sector
Every benchmarking ordinance — NYC LL84, Seattle SMC 22.920, DC BEPS, Boston BERDO, Saint Paul, Detroit, Maryland statewide — requires the same thing: annual reporting of energy and water use into ENERGY STAR Portfolio Manager, scored by Energy Use Intensity (EUI). The problem is that agencies treat the submission as a once-a-year compliance task instead of a year-round operating signal. The data goes in, a score comes out, and nothing changes inside the buildings.
- Pull 12 months of bills in April, type into Portfolio Manager
- Submit before the May 1 deadline, file the confirmation email
- Notice the EUI is 30% above peer median, file that too
- Wait another 12 months before looking at the data again
- Discover the failed economizer only when the budget is overspent
- Monthly utility bill ingestion, auto-mapped to each asset
- EUI drift alerts at the building level the same week they happen
- Work orders auto-generated when consumption breaks a threshold
- Maintenance backlog linked to energy-impacting assets first
- Year-over-year savings documented for grant & ESG reporting
The Utility Cost Analytics Stack — From Bill to Work Order
A real government energy program runs on five connected data layers. Each layer has to feed the next, or the analytics stop at a dashboard that nobody actions. Here is what a working stack looks like across a typical 40-building municipal portfolio.
Most public-sector portfolios stop at Layer 2. They submit benchmarking data, generate a score, and treat it as the end of the workflow. Layers 3 through 5 — telemetry, anomaly detection, and automated work order generation — are where actual dollar savings happen. IoT sub-meters and BMS connections let Oxmaint flag a 14% week-over-week consumption spike on the courthouse chiller within 7 days, instead of letting it run hot until the August bill arrives.
See Your Portfolio's EUI Drift Before the Bill Arrives
Oxmaint maps every utility bill, BMS point, and PM record to the building that generates it. Drift gets a work order — not a dashboard.
Where Government Buildings Actually Waste Energy
EPA, DOE FEMP, and ASHRAE Level II audit data across thousands of public buildings consistently surface the same recoverable waste streams. None of these require capital projects — they require maintenance work orders driven by data the agency already owns.
| Waste Stream | Typical % of Site EUI | Root Cause | Maintenance Action |
|---|---|---|---|
| Simultaneous heating & cooling | 8–14% | Drifted BAS setpoints, failed VAV reheat valves | Quarterly setpoint & valve actuator audit |
| Fouled HVAC coils & filters | 6–12% | Deferred PM, missed filter-change intervals | Differential-pressure triggered work orders |
| Economizer damper failures | 5–10% | Stuck linkage, failed actuator, broken sensor | Seasonal economizer functional test PM |
| After-hours plug & lighting load | 4–9% | Override switches, no occupancy controls | Lighting controls calibration + sweep audit |
| Peak-demand co-incidence | 10–25% of demand charge | All rooftop units staging on at 6:00 AM | Staggered start sequencing in BAS |
| Domestic hot water over-heating | 3–6% | Aquastat drift, recirculation loop running 24/7 | Monthly aquastat verification PM |
| Water leaks (irrigation, fixtures) | 5–15% of water bill | Undetected slow leaks, broken irrigation heads | Night-flow detection + leak work orders |
What an Energy & ESG Reporting Module Has to Do
An ESG report that takes 6 weeks to assemble from PDFs, spreadsheets, and emailed bill copies is not a reporting system — it is a recurring crisis. The features below define what a public-sector-grade module looks like in 2026, and they are what Oxmaint's Energy & ESG Reporting ships with by default.
The Cost of a Year of Ignored Drift — A Realistic Scenario
Below is a typical 24-building municipal portfolio with combined annual utility spend around $4.2M. The model uses EPA energy management benchmark ranges and is conservative — it does not include capital projects, only maintenance and analytics actions.
Compliance Stack: What Your Benchmarking Has to Satisfy
A government agency may be subject to six or more overlapping benchmarking and disclosure frameworks simultaneously. The platform that runs the program has to export to all of them without manual reformatting.
The data we collect for benchmarking is the most under-utilised asset in public-sector facilities. Agencies spend significant staff time pulling 12 months of bills, submitting to Portfolio Manager, and then filing the result. The score sits there. Meanwhile the coil that drove the EUI up never gets cleaned, the economizer linkage that has been stuck open since March is still stuck open in August, and the same building gets cited for the same EUI variance the following year. What changes the outcome is connecting the benchmarking data to the work order. When a 12% EUI drift in May automatically opens a work order in the building's CMMS the same week, with the responsible HVAC technician notified and a target close date — that is when benchmarking starts producing actual savings, not just compliance paperwork. Across the municipal portfolios I have advised, the agencies that close this loop are saving 12 to 22 percent of utility spend within 24 months. The ones that treat benchmarking as a once-a-year file submission are saving zero.
Implementation in 90 Days — A Realistic Sequence
A government benchmarking and utility analytics program does not require a multi-year transformation project. Most municipal portfolios get to first useful output within one fiscal quarter when the work is sequenced correctly.
Building & meter inventory
Load every building, every meter (electric, gas, water, district steam), and every existing Portfolio Manager property record into Oxmaint. Establish meter-to-building mapping and rate schedules.
24 months of bill history loaded
Backfill prior 24 months of utility bills via utility EDI feeds, Portfolio Manager Web Services, or bulk import. Establish baseline EUI per building. Flag any bills with missing or estimated reads.
BMS & sub-meter integration
Connect the BMS for the top 25% of buildings by spend. Map energy-impacting assets (chillers, boilers, AHUs, lighting controls) so anomalies surface against actual equipment.
EUI drift & anomaly rules go live
Configure thresholds for EUI drift, bill anomalies, peak-demand spikes, and after-hours consumption. Auto-route alerts as work orders into the queue of the responsible facilities team.
First mandate report exports
Generate first compliance-ready report packs — EISA 432, state BEPS, city ordinance submission, and ESG / climate action plan disclosures. From this point forward, reports are exports, not assembly projects.
Stop Submitting Benchmarks. Start Acting On Them.
Oxmaint connects ENERGY STAR Portfolio Manager, utility bills, and BMS data to the work orders that actually move EUI. One platform, every mandate, real savings.