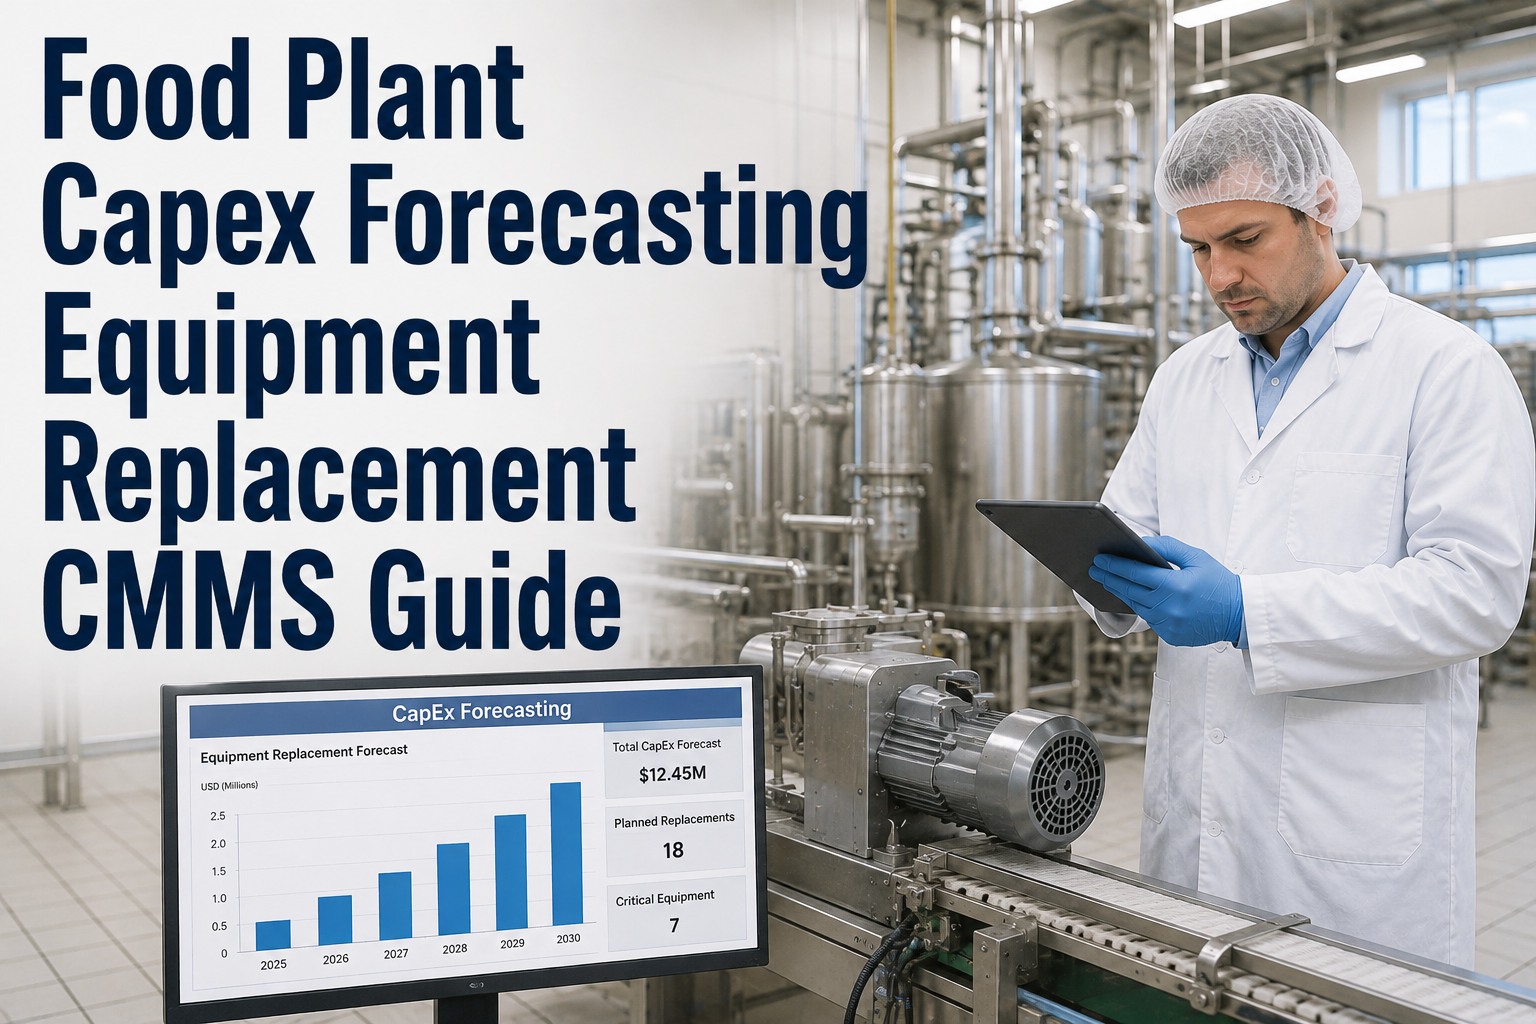
Food plant CapEx approval is where reliability teams and finance teams either align on defensible numbers or fight the same budget battle every October. The pattern is universal: reliability knows the chiller is failing, finance sees a $180K request with no supporting cost history, the request gets deferred to next fiscal year, the chiller fails in Q2, emergency replacement costs $260K, and both teams blame each other. This guide covers CapEx forecasting the way boards actually approve it — condition-based replacement triggers, board-defensible business case structure, three financial evaluation methods (Payback / NPV / IRR), and how OxMaint's maintenance management software gives reliability and finance one shared dataset for capital planning. Start free or book a demo.
Food Plant · CapEx Forecasting · Reliability × Finance · CMMS 2026
Food Plant Capex Forecasting Equipment Replacement CMMS Guide
CapEx forecasting guide for food processing equipment: condition-based replacement timing, cumulative repair cost justification, and OxMaint's CMMS-based capital budget planning workflow.
2-3%
World-class maintenance cost as % of Replacement Asset Value
3-5×
Emergency repair cost premium over scheduled work
70%
Companies unaware when equipment is due for replacement
40%
Improvement in CapEx forecasting accuracy with CMMS
The CapEx Priority Matrix — Where Every Replacement Request Actually Sits
Not every replacement request is equally urgent, and not every urgent request is worth doing this year. The CapEx priority matrix below maps every replacement candidate against two axes: business impact if it fails and current asset condition. The four quadrants tell you what to fund now, what to plan, what to defer, and what to leave alone — and this is the picture your CFO wants to see attached to every capital request. Sign up free and OxMaint auto-plots every food-plant asset on this quadrant grid — replacement priority becomes a living picture updated with every WO, MTBF trend, and condition reading, not an annual manual exercise.
CAPEX PRIORITY MATRIX · BUSINESS IMPACT × ASSET CONDITION
HIGH IMPACT →
PLAN
HIGH IMPACT · GOOD CONDITION
Critical to production but still mid-useful-life. Build 2-3 year capital roadmap. Monitor MTBF trend for early wear-out signal.
e.g. mid-life pasteurizer, primary blower
FUND NOW
HIGH IMPACT · POOR CONDITION
Board-priority replacement. Cumulative repair cost approaching RAV threshold. Emergency-failure exposure. Full business case with NPV/IRR.
e.g. aging chiller, obsolete-parts filler
LEAVE
LOW IMPACT · GOOD CONDITION
Non-critical, functioning well. No capital case. Continue standard PM cycle. Revisit in annual asset review.
e.g. admin HVAC, warehouse lighting
DEFER
LOW IMPACT · POOR CONDITION
Failure won't stop production. Redundancy or bypass available. Run-to-failure or budget-year replacement based on unit cost.
e.g. redundant grit conveyor, secondary sifter
← POOR CONDITION
The 5 Condition-Based Replacement Triggers — With Real Thresholds
Board-approvable CapEx cases don't run on "the machine is old." They run on specific, defensible triggers that finance recognizes. Below are the five triggers every food-plant reliability team should track — with the concrete thresholds that separate "reasonable request" from "urgent replacement." Book a 30-minute demo and an OxMaint capital-planning specialist will walk these five triggers against your top asset classes — you'll leave with an initial data-backed replacement queue before you commit to a trial.
01
Annual Maintenance Cost Ratio
Trigger: Annual Maint > 30-40% of RAV
When yearly repair spend crosses 30-40% of Replacement Asset Value, the math flips. World-class plants hold this ratio at 2-3%. At 10%+, you're under-investing in CapEx and over-spending on band-aid repairs.
Trigger: MTBF ↓ 25%+ over 12-24 months
Mean Time Between Failures dropping sequentially is the wear-out phase signal. A 25% or greater decline over 12-24 months typically indicates the asset is entering the wear-out curve — 12-18 months of replacement planning lead time.
03
Parts Obsolescence Lead Time
Trigger: Critical parts lead time > 8-12 weeks
OEM discontinuation, aftermarket-only sourcing, or lead times past 8-12 weeks make the asset a stockout risk regardless of mechanical condition. Proactive replacement beats crisis replacement every time.
04
Food-Safety Compliance Gap
Trigger: Sanitary design or CCP capability degraded
Sanitary design becomes non-conforming, allergen changeover creates cross-contact risk, or CCP monitoring degrades below HACCP requirement. Compliance triggers separate approval framework — not competing with growth CapEx.
05
Energy Efficiency Payback
Trigger: Energy savings pay back CapEx in ≤ 3-5 years
Modern refrigeration, motors, and compressed-air systems often deliver 20-30% energy savings over 15-year old equipment. Energy-alone payback under 5 years often qualifies for utility rebate co-funding on top of the CapEx case.
The Board-Defensible Business Case — 5 Components Every CapEx Request Needs
The reason maintenance CapEx requests get rejected isn't usually the number — it's the story around the number. Finance rejects requests that read like "we need this because it's old." Finance approves requests structured as a defensible business case with the five components below. Sign up free and OxMaint generates each of these five components automatically from your live maintenance data — cumulative cost history, MTBF trend, condition score, and downtime cost impact all pre-populated for every replacement candidate.
1
Current State — What This Asset Is Costing Now
Cumulative maintenance cost over past 24-36 months, MTBF trend, downtime hours attributed, emergency-repair frequency. The data-backed answer to "what's the pain today."
2
Gap Analysis — What Happens If We Do Nothing
Projected failure cost including production loss, emergency response premium, product loss, compliance exposure. The "cost of inaction" number that finance uses to compare against the CapEx ask.
3
Recommended Solution — What We're Buying and Why
Specific replacement asset, vendor, specification alignment to production requirement, sanitary design conformance, alternatives considered and rejected with reasoning.
4
Full-Cost Analysis — Beyond the Sticker Price
Installation, utility tie-ins, controls programming, changeover downtime, spare-parts kit, operator training, commissioning validation (IQ/OQ/PQ), startup scrap. The commonly-forgotten costs that turn approved projects into overruns.
5
Financial Metrics — Payback, NPV, and IRR
Payback period, 3-year NPV against company hurdle rate, IRR for comparison against competing projects. Sensitivity analysis showing which assumptions the ROI depends on most.
The 3 Financial Evaluation Methods — When to Use Which
Different CapEx conversations need different financial framing. A one-year filler upgrade doesn't need the same treatment as a five-year plant expansion. Below is the standard evaluation-method map — use the wrong one and finance stops reading. Book a scoping call and an OxMaint financial-analysis specialist will help calibrate your business case to the right method for each replacement class — you'll leave with a template library your reliability team can reuse before you commit to a trial.
PAYBACK
Payback Period
FormulaTotal Investment ÷ Annual Net Benefit = Months to Payback
Best ForSmall-to-mid CapEx (< $250K), 1-3 year horizon, quick screening
Approval RulePayback < 12 months at conservative assumptions = high approval odds
NPV
Net Present Value
FormulaΣ (Future Cash Flow ÷ (1+r)^t) − Initial Investment
Best ForLarger CapEx ($250K+), multi-year benefit stream, time-value critical
Approval RulePositive 3-year NPV at company discount rate = approvable
IRR
Internal Rate of Return
FormulaDiscount rate at which NPV = 0
Best ForCompeting capital projects — compares regardless of project size
Approval RuleIRR > company hurdle rate (typically 12-20%) = approvable
The Same Chiller Costs $180K Planned or $260K Emergency. The Difference Is Data on the CFO's Desk in October.
OxMaint's maintenance management software builds the full cumulative cost record, MTBF trend, and downtime impact per asset — so October's capital request comes with the data already attached. Reliability stops guessing. Finance stops resisting. Both teams work from one dataset instead of two conflicting spreadsheets.
The 8 Commonly-Forgotten Costs That Turn Approved Projects Into Overruns
Payback analyses that only count purchase price and installation systematically underestimate true project cost by 20-40% — and post-approval overruns damage reliability's credibility on the next request. Below are the eight costs commonly missed in food-plant CapEx analysis. Sign up free and OxMaint's CapEx templates prompt for all eight cost categories at business case creation — no more "we forgot to include the controls programming" surprises three months into commissioning.
Utility Tie-Ins
Power, water, steam, compressed air, drainage modifications
Installation Labor
Rigging, positioning, mechanical fit, safety systems
Controls Programming
PLC integration, HMI configuration, SCADA linkage
Changeover Downtime
Production loss during removal + install + commissioning
Spare-Parts Kit
Initial critical spares, recommended by OEM at commissioning
Operator + Tech Training
OEM training, internal SOP development, competency verification
Commissioning Validation
IQ/OQ/PQ, HACCP integration, sanitary design verification
Startup Scrap
Product yield during ramp-up before hitting steady-state quality
Spreadsheet CapEx Planning vs. OxMaint Data-Driven CapEx Forecasting
Most food plants build the annual CapEx list from a mix of vendor sales calls, breakdown memory, and reliability manager intuition. That approach loses budget battles in October and produces $260K emergency replacements in Q2. Here's what changes when CapEx forecasting runs on live CMMS data. Start free — no credit card, unlimited users, and OxMaint's food-plant library ships with CapEx business-case templates pre-configured with all 5 components and 8 cost categories built in.
Food plants that put CapEx forecasting inside OxMaint stop losing budget battles and start converting maintenance requests into approved capital projects. Start your free forever workspace to build your first data-backed replacement business case this month, or book a demo to see a live board-ready CapEx report generated from real plant data.
"
Our annual CapEx cycle used to be a 6-week war — reliability building requests from memory, finance rejecting anything without hard numbers, half the requests deferred to next year and half of those becoming emergency replacements before the fiscal year ended. Rolled OxMaint's CapEx forecasting module across two plants and 640 assets with 36 months of WO history migrated in. This year's CapEx cycle took 9 days instead of 6 weeks. Every one of our 14 replacement requests came with cumulative cost, MTBF trend, priority-quadrant positioning, payback period, and 3-year NPV auto-generated. Finance approved 12 of 14 — including two we'd been deferring for three years — because the data was already attached. First year emergency-replacement spend down 34%. Reliability and finance stopped fighting because we're both reading the same numbers.
Director of Reliability & Engineering · 2-Plant Frozen Food Manufacturer · US Midwest
Frequently Asked Questions
What triggers a food-plant equipment replacement CapEx case?
Five standard triggers: (1) annual maintenance cost exceeds 30-40% of Replacement Asset Value (world-class is 2-3%); (2) MTBF declines 25% or more over 12-24 months indicating wear-out; (3) critical parts lead times extend past 8-12 weeks creating stockout risk; (4) sanitary design, allergen changeover, or CCP monitoring capability becomes non-conforming to food-safety requirements; (5) energy consumption degrades enough that modern replacement delivers 3-5 year payback on energy savings alone. Any single trigger justifies a business case; multiple triggers on the same asset should fund now.
Which financial evaluation method should we use — Payback, NPV, or IRR?
Payback for small-to-mid CapEx (< $250K) with 1-3 year horizon — quick screening, easy to communicate; approval rule: under 12 months at conservative assumptions typically approves. NPV for larger CapEx ($250K+) with multi-year benefit stream — positive 3-year NPV at company discount rate is the bar. IRR for comparing competing capital projects regardless of size — must exceed company hurdle rate (typically 12-20%). Board-defensible business cases typically include all three, presented as: Payback first for screening, NPV for magnitude, IRR for comparison.
Sign up free to see all three auto-calculated.
What costs are commonly forgotten in food-plant CapEx analysis?
Eight cost categories missed most often: utility tie-ins (power, water, steam, compressed air, drainage); installation labor and rigging; controls programming (PLC/HMI/SCADA); changeover downtime and production loss; initial spare-parts kit; operator and technician training; commissioning validation (IQ/OQ/PQ, HACCP integration, sanitary verification); startup scrap during ramp to steady-state quality. Missing any of these can turn a 14-month payback into a 22-month payback and damage reliability's credibility on the next request. OxMaint prompts for all eight at business case creation.
Should food-safety compliance CapEx compete against growth CapEx?
Usually no. Food safety, regulatory, wastewater, and customer-compliance projects typically go through a separate approval framework because they protect revenue and reduce enterprise risk rather than generating incremental return. Trying to fit a compliance-driven equipment replacement into the same ROI hurdle as a throughput expansion usually fails the math while failing the compliance obligation. Best practice: dedicated compliance CapEx pool with a risk-based approval, separate from growth CapEx competing on IRR.
How does OxMaint help reliability and finance work from the same numbers?
OxMaint holds one authoritative dataset per asset — cumulative maintenance cost, MTBF trend, downtime hours attributed, criticality classification, current condition score, and 5-trigger status. Reliability sees it in the reliability dashboard; finance sees the same data in the CapEx planning report. No conflicting spreadsheets, no dataset reconciliation, no October standoff. Both teams work from the same live picture, and business case discussions become about strategy rather than data validation.
Book a demo to see reliability+finance shared views.
How far ahead should CapEx forecasting look?
Best practice for food plants is a rolling 3-year CapEx horizon updated quarterly: Year 1 = committed and funded; Year 2 = board-approved plan with detailed business cases; Year 3 = pipeline of candidates being tracked via 5-trigger monitoring. MTBF declines and parts obsolescence typically give 12-18 months of lead time, so a 3-year horizon converts most emergency replacements into planned ones. OxMaint's replacement queue auto-populates the 3-year view based on live trigger status per asset.
Is a credit card or CAPEX approval needed to start with OxMaint?
No. OxMaint's free forever plan requires no credit card, no CAPEX request, and no consulting engagement — you can
sign up in under 2 minutes and register your first food-plant asset with full CapEx tracking active the same shift. CapEx business case templates ship pre-built for processing, packaging, refrigeration, utility, and sanitation equipment classes — with the 5 business case components and 8 cost categories loaded ready to complete.
Win the October Budget Battle With Data Already on the CFO's Desk.
OxMaint's maintenance management software delivers auto-flagged replacement candidates, live cumulative cost, MTBF trend, priority-matrix positioning, and Payback + NPV + IRR calculations — the board-defensible business case reliability teams need and finance teams approve. Start free — no credit card, unlimited users, forever. Or book a demo for a plant-specific CapEx walkthrough.