A food plant's equipment inventory is not a line item on the balance sheet — it's a 15-30 year lifecycle where acquisition cost is only 10-25% of what the asset actually costs the business, and where every replace-or-repair decision carries food-safety, regulatory, and capital-planning implications well beyond simple maintenance economics. Aging equipment accounts for roughly 29% of every unplanned stoppage, and the average manufacturing facility loses 800 hours of production annually to it. This 2026 guide covers the 5-stage food plant asset lifecycle — planning through decommissioning — the TCO reality, the repair-vs-replace decision framework, and how OxMaint's maintenance management software closes the data loop across every stage. Start free or book a demo.
Food Plant · Asset Lifecycle · Capital Planning · CMMS 2026
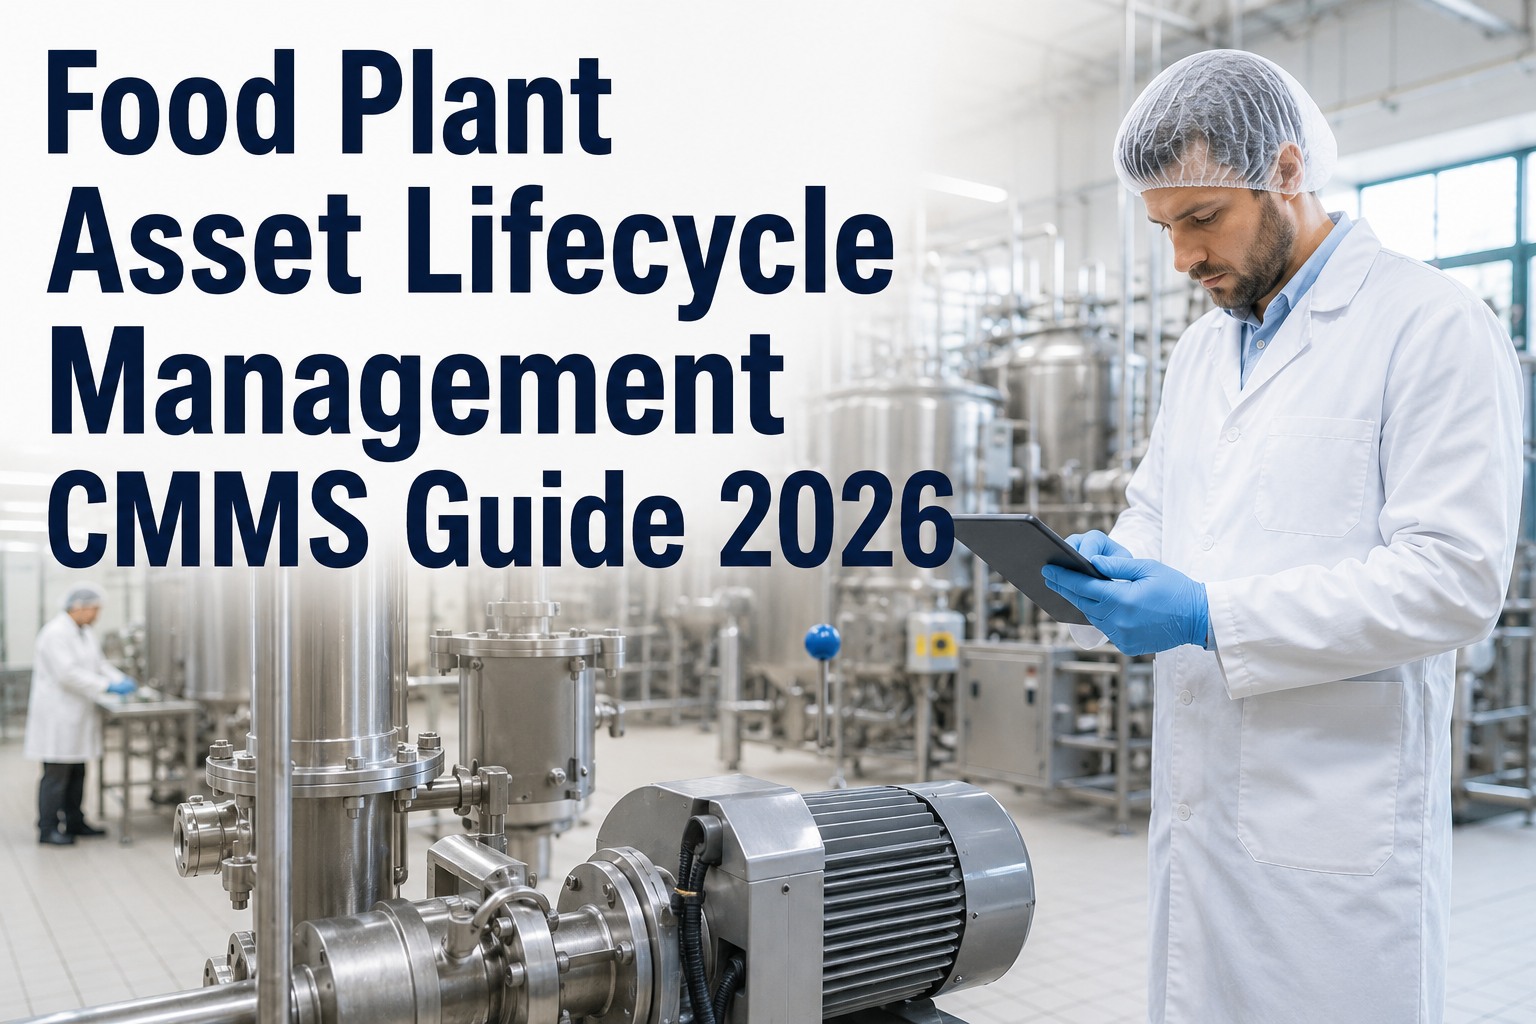
Food Plant Asset Lifecycle Management CMMS Guide 2026
Asset lifecycle management guide for food processing equipment: acquisition to decommissioning tracking, replacement timing decisions, and OxMaint's CMMS-based lifecycle cost workflow.
5 Stages
Planning → Commissioning → Operation → Optimization → Decommission
10-25%
Acquisition cost as share of total lifetime cost of ownership
29%
Share of unplanned stoppages caused by aging equipment
30-40%
Annual maint/RAV ratio triggering replacement conversation
The 5-Stage Food Plant Asset Lifecycle — Cradle to Grave
Every piece of food plant equipment moves through five distinct stages, each with distinct data requirements, decisions, and risks. The compounding problem across most plants is fragmentation — maintenance in one system, procurement in another, condition in a third, finance in a spreadsheet. When these systems don't talk to each other, lifecycle intelligence is impossible. Below is the 5-stage map with the data OxMaint captures at each stage. Sign up free and OxMaint's food-plant library ships with 5-stage lifecycle asset templates — every asset carries its full cradle-to-grave record from commissioning day forward, with no separate lifecycle system to maintain.
1
Planning & Procurement
Before the asset is ordered
TCO analysis using benchmarks from existing similar assets. Sanitary design specification review. Vendor selection, criticality classification, spare-parts strategy, warranty terms, food-grade material documentation.
OxMaint captures: Vendor data, TCO projection, criticality tier, spare-parts BOM, warranty terms
2
Commissioning & Installation
Before the asset enters operation
Asset record creation, baseline condition documentation, OEM PM schedule loading, warranty start date, food-safety commissioning validation (IQ/OQ/PQ), CCP designation if applicable, HACCP integration.
OxMaint captures: Serial number, install date, baseline condition photos, OEM manuals, warranty start
3
Operation & Maintenance
The productive life — where most cost accrues
PM execution, corrective repairs, parts consumption, condition monitoring, MTBF and MTTR calculation, cumulative cost tracking. Every closed WO adds to the asset's TCO record and feeds future replacement decisions.
OxMaint captures: WO history, parts/labor cost, MTBF/MTTR, downtime, cumulative maint cost
4
Performance Optimization
Continuously refining PM strategy
MTBF-driven PM interval adjustment. Wear-out phase detection through declining MTBF trend. Condition-monitoring data integration. Parts obsolescence flagging (8-12 week lead time = stockout risk).
OxMaint captures: MTBF trend, PM effectiveness score, condition trend, parts lead-time alerts
5
Decommissioning & Disposal
Data-driven end-of-life
Decommission decision, planned removal WOs, salvage/trade-in value recovery, regulatory disposal (hazardous components, refrigerant recovery), documentation archive as benchmark for the next acquisition.
OxMaint captures: Decommission WO, salvage value, disposal records, archived lifecycle report
The TCO Iceberg — What Acquisition Cost Actually Hides
Buying decisions made on purchase price alone systematically underestimate the true cost of ownership by 40-60% — because the acquisition cost is only the visible tip. Below the waterline sits the 75-90% of lifetime cost that shows up as PMs, repairs, energy, parts, and downtime. Below is the TCO reality every capital planner needs on the wall. Book a 30-minute demo and an OxMaint specialist will walk your TCO structure across your top asset classes — you'll leave with a clear picture of which asset classes hide the most cost below the waterline before you commit to a trial.
TCO ICEBERG · WHAT PURCHASE PRICE HIDES
10-25%
ACQUISITION
Purchase price + installation — the only number most finance teams see at approval
30-40%
Planned Maintenance
PMs, labor, spare parts, calibration over useful life
15-25%
Unplanned Repairs
Breakdowns, emergency parts, contractor callouts
10-20%
Energy Consumption
Electricity, steam, compressed air, refrigeration
5-15%
Downtime Cost
Lost production during unplanned outages
2-5%
Disposal / Salvage
End-of-life removal, hazardous disposal, trade-in
Total lifetime cost = 100%. Acquisition is the visible tip; the 75-90% below the waterline is what a CMMS-driven TCO record captures and what most capital plans systematically underestimate.
The Bathtub Curve — Where Every Food Plant Asset Actually Lives
Every asset moves through three failure-rate phases across its lifecycle — a reliability pattern first documented in the 1950s that still governs equipment behavior today. Knowing which phase your asset sits in tells you what to spend, what to monitor, and when to plan replacement. Below is the standard bathtub curve mapped to lifecycle decisions. Sign up free and OxMaint auto-tracks MTBF trend per asset — the wear-out phase surfaces as a rising failure frequency well before catastrophic failure, giving planners 12-24 months of replacement lead time.
BATHTUB RELIABILITY CURVE · LIFECYCLE PHASE → DECISION
A
INFANT MORTALITY
Months 0-12
Early failures from manufacturing defects, installation errors, commissioning gaps. Warranty period.
ACTION: Aggressive burn-in monitoring · Enforce warranty claims
B
USEFUL LIFE
Years 1-15
Stable low failure rate. Failures are random, PM prevents most. This is where the asset earns its keep.
ACTION: PM discipline · Condition monitoring · TCO tracking
C
WEAR-OUT
Years 15+
Rising failure frequency. MTBF declines. Repair costs climb toward RAV threshold. Replacement conversation.
ACTION: Repair-vs-replace analysis · Capital plan · Parts obsolescence check
Timeline ranges are typical for food plant equipment; specific assets vary. Chillers and boilers commonly hit 20-25 year useful life; centrifuges and mixers may enter wear-out at 12-15 years; electronics and PLCs often reach obsolescence before mechanical wear-out.
Every Replace-or-Repair Decision Made Without Cumulative Cost Data Is a Guess.
Plants that make capital decisions on gut feel and vendor sales pitches consistently over-repair aging assets and under-invest in replacements. OxMaint's maintenance management software builds the full TCO record automatically — every WO, part, labor hour, and downtime event costed against the asset — so replace-vs-repair conversations run on data, not opinion.
The Repair-vs-Replace Decision Framework — 5 Triggers That Justify Capital
Replacement decisions in food plants are rarely triggered by a single factor — they're triggered by a combination of financial, operational, and food-safety signals that OxMaint surfaces automatically. Below are the five triggers every reliability leader should watch. Book a scoping call and an OxMaint capital-planning specialist will walk these triggers against your top asset classes — you'll leave with a data-driven replacement backlog before you commit to a trial workspace.
01
Annual Maintenance Cost > 30-40% of RAV
When yearly repair spend crosses 30-40% of Replacement Asset Value, the math tips toward capital replacement. OxMaint auto-flags assets crossing this threshold.
02
Declining MTBF Trend (Wear-Out Signal)
Mean Time Between Failures dropping sequentially over 12-24 months indicates the asset has entered wear-out. Rising failure frequency compounds downtime cost.
03
Parts Obsolescence / Long Lead Times
When OEM discontinues parts or lead times extend past 8-12 weeks, the asset becomes a stockout risk regardless of condition. Proactive replacement beats crisis replacement every time.
04
Food-Safety Compliance Gap
Sanitary design becomes non-conforming, allergen changeover impossible without cross-contact risk, or CCP monitoring capability degrades below HACCP requirement. Compliance trumps cost math.
05
Efficiency / Energy Consumption Degradation
Older refrigeration, motors, and compressed-air systems consume progressively more energy for the same output. Modern replacements often pay back on energy alone within 3-5 years.
Spreadsheet Asset Records vs. OxMaint Lifecycle-Native CMMS
Most food plants know when a machine was bought, roughly what it cost, and that it's still running. That's not lifecycle management — that's asset registration. Lifecycle management means cumulative cost per asset, MTBF trend, condition history, and replacement forecast surfaced automatically. Here's what changes when lifecycle lives inside OxMaint. Start free — no credit card, unlimited users, and the food-plant library ships with 5-stage lifecycle templates pre-configured for processing, packaging, refrigeration, utility, and sanitation asset classes.
Food plants that run lifecycle inside OxMaint stop over-repairing aging assets and start making capital cases their CFO trusts. Start your free forever workspace to configure your first 5-stage lifecycle asset this week, or book a demo to see live TCO trending before you commit.
"
We manage roughly 640 assets across two RTE food plants — mix of processing, packaging, refrigeration, and utility. Our "lifecycle management" was a shared spreadsheet last updated in 2021, and every capital request was an argument between operations wanting to replace and finance wanting one more repair. Rolled OxMaint's 5-stage lifecycle module across both plants with historical WO data migrated in — 18 months of cost, downtime, and MTBF captured against every asset. Two-year capital plan built from actual TCO and MTBF-trend data instead of gut feel. This year's plan replaced two chillers our previous approach would have limped along for another 3 years, avoided replacing a spiral freezer that OxMaint showed was still mid-useful-life, and cut emergency repair spend 22% across the fleet. Finance stopped fighting the plan because the plan came with the numbers already attached.
Director of Engineering & Reliability · 2-Plant RTE Food Manufacturer · US Southeast
Frequently Asked Questions
What are the 5 stages of food plant asset lifecycle management?
(1) Planning and Procurement — TCO analysis, sanitary specification, vendor selection, criticality classification before ordering; (2) Commissioning and Installation — asset record, baseline condition, OEM PM schedule, warranty start, HACCP integration; (3) Operation and Maintenance — PM execution, WO capture, cumulative cost tracking, MTBF/MTTR calculation; (4) Performance Optimization — PM interval refinement, wear-out detection, parts obsolescence flagging; (5) Decommissioning and Disposal — data-driven end-of-life, salvage recovery, regulatory disposal, archive as benchmark for next acquisition.
Why is acquisition cost only 10-25% of total cost of ownership?
Because industrial food plant equipment runs 15-25 years and accumulates cost every day it operates: 30-40% of lifetime cost goes to planned maintenance (PMs, labor, spare parts, calibration); 15-25% to unplanned repairs; 10-20% to energy consumption; 5-15% to downtime cost during outages; 2-5% to disposal/salvage. Purchase price is the tip of the iceberg — the 75-90% below the waterline is where CMMS-driven TCO tracking pays back.
Sign up free to see TCO tracking in action.
When should we replace instead of repair?
Five common triggers: (1) annual maintenance cost exceeds 30-40% of Replacement Asset Value; (2) MTBF trend declines sequentially over 12-24 months indicating wear-out; (3) OEM discontinues parts or lead times extend past 8-12 weeks creating stockout risk; (4) sanitary design or CCP monitoring capability becomes non-conforming; (5) energy consumption degrades enough that modern replacement pays back on energy alone within 3-5 years. OxMaint flags all five triggers automatically per asset.
How does OxMaint calculate MTBF and MTTR?
Automatically from WO history. Every closed corrective WO on an asset feeds MTBF (Mean Time Between Failures) and MTTR (Mean Time To Repair) calculations per asset — no manual tracking. Rising failure frequency shows up as declining MTBF, giving planners 12-24 months of lead time before catastrophic failure. MTTR trend surfaces repair complexity, technician-training gaps, or spares-availability issues.
Does OxMaint handle food-safety commissioning validation (IQ/OQ/PQ)?
Yes. New asset commissioning workflow in OxMaint captures Installation Qualification, Operational Qualification, and Performance Qualification records — with baseline condition photos, calibration certificates, sanitary design verification, HACCP integration if the asset supports a CCP, and warranty start date. IQ/OQ/PQ becomes part of the permanent asset record, retrievable at audit.
Book a demo to see commissioning workflow live.
Can OxMaint integrate with our finance / ERP system?
Yes. OxMaint integrates with SAP, Oracle, NetSuite, Microsoft Dynamics, and other major ERP platforms via API — asset master, depreciation schedule, and capital plan data flow bidirectionally so lifecycle and financial views stay synchronized. Most food plants keep asset financial data in ERP as source of truth and let OxMaint own the operational/maintenance lifecycle layer — the two connect without duplication.
Is a credit card or CAPEX approval needed to start?
No. OxMaint's free forever plan requires no credit card, no CAPEX request, and no consulting engagement — you can
sign up in under 2 minutes and register your first food-plant asset with full 5-stage lifecycle template the same shift. Food-plant asset templates ship pre-built for processing (mixers, cookers, extruders, pasteurizers), packaging (fillers, sealers, wrappers), refrigeration (chillers, blast freezers), utility (boilers, air compressors, RO systems), and sanitation (CIP/COP) equipment classes.
Make Capital Decisions on Cumulative Data. Not Gut Feel and Vendor Quotes.
OxMaint's maintenance management software builds the full food plant asset lifecycle automatically — 5-stage tracking, live TCO per asset, MTBF trend, warranty alerts, parts obsolescence flagging, and replacement threshold monitoring. Capital plans your CFO can defend. Start free — no credit card, unlimited users, forever. Or book a demo for a plant-specific lifecycle walkthrough.