Higher education institutions in the United States are sitting on a collective deferred maintenance backlog exceeding $112 billion — and the gap between renewal needs and available capital grows by an estimated $7-9 billion annually. APPA's Facilities Performance Indicators program shows that the average institutional Facility Condition Index (FCI) has deteriorated from 0.12 to 0.18 over the past decade, meaning campuses are falling further behind on renewal even as they invest more capital. The core problem is not the lack of available funding mechanisms — bonds, state appropriations, tuition-funded reserves, and donor gifts all exist — but rather the inability of most facilities teams to produce the data that CFOs, trustees, and bond rating agencies require to approve capital. FCI scores, Remaining Useful Life (RUL) projections, system-level cost estimates, and 10-year renewal forecasts are the language of capital approval, and institutions that cannot produce them in auditable, defensible formats lose capital competitions to departments that can. Universities using Oxmaint's CMMS generate this data as a byproduct of daily maintenance operations — FCI scores calculated from asset condition data, RUL projections from installation dates and industry life expectancy tables, and rolling CapEx forecasts from deferred maintenance quantification. The result is capital requests that survive scrutiny and get funded. Want to build bond-ready capital documentation for your campus? Book a demo or start a free trial.
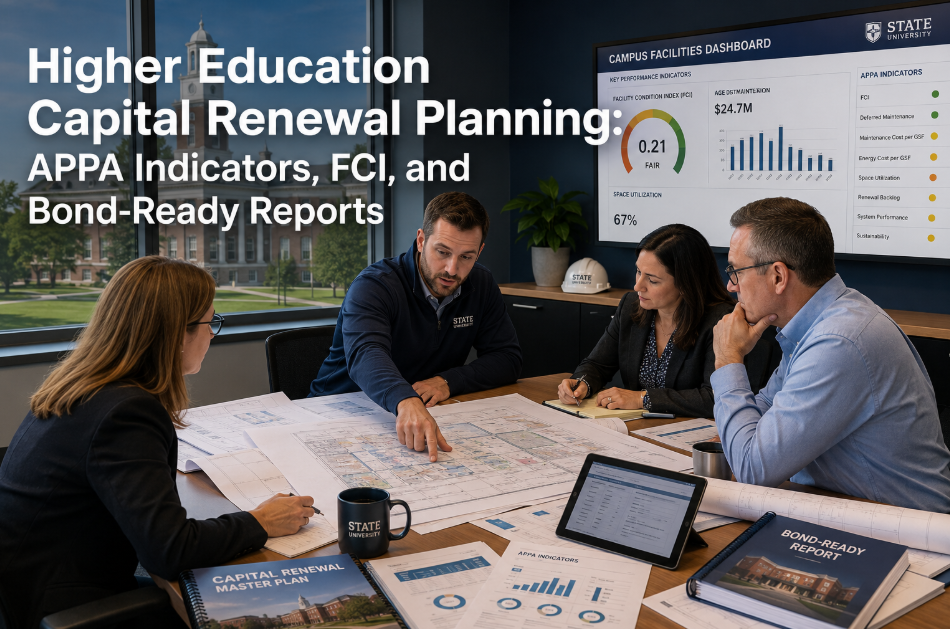
Higher Education Capital Renewal Planning: APPA Indicators, FCI, and Bond-Ready Reports
APPA Facilities Performance Indicators, FCI scoring methodology, Remaining Useful Life forecasting, 10-year CapEx modeling, and how CMMS data transforms capital requests from aspirational wish lists into funded projects.
Turn Maintenance Data Into Capital Funding
Oxmaint generates the FCI scores, RUL projections, and deferred maintenance dollar figures that trustees, CFOs, and bond rating agencies require — automatically, from your daily maintenance operations.
What Is Capital Renewal Planning in Higher Education?
Capital renewal planning is the structured process of forecasting, prioritizing, and funding the replacement and major renovation of campus building systems and infrastructure before they fail. It is distinct from deferred maintenance (backlog of overdue repairs), new construction (adding capacity), and operations maintenance (keeping current systems running). Capital renewal addresses the predictable reality that every roof, HVAC system, electrical panel, elevator, and fire alarm system has a finite useful life and will require replacement. APPA — the Association of Physical Plant Administrators — provides the framework most institutions use, centered on three key metrics: Current Replacement Value (CRV), Facility Condition Index (FCI), and the Renewal Index. The fundamental APPA benchmark is that institutions should invest 2-4% of their aggregate CRV annually in capital renewal to maintain facility condition. Most institutions invest less than 1.5%, which is why the national backlog continues to grow. The institutions that successfully capture capital — whether from state appropriations, bond proceeds, or institutional reserves — are the ones that can quantify their needs with auditable data, not anecdotal descriptions of leaking roofs and aging boilers. Oxmaint produces this data as a natural output of daily operations. Explore how CMMS-generated capital data works — book a demo or start a free trial.
APPA Capital Planning Framework: Key Metrics
The estimated cost to replace a facility at current construction costs. APPA uses CRV as the denominator for FCI calculations. Typical campus CRV: $200-$600 per gross square foot depending on building type and region.
FCI = Deferred Maintenance / CRV. An FCI of 0.05 is excellent; 0.10 is good; above 0.30 indicates a building approaching the point where renovation exceeds replacement cost. FCI drives capital prioritization.
The estimated years remaining before a building system requires replacement. RUL is calculated from installation date and industry life expectancy standards. Systems with RUL of 0-3 years are immediate capital candidates.
Annual renewal spending / annual renewal need. An index of 1.0 means the institution is keeping pace. Most institutions score 0.4-0.6, meaning they address less than 60% of annual renewal needs — and the backlog grows every year.
APPA's FPI program benchmarks institutional performance across costs, space, staffing, and condition. FPI data positions your institution against peer groups — critical context for trustee presentations and bond rating conversations.
Capital renewal is proactive — replacing systems before failure. Deferred maintenance is the backlog of overdue work. APPA data shows that every $1 of deferred maintenance costs $4.20 to address when it becomes an emergency.
Why Capital Requests Get Rejected
Facilities teams describe needs anecdotally — "the science building needs a new roof" — but cannot produce dollar-denominated deferred maintenance figures by building, system, or priority tier. 67% of rejected requests cite data insufficiency.
Without CMMS-calculated FCI data, facilities teams estimate condition subjectively. Trustees and bond advisors require auditable FCI methodology — not best guesses from walk-through impressions.
Capital decision-makers need 5-10 year projections showing when systems will reach end-of-life and what the cost curve looks like. Without RUL data, facilities teams cannot produce these forecasts.
Bond rating agencies and state appropriation committees ask for evidence that the institution has maintained assets responsibly. Without work order history, the narrative is "we neglected it and now it is broken" — the wrong message.
How Oxmaint Generates Bond-Ready Capital Data
Every asset — from individual AHUs to entire roof systems — receives a condition score (1-5 scale) updated through inspection results and maintenance history. Condition data feeds FCI calculations automatically.
Deferred maintenance dollar values divided by CRV produce building-level and campus-level FCI scores. FCI is recalculated in real time as work orders are completed or new deficiencies are identified.
Installation dates and industry life expectancy standards generate RUL projections for every system. Dashboard views show which systems reach end-of-life in each fiscal year across the next 10 years.
RUL data, condition scoring, and replacement cost estimates feed into rolling CapEx forecast models that show capital need by year, building, and system type — the exact format CFOs and bond advisors require.
Annual maintenance cost per asset is tracked and trended. When an asset's maintenance cost curve inflects — spending more each year for diminishing reliability — the data supports the capital replacement business case.
Portfolio-level dashboards show FCI by building, deferred maintenance in dollars, renewal index performance, and CapEx forecast alignment — formatted for board presentations, bond prospectuses, and accreditation evidence.
Spreadsheet Capital Planning vs. CMMS-Driven Capital Planning
Frequently Asked Questions
What FCI score should our institution target?
How much should our institution invest annually in capital renewal?
Can CMMS data support bond rating agency reviews?
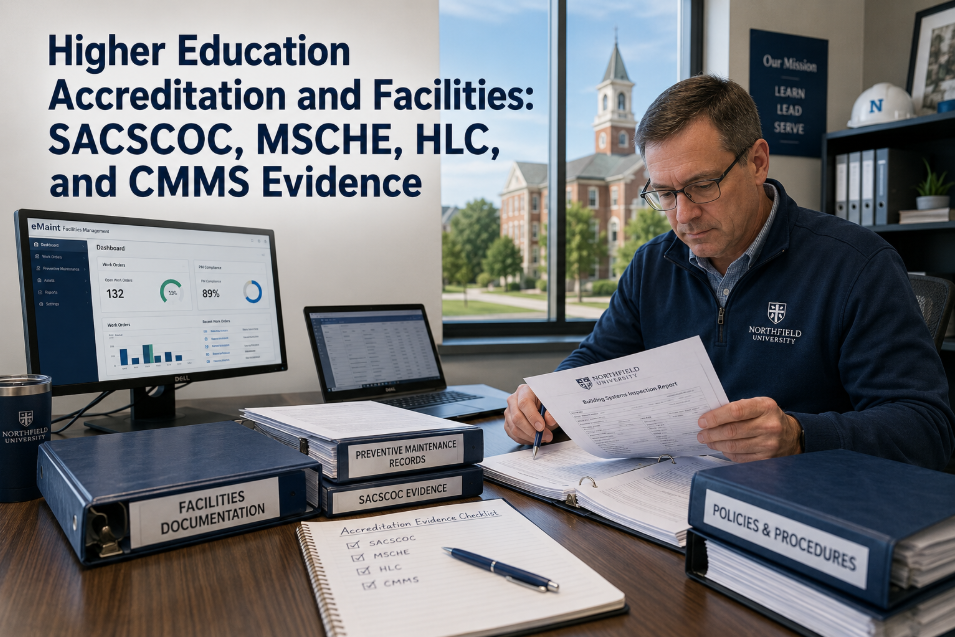
How does CMMS data support accreditation facility evidence?
Capital Gets Approved When Data Does the Talking
Every dollar of capital your institution needs is competing against other priorities. The facilities teams that win capital are the ones who present FCI scores, RUL projections, and 10-year cost forecasts in formats that CFOs and trustees trust. Oxmaint generates all of this from your daily maintenance data — no separate assessment projects, no consultant fees, no spreadsheet gymnastics.