Most campus facilities directors suspect their maintenance costs are either too high or too low — but without a standardized benchmarking framework, suspicion is all they have. The Association of Physical Plant Administrators (APPA) publishes the most widely referenced facility management benchmarks in North American higher education, including the cost-per-square-foot maintenance spending norms that allow universities and school districts to measure their operational efficiency against peer institutions managing comparable facility portfolios. The problem is that most campuses cannot use these benchmarks meaningfully because their maintenance cost data is fragmented across work orders, invoices, contractor records, and budget spreadsheets that have never been consolidated into a per-square-foot figure. When a VP of Facilities walks into a board meeting and the benchmark says $3.18 per square foot for Tier 2 institutions, but the campus cannot produce its own number with any confidence, the benchmark becomes an accusation rather than a management tool. Universities and school districts using CMMS platforms like OxMaint that automatically calculate cost-per-square-foot from real work order and asset data are not just tracking a number — they are building the operational intelligence to understand why they are above or below benchmark, which buildings are driving the variance, and exactly what intervention will bring them into the competitive range. Want to see how your campus compares against APPA benchmarks in real time, start a free trial or book a demo to walk through the benchmarking dashboard.
APPA Benchmarks: Campus Maintenance Cost Per Square Foot
How to calculate, interpret, and act on APPA facility management benchmarks using CMMS cost-per-square-foot tracking — and how to identify exactly which buildings and systems are pushing your campus above or below peer institution norms.
What Are APPA Benchmarks and Why Do They Matter?
APPA — the Association of Physical Plant Administrators — is the leading professional organization for educational facility managers in North America. Its annual Facilities Performance Indicators (FPI) report publishes benchmarked maintenance and operations data from hundreds of participating institutions, organized by institution type, size, and region. These benchmarks give facilities directors, CFOs, and boards a standardized framework to answer the question that every budget conversation eventually reaches: are we spending the right amount on maintaining our buildings?
Total annual maintenance and operations expenditure — including labor, materials, utilities, contracted services, and administrative overhead — divided by total gross square footage of maintained campus buildings. This single normalized metric allows meaningful cost comparison across institutions of different sizes, ages, and building types.
Without benchmarks, "we need more maintenance budget" is an opinion. With APPA benchmarks and your own documented cost-per-sq-ft figure, it becomes evidence. Conversely, a campus 40% above benchmark is not necessarily well-maintained — it may be inefficient. Benchmarks reveal whether variance from the norm is a funding gap or an operational problem.
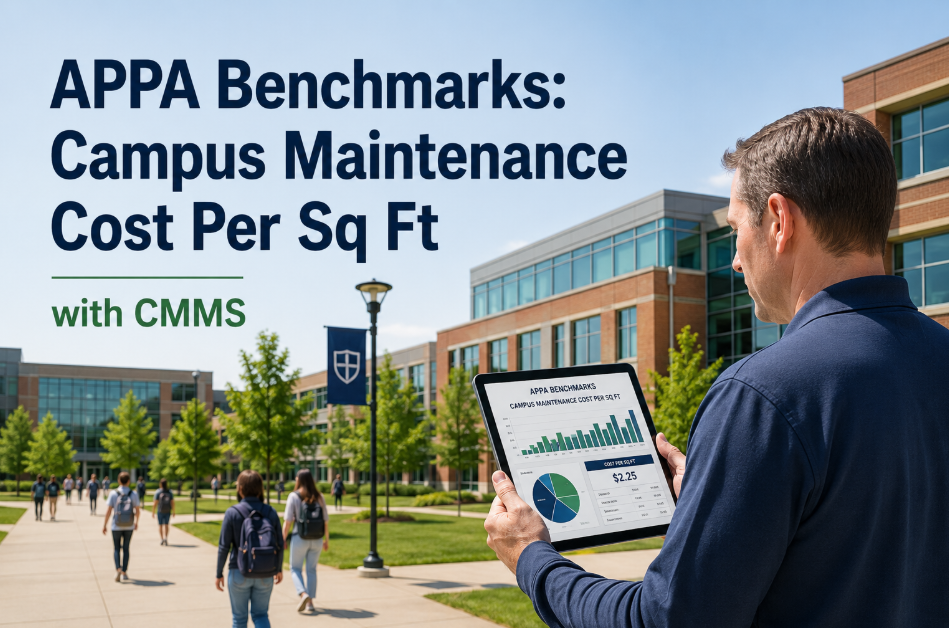
Total annual maintenance spend divided by gross maintained square footage. A campus spending $4,200,000 annually on maintenance across 1,400,000 gross square feet produces a cost-per-sq-ft of $3.00. This number then positions against the APPA benchmark range for your institution tier — revealing whether your spending is competitive, below benchmark, or above peer norms.
APPA defines five levels of custodial service — from Level 1 (Orderly Spotlessness) through Level 5 (Unkempt Neglect) — with corresponding cost expectations at each tier. Most campuses target Level 2 or Level 3. Understanding your current service level is prerequisite to interpreting your cost-per-sq-ft position against the benchmark table accurately.
The challenge is that APPA benchmarks are only useful when you can produce your own number accurately and consistently. A rough estimate assembled from department budgets gives you a number — but not the building-level breakdowns that reveal where variance is actually coming from. OxMaint produces cost-per-square-foot automatically from work order cost attribution and building square footage in the asset registry — making benchmark comparison a dashboard view rather than a month-long manual project. See how it works for your institution — start a free trial or book a demo to see the benchmarking dashboard live.
APPA Benchmark Reference: Maintenance Cost Per Square Foot by Institution Type
The table below presents APPA-derived benchmark ranges for maintenance and operations cost per gross square foot across major institution categories. Use these ranges to position your campus spend and identify whether variance requires a budget conversation or an operational intervention.
| Institution Category | Bottom Quartile | Median (Benchmark) | Top Quartile | Above-Benchmark Signal |
|---|---|---|---|---|
| Research Universities (Large) | Below $3.80 | $4.85 per sq ft | Above $6.20 | Lab-intensive buildings drive higher baseline |
| Comprehensive Universities | Below $2.90 | $3.75 per sq ft | Above $4.80 | High variance between building age cohorts |
| Liberal Arts Colleges | Below $2.60 | $3.40 per sq ft | Above $4.40 | Smaller square footage inflates per-sq-ft cost |
| Community Colleges | Below $2.10 | $2.85 per sq ft | Above $3.60 | Higher reactive ratio elevates cost above median |
| K-12 School Districts | Below $1.80 | $2.40 per sq ft | Above $3.20 | Deferred maintenance backlog primary cost driver |
| Technical and Vocational Institutions | Below $2.40 | $3.15 per sq ft | Above $4.10 | Workshop and lab equipment maintenance intensive |
Note: APPA benchmark figures are derived from the APPA Facilities Performance Indicators dataset. Actual benchmarks vary by region, building age, climate zone, and institution-specific characteristics. These ranges are directional reference points — consult the current APPA FPI report for your specific peer group comparison.
Understanding Your Benchmark Variance: What the Number Actually Means
Being above or below the APPA benchmark is not automatically good or bad news. The variance tells you that something is different — it does not tell you what or why. The diagnostic work that converts a benchmark gap into an actionable management decision requires building-level and system-level cost breakdowns that only a CMMS can produce automatically. Here is how to interpret the four most common benchmark positions.
Your campus is spending materially more per square foot than peer institutions. This could indicate a high reactive maintenance ratio (emergency repairs at 4.8x planned cost), aging building stock with high corrective maintenance demand, contractor cost inefficiency, or inadequate PM programs creating compounding repair costs. CMMS building-level cost breakdown will identify which buildings are driving the overrun.
Your campus is marginally above peer norms — which may reflect building age premium, a strategic decision to invest in higher service levels, or modest operational inefficiency. This position warrants monitoring but rarely requires immediate intervention. CMMS cost data helps distinguish between legitimate higher-cost buildings (older HVAC-intensive facilities) and unnecessary operational waste.
Your campus is operating at peer norms — which is the defensible position for board and CFO conversations. However, benchmark-level spend does not guarantee optimal operations. A campus at median cost could be achieving excellent asset condition and PM compliance, or it could be underspending on PM while accumulating deferred maintenance that will require capital expenditure within 3-5 years.
Below-benchmark spend is not evidence of efficiency — it is frequently evidence of underfunding. Campuses operating significantly below APPA median are typically deferring maintenance, accepting reduced service levels, or not capturing all maintenance costs in the calculation. CMMS deferred maintenance backlog reports document the true cost of underspending — essential evidence for budget advocacy.
How OxMaint Produces APPA-Ready Cost Benchmarking Data
APPA benchmarking is only as useful as the data quality behind your own cost figure. OxMaint structures maintenance cost capture to produce the building-level, system-level, and portfolio-level cost attribution that makes benchmark analysis genuinely actionable — not just a number to report. Here is how each platform capability contributes to your benchmarking data quality. Ready to see your campus cost data structured for APPA benchmarking? Book a demo or start a free trial to configure your asset hierarchy today.
Every building in OxMaint's asset registry includes gross square footage as a mandatory field. This denominator is fixed and consistent — eliminating the measurement inconsistencies that corrupt manual cost-per-sq-ft calculations when different departments use different square footage sources.
Every work order — internal labor, parts, and contractor costs — is attributed to the specific building and asset where the work was performed. This attribution is automatic, not manual. When all maintenance spend flows through OxMaint work orders, the building-level cost figure is always current and always accurate.
OxMaint divides total attributed maintenance cost by building square footage automatically — producing cost-per-sq-ft figures that update with every completed work order. View the metric for any individual building, any building category, or the entire campus portfolio — for any date range — without a single manual calculation.
Rank all campus buildings by cost-per-sq-ft and immediately identify outliers. A building consuming $6.80 per sq ft when the campus average is $3.20 is driving significant benchmark variance. OxMaint drills down to show exactly which system categories — HVAC, plumbing, electrical, envelope — are responsible for the specific building's elevated cost.
OxMaint tracks cost-per-sq-ft over time — by month, quarter, and fiscal year — enabling year-over-year trend analysis. A campus improving from $4.10 to $3.40 per sq ft over 24 months of PM compliance improvement has a documented ROI narrative for its CMMS investment that stands up to CFO scrutiny.
Campuses participating in the annual APPA Facilities Performance Indicators survey need total maintenance expenditures broken down by labor, materials, contracted services, and administrative cost categories. OxMaint generates this breakdown automatically from work order cost attribution — reducing APPA FPI submission preparation from days to hours.
From Benchmark Gap to Operational Action: A Decision Framework
Knowing your APPA benchmark position is the starting point. The management value comes from translating that position into specific operational decisions — which buildings to target, which cost categories to investigate, and which interventions deliver the fastest return. This framework maps benchmark variance to the specific CMMS diagnostic and action that addresses it.
Identify the 3-5 buildings consuming the highest maintenance cost per square foot. In most campuses, 15% of buildings drive 45-60% of total maintenance spend. Target these buildings for PM compliance audits, contractor rate reviews, and emergency ratio analysis before making any budget assumptions about the full portfolio.
A high emergency ratio is directly inflating your cost-per-sq-ft because emergency repairs cost 4.8x planned work. Every 10% reduction in emergency ratio reduces total maintenance cost per sq ft by approximately 12-18%. PM compliance above 90% is the single intervention that most rapidly closes the gap between your benchmark position and APPA median.
Below-benchmark spend almost always means deferred maintenance is accumulating as hidden future liability. OxMaint's deferred backlog report quantifies the dollar value of maintenance work that was identified but not funded — converting the "we are underspending" narrative into documented evidence of future cost obligation for budget advocacy.
High-cost buildings require asset-level diagnosis — not building-level. OxMaint's asset cost history report shows which specific systems within the building are driving elevated spend. A building 80% above benchmark may be driven entirely by a 35-year-old HVAC system consuming $140,000 in annual repairs — a capital replacement case, not an operational efficiency problem.
Manual Benchmark Calculation vs CMMS-Driven Benchmarking
The quality of your APPA benchmark analysis is determined by the quality of your cost data — and the building-level granularity you can access. This comparison shows why manual cost consolidation produces a number that looks like benchmarking data but cannot deliver the diagnostic insight that drives operational decisions.
| Benchmarking Capability | Manual Consolidation | OxMaint CMMS |
|---|---|---|
| Portfolio Cost Per Sq Ft | Calculated annually — often 3-4 months after fiscal year close | Real-time — updates with every completed work order |
| Building-Level Breakdown | Requires manual cost allocation — often estimated, not measured | Automatic — every work order tagged to specific building |
| System-Type Cost Attribution | Not available without extensive manual categorization | Automatic — HVAC, electrical, plumbing, envelope costs separated |
| Emergency vs Planned Cost Split | Requires work order categorization audit — rarely done | Automatic — work order origin classification built into workflow |
| Year-Over-Year Trending | Requires maintaining multiple years of manually consolidated data | Automatic — historical data retained and trended in dashboard |
| APPA FPI Submission Preparation | 2-4 weeks of manual data extraction and categorization | One-click export of APPA cost category breakdown — hours not weeks |
What APPA Benchmarking Enables for Campus Leadership
APPA cost-per-square-foot benchmarking with CMMS data quality is not just an operational metric — it is a leadership and governance tool that changes the quality of budget conversations, capital planning decisions, and strategic facility management across the institution.
How Campus Leaders Use APPA Benchmark Data in Practice
APPA benchmarking with CMMS cost data serves different strategic functions for different campus stakeholders. Each use case below represents a real management scenario where accurate cost-per-sq-ft data directly influences a high-stakes decision.
Presents cost-per-sq-ft trend showing movement from $4.20 (38% above APPA median) to $3.35 (10% above median) over 24 months of PM compliance improvement — demonstrating that the CMMS investment directly produced measurable operational efficiency gains and provides the CFO with documented evidence of value.
Uses APPA benchmark data alongside CMMS cost-per-sq-ft report to evaluate whether the facilities budget is appropriately sized relative to the institution's building portfolio. Identifies that three peer institutions with similar gross square footage operate at 15-22% lower cost — triggering a diagnostic inquiry rather than an arbitrary budget cut.
Identifies that Science Hall drives $6.90 per sq ft in maintenance costs — 112% above the campus average and 78% above APPA benchmark for research buildings. Pairs this with the building's maintenance cost history and condition score to build a documented capital renewal case that the board approves on first submission.
Uses APPA benchmark position and facility condition data as evidence of responsible stewardship in accreditation self-studies and strategic planning documents. Benchmark-at or below-benchmark cost-per-sq-ft with improving FCI scores demonstrates that the institution manages its physical assets with professional rigor — a governance quality indicator increasingly scrutinized by regional accreditors.
Frequently Asked Questions
How do we access the official APPA Facilities Performance Indicators benchmark data?
What costs should be included in the maintenance cost-per-sq-ft calculation for APPA comparison?
Our campus is significantly above the APPA benchmark — does that automatically mean we are inefficient?
How often should we review our cost-per-sq-ft benchmark position?
Know Exactly Where You Stand Against APPA — Not Next Quarter, Right Now
Your campus has an APPA benchmark position whether you know it or not. The institutions that use benchmarks as management tools — rather than annual reporting exercises — are the ones that identify cost inefficiencies before they become budget crises, build capital cases that boards approve, and demonstrate the operational rigor that accreditors and CFOs increasingly demand. OxMaint generates your cost-per-square-foot, your building-level variance analysis, and your APPA FPI submission data automatically from your daily maintenance operations. Most campuses see their benchmarking dashboard populated within the first two weeks of deployment.