Diesel pricing is annoying but predictable — one number per gallon, posted at the pump. EV charging cost is not one number. It is a rate structure with time-of-use windows, demand charges, and a peak-versus-off-peak spread that can make the exact same truck cost four times more per mile depending on when it plugs in.
Why "Cost Per kWh" Is the Wrong Starting Question
Fleet operators moving from diesel to electric often ask what electricity costs per kilowatt-hour, expecting a single number the way diesel has a single price per gallon. The honest answer is that it depends entirely on the hour of the day, the utility's rate design, and whether a single truck's charging session tips the depot into a demand-charge tier that raises the bill for every vehicle behind it.
The Rate Structures That Set the Number
Time-of-Use Pricing — Paying by the Clock
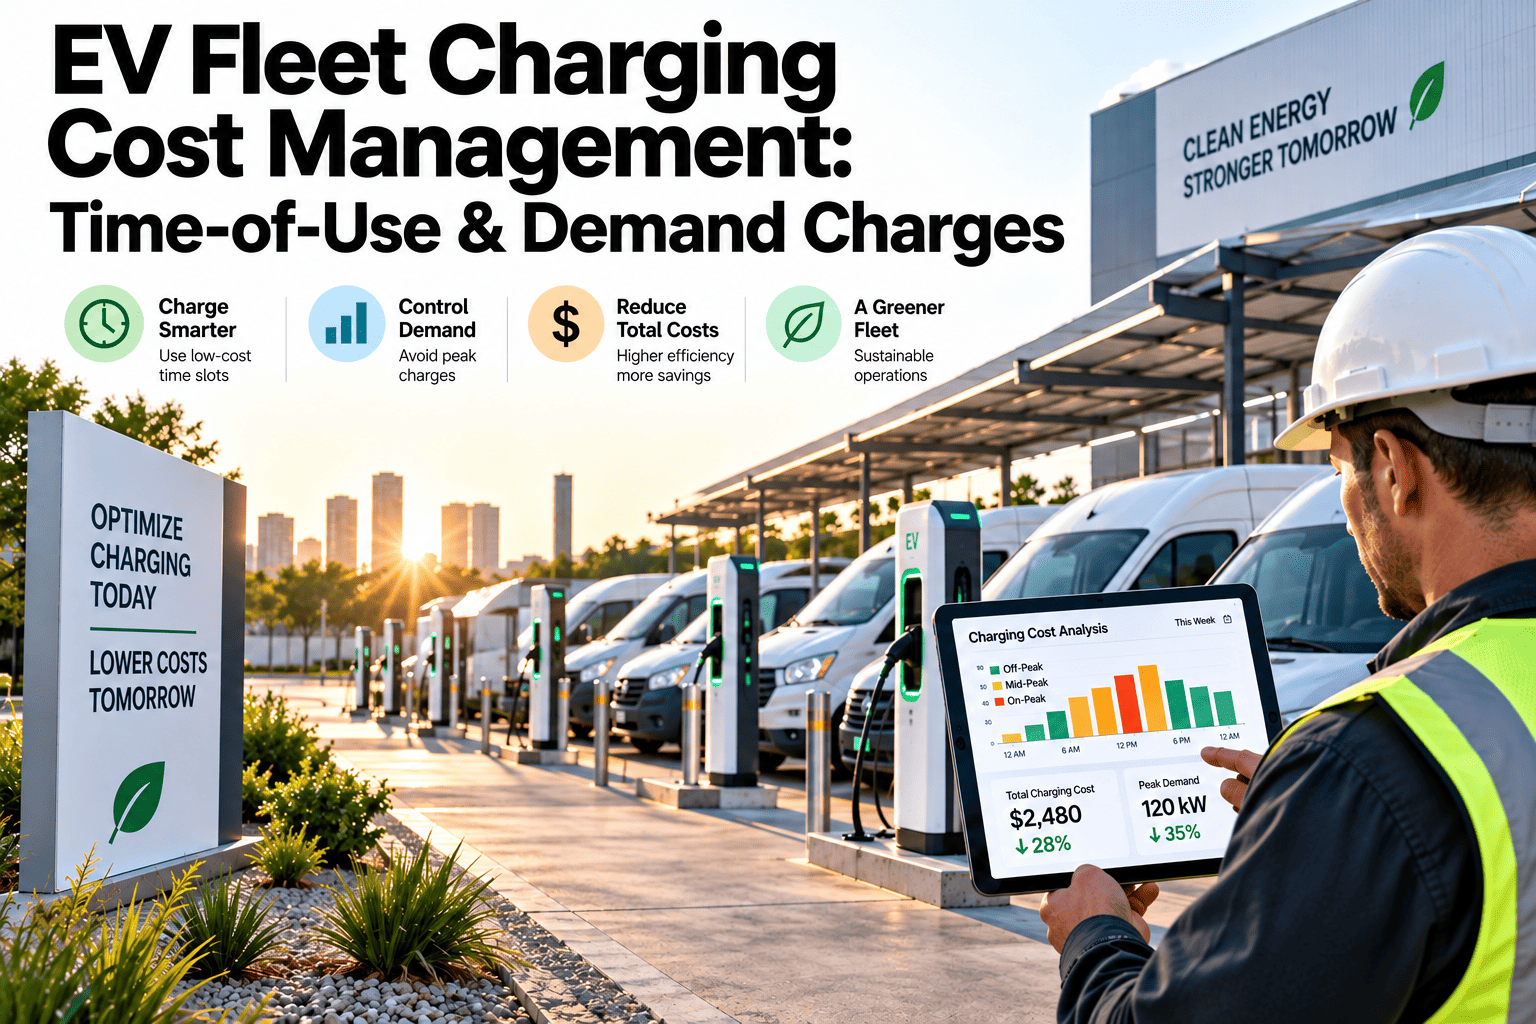
Time-of-use rate design charges different prices depending on when electricity is drawn, reflecting how expensive power is to generate at that moment. Utilities set peak windows — typically late afternoon into evening — where rates climb well above off-peak overnight pricing.
Demand Charges — Paying for the Spike, Not Just the Energy
A demand charge bills the highest 15-to-30-minute power draw in the billing period, separate from total energy consumed. A depot that charges ten trucks simultaneously at full power can set a demand peak that adds hundreds or thousands of dollars to the monthly bill — even if total energy use for the month barely changed.
Depot Charging vs Public Charging — The Numbers That Drive the Decision
A truck running 40,000 miles a year at typical Class 8 efficiency consumes roughly 12,000 kWh annually. Charged on depot Level 2 overnight, that is close to $1,800 a year. Charged on a public fast charger at peak rates, the same truck's energy bill climbs past $6,000 — a gap of more than four thousand dollars per vehicle, every year, compounding across the fleet.
Managed Charging — Software That Schedules Around the Rate
Managed charging software staggers when each vehicle draws power, so the depot's total simultaneous draw never spikes hard enough to trigger a demand-charge tier, while still finishing every vehicle's charge before its next scheduled route.
A Rate-Design Checklist Before You Sign a Utility Contract
How a Depot Actually Falls Into an Expensive Pattern
Most fleets do not choose expensive charging on purpose. It happens gradually, as delivery schedules shift and drivers start plugging in whenever a vehicle returns to the yard rather than at a coordinated time. Nobody decided to charge during peak hours — the depot simply drifted there one late return at a time.
A common version of this: a route runs late one afternoon, the driver plugs the vehicle in as soon as it arrives so it is ready for the next shift, and that session lands squarely inside the utility's peak window. Multiply that across a dozen vehicles with staggered but unmanaged return times, and the depot ends up drawing peak-rate power for a meaningful share of every day — not because anyone planned it that way, but because nobody was actively planning against it.
The fix is not asking drivers to remember better timing. It is removing the timing decision from any individual person and letting a scheduling system decide when each vehicle actually draws power, based on when it is next needed rather than when it happened to arrive.
Reading a Utility Bill Like a Fleet Manager, Not an Accountant
Most fleet managers hand the monthly electricity invoice to accounting without examining the line items that actually explain the number. Two lines matter more than the total: the energy charge, which reflects consumption at the rates in effect when it was drawn, and the demand charge, which reflects a single peak moment regardless of how the rest of the month went.
A fleet that only watches the total bill can miss which line is actually driving the increase. A depot that consumed roughly the same total energy as the prior month but suddenly saw a higher bill almost always has a demand-charge story behind it — a handful of vehicles charging simultaneously at a moment that happened to set a new peak.
What a Managed Charging Rollout Actually Looks Like
Fleets adopting managed charging software for the first time typically start with a baseline period, watching how the depot currently charges before turning on any automated scheduling. This baseline reveals exactly which hours the fleet is unintentionally paying peak rates for, and how much of the current demand charge comes from avoidable simultaneous charging.
From there, the rollout usually applies staggered scheduling to the vehicles with the most charging flexibility first — those with long overnight dwell times and no early-morning dispatch — before extending the same logic to vehicles with tighter turnaround windows. This sequencing lets the software prove its value on the easy cases before it has to make harder priority calls on vehicles with less slack in the schedule.
Regional Rate Differences Fleets Underestimate
Fleet operators moving from a single depot to multiple locations often assume the charging math they worked out for one site will translate cleanly to another. It rarely does, because time-of-use windows, demand-charge structures, and even the definition of "off-peak" vary significantly by utility and by region, not just by season.
A depot in a region with abundant off-peak hydroelectric or nuclear generation may see a relatively narrow gap between peak and off-peak rates, making the timing of charging less financially critical. A depot in a region where peak demand is met with expensive gas-peaker generation can see a much wider spread, where charging at the wrong hour costs dramatically more than charging at the right one.
This is why a fleet expanding to a new depot location should treat the utility rate review as its own step in the planning process, not an assumption carried over from an existing site. The same charging strategy that works well at one location can be meaningfully more expensive at another, purely because of how the local utility structures its rates.
Frequently Asked Questions
Track cost-per-mile, per vehicle, per charging window — alongside the rest of your fleet's operating data.