True Cost of Fleet Downtime: How to Quantify It

By Corin Hale on August 18, 2026

true-cost-of-fleet-downtime-how-to-quantify-it

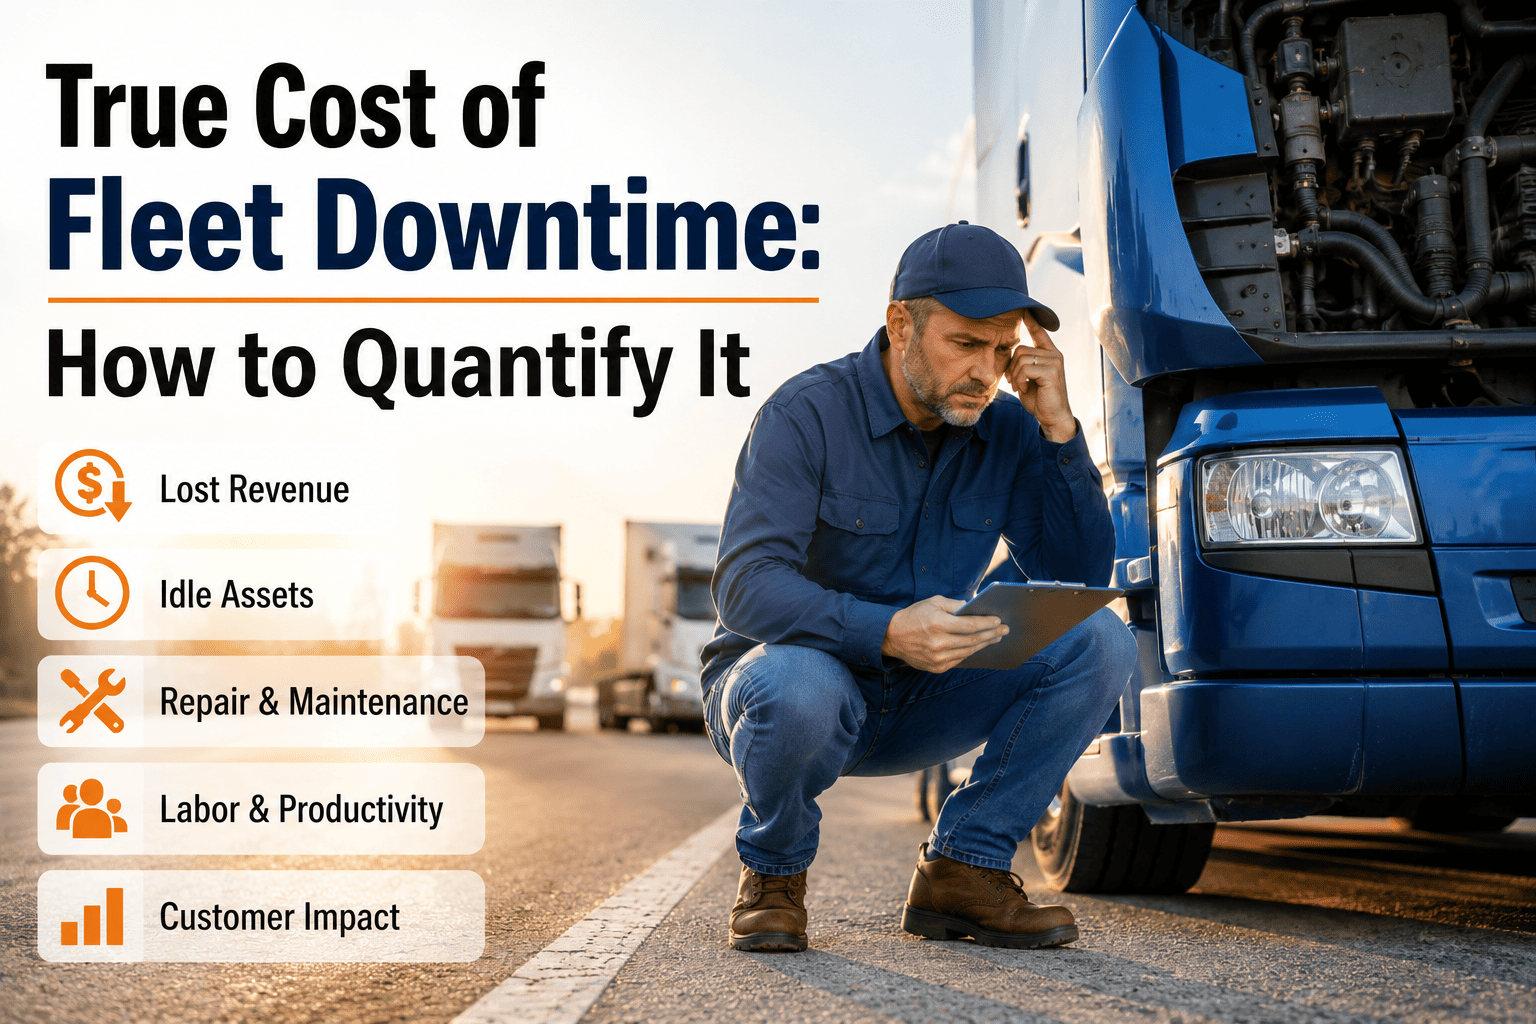
Fleet downtime is measured in dollars long before it is measured in minutes, yet most maintenance teams only ever see the smallest piece of it — the repair invoice. That single line item typically represents a small fraction of what an unplanned asset failure truly costs once lost utilization, missed delivery windows, driver overtime, expedited freight, and customer service credits are added back in. A reefer trailer parked for six hours at a cross-dock does not cost six hours of technician labor alone — it costs six missed delivery slots, a driver sitting idle on the clock, and potentially a spoiled load that becomes a customer claim. Quantifying the true cost of downtime is what separates a maintenance program that gets funded from one that keeps getting deferred, because a $600 repair bill is easy to postpone while a documented $4,200-an-hour downtime cost is not. Sign in to OxMaint to start tracking downtime cost by asset, or book a demo to see the full downtime cost model in action.

Fleet Downtime Cost · Downtime Quantification · Utilization Analytics · OxMaint AI
Downtime Isn't a Repair Bill. It's a Cascading Cost That Starts the Moment the Wheels Stop Turning.
OxMaint downtime cost tracking captures every layer of an unplanned asset failure — repair spend, lost utilization, missed delivery windows, driver overtime, and customer service credits — so operations directors can quantify the real cost of downtime and build a maintenance investment case that finance cannot dismiss.
4x
the average gap between a fleet's recorded repair cost and its true downtime cost once utilization loss and missed deliveries are added back in
$380
estimated average all-in cost per hour of unplanned downtime for a mid-size fleet vehicle, once wages, missed stops, and dispatch disruption are included
68%
of downtime cost data most fleets never capture in any system — it exists only as anecdote once the vehicle is back on the road
4x
The repair invoice is rarely more than a quarter of what an unplanned downtime event actually costs. Lost utilization, missed delivery windows, driver overtime, expedited freight to cover the load, and customer service credits compound quietly in the background — line items that land in logistics, dispatch, or sales budgets rather than maintenance, so the true cost of the failure is never connected back to its root cause. Without a system that captures all five layers against the originating asset, downtime looks cheap on paper and expensive everywhere else. OxMaint closes that gap by tying every downstream cost back to the asset and event that caused it.
DIRECT — Repair & Parts Cost
The Visible Layer: Labor, Parts, and Vendor Spend
This is the layer every fleet already tracks — technician hours, parts cost, and any outsourced vendor invoice tied to the repair. It is also the smallest share of the true downtime bill in almost every case, because it captures what was spent fixing the asset while ignoring everything the fleet lost while the asset was unavailable. OxMaint logs labor hours, parts cost by OEM or aftermarket source, and vendor invoice totals against every work order, and flags warranty-eligible repairs so recoverable cost is never left on the table.
What OxMaint Captures in This Layer
Technician labor hours logged per work order
Parts cost per repair, OEM versus aftermarket
Vendor invoice total for outsourced repairs
Warranty recovery amount where applicable
Cost Blind Spots OxMaint Closes
Repair cost recorded without linked downtime hours
Parts cost tracked in isolation from asset-level ROI
No warranty recovery follow-up on covered repairs
UTIL — Lost Utilization Cost
The Asset Sitting Idle Is Still Costing Money
Every hour an asset sits in the shop is an hour it isn't generating revenue, while its fixed costs keep accruing regardless — lease or loan payments, insurance premiums, and depreciation do not pause for a repair order. Utilization loss is the layer most finance teams intuitively understand but almost never see quantified per event, because nobody converts idle hours into a dollar figure at the point of failure. OxMaint calculates lost utilization using the asset's benchmark revenue rate and rolls the fixed-cost carry into the downtime total automatically.
What OxMaint Captures in This Layer
Daily utilization rate lost per asset class
Fixed cost continuing during downtime — lease, insurance, depreciation
Revenue-per-mile or revenue-per-hour benchmark by route or service line
Replacement or rental cost when a substitute asset is deployed
Cost Blind Spots OxMaint Closes
Utilization loss never converted to a dollar figure
Fixed costs excluded from the downtime cost calculation
No comparison against fleet-average utilization baseline
CASC — Cascading Schedule Cost
One Delay Ripples Through the Entire Day's Schedule
A single asset going down mid-route rarely stays a single-asset problem. Missed delivery windows trigger penalty clauses, drivers wait on the clock while dispatch reroutes the remaining schedule, and an expedited carrier or rush freight order is sometimes the only way to cover a committed load. These cascading costs are almost always booked as logistics or dispatch expenses, disconnected from the maintenance event that started the chain. OxMaint's cascade tracking links downstream schedule disruption back to the originating asset and downtime window.
What OxMaint Captures in This Layer
Missed delivery window count and associated penalty or credit
Driver overtime hours triggered by rescheduling
Expedited freight or contracted carrier cost to cover the load
Dispatch rework hours spent re-routing the remaining schedule
Cost Blind Spots OxMaint Closes
Downstream schedule disruption never linked back to the originating asset
Overtime hours recorded but not attributed to a downtime event
Expedite freight cost booked as logistics expense, invisible to maintenance
CSAT — Customer & Reputation Cost
The Cost That Shows Up at Next Quarter's Renewal Conversation
The last layer is the hardest to quantify and often the most expensive over time — SLA credits issued to a contracted shipper, chargebacks from a 3PL partner, and the account-level trust erosion that follows repeated missed commitments. A single late delivery rarely ends a customer relationship, but a documented pattern of downtime-driven misses becomes a line item in the next contract renegotiation. OxMaint flags accounts with repeat downtime exposure so relationship risk is visible before the renewal conversation, not during it.
What OxMaint Captures in This Layer
SLA credit or penalty issued per missed commitment
Chargeback amount from a contracted shipper or 3PL
Customer complaint or service ticket volume tied to the event
Account at-risk flag for repeat-offender downtime patterns
Cost Blind Spots OxMaint Closes
SLA penalties tracked in finance, never traced to a maintenance root cause
No linkage between downtime frequency and account churn risk
Repeat downtime on the same asset treated as unrelated incidents
OxMaint AI · Downtime Cost Intelligence
Every Hour of Downtime Has a Dollar Figure. OxMaint Calculates It Automatically, Asset by Asset.
Stop estimating downtime cost from memory at the end of the quarter. OxMaint captures repair cost, utilization loss, and cascading schedule impact in real time, then rolls it into a defensible cost-per-hour figure for every asset in your fleet.
How OxMaint AI Turns Downtime Into a Quantified Cost Figure
Technology · Cost Engine AI
Real-Time Downtime Cost Calculation
OxMaint combines repair labor and parts cost with the asset's utilization benchmark and any cascading cost inputs logged against the event, generating a live cost-per-hour-of-downtime figure that updates as the disruption unfolds rather than after the fact.
Outcome: Downtime cost visible before the asset returns to service, not estimated after
Technology · Cascade AI
Cascading Impact Correlation
OxMaint links a single asset's downtime window to the missed delivery windows, overtime triggers, and expedite freight bookings that occurred within that window, attributing dispatch and logistics costs back to the maintenance event that caused them.
Outcome: A root-cause asset identified for every cascading cost line item
Technology · Reporting AI
Per-Asset Downtime Cost Reporting
OxMaint generates rolling downtime cost reports by asset and asset class, showing total cost, cost trend over time, and comparison against the fleet benchmark — formatted for capital planning and budget justification conversations.
Outcome: A defensible downtime cost case ready for any budget review in minutes
Critical — Repeat Pattern
High-Frequency Repeat Failure Asset
An asset with three or more downtime events in a single quarter drives disproportionate cascading cost each time it fails, and is usually the strongest candidate in the fleet for a replacement-versus-repair analysis rather than another point repair.
Critical — Timing
Downtime During Peak Delivery Window
The same repair, at the same cost, produces a multiple-times-larger cascading bill when it happens during a peak delivery window instead of overnight, because every missed stop compounds against a schedule with no slack left to absorb it.
Critical — Contract Risk
Undocumented Downtime Cost at Renewal
When SLA misses driven by downtime go undocumented, the fleet loses its strongest evidence in a customer renewal negotiation and its clearest internal case for the preventive maintenance budget it actually needs.
Elevated — Parts
Extended Parts Lead Time Downtime
Parts availability, not the repair itself, is frequently what extends downtime duration — a delay that adds pure utilization loss on top of the original repair cost with no offsetting work being done.
Elevated — Attribution
Cross-Departmental Cost Attribution Gap
Logistics and dispatch costs generated by a downtime event are typically booked to operating budgets, never routed back to maintenance — understating the financial case for the prevention investment that would have avoided them.
Elevated — Rental Cost
Rental or Substitute Asset Cost Creep
Recurring rental cost to cover a chronically unreliable asset can quietly exceed the cost of proactive replacement over a year, but the two costs are rarely compared side by side in the same budget conversation.
Cost Category What It Captures Typical Cost Driver OxMaint Capture Method Visibility Without OxMaint
Direct Repair Labor, parts, vendor invoice Repair complexity, parts source Logged per work order automatically Visible
Lost Utilization Idle asset revenue and fixed-cost carry Downtime duration, asset class Calculated from utilization benchmark Hidden
Missed Delivery / SLA Penalty credits, chargebacks Timing of failure vs. schedule Linked to affected delivery windows Hidden
Driver Overtime Wage cost from rescheduling Route disruption length Tagged to originating downtime event Partially visible
Expedite / Rental Rush freight, substitute asset cost Load criticality, asset availability Recorded against the event record Hidden
Customer Churn Risk Account-level repeat-offender flag Frequency of downtime per account Trended across account history Hidden
$1.9M
in previously uncaptured downtime cost identified across a 140-unit regional fleet within the first two quarters of OxMaint downtime tracking
62%
reduction in average downtime duration per event at fleets using OxMaint cascading impact alerts to prioritize repair triage
11 min
average time to generate a complete downtime cost report for any asset during a budget review or capital planning meeting
4x
average multiplier between recorded repair cost and true downtime cost once utilization and cascading costs are included
$380
average all-in cost per hour of unplanned downtime for a mid-size fleet vehicle
68%
of downtime cost data never captured in any system without structured tracking
3+
repeat downtime events on the same asset within a quarter — the threshold OxMaint flags for replacement review
We used to report downtime as a repair number to leadership — a few hundred dollars here, a thousand there. It never looked urgent enough to fund a bigger preventive maintenance push. Once we started tracking utilization loss and cascading dispatch cost alongside the repair bill in OxMaint, the same events added up to $1.9 million in a single fleet over two quarters. That number got the budget approved in one meeting. The cost was always there — we just weren't capturing it in one place.
— Fleet Operations Director, Regional Distribution Carrier · 140 Units · Southeast US · OxMaint user since 2023

Frequently Asked Questions — Quantifying Fleet Downtime Cost

How does OxMaint calculate the true cost of a downtime event, not just the repair invoice?
OxMaint combines logged repair labor and parts cost with the asset's utilization benchmark, then adds any cascading costs entered against the event — overtime, expedite freight, and SLA credits — into one figure. Sign in to OxMaint to see the calculation for your own fleet.
Can OxMaint attribute cascading costs like driver overtime and expedite freight back to the asset that caused them?
Yes. OxMaint tags dispatch and logistics events that occur within a downtime window back to the originating asset and repair record, so cascading costs are never left disconnected from their root cause.
How does OxMaint help build a budget case for preventive maintenance investment using downtime cost data?
OxMaint produces per-asset and fleet-wide downtime cost reports trended over time, giving finance and operations a shared, defensible figure to weigh against the cost of a preventive maintenance program. Book a demo to see a sample report.
Does OxMaint track downtime cost differently for owned assets versus a rented substitute vehicle?
Yes. Rental or substitute asset cost is recorded as its own line item against the original downtime event, so fleets can compare recurring rental spend directly against the cost of proactive asset replacement.
How quickly can I pull a downtime cost report for one asset during a capital planning meeting?
A complete downtime cost history for any asset — repair, utilization, and cascading cost included — is available in minutes from OxMaint's records, ready to present without manual spreadsheet work.

Downtime Doesn't Wait for the Repair Bill to Add Up. Neither Should Your Cost Data.

Direct repair cost, lost utilization, cascading schedule impact, and customer risk — OxMaint captures every layer of downtime cost against every asset in your fleet, turning a vague sense that "downtime is expensive" into a number finance can act on.
Share This Story, Choose Your Platform!