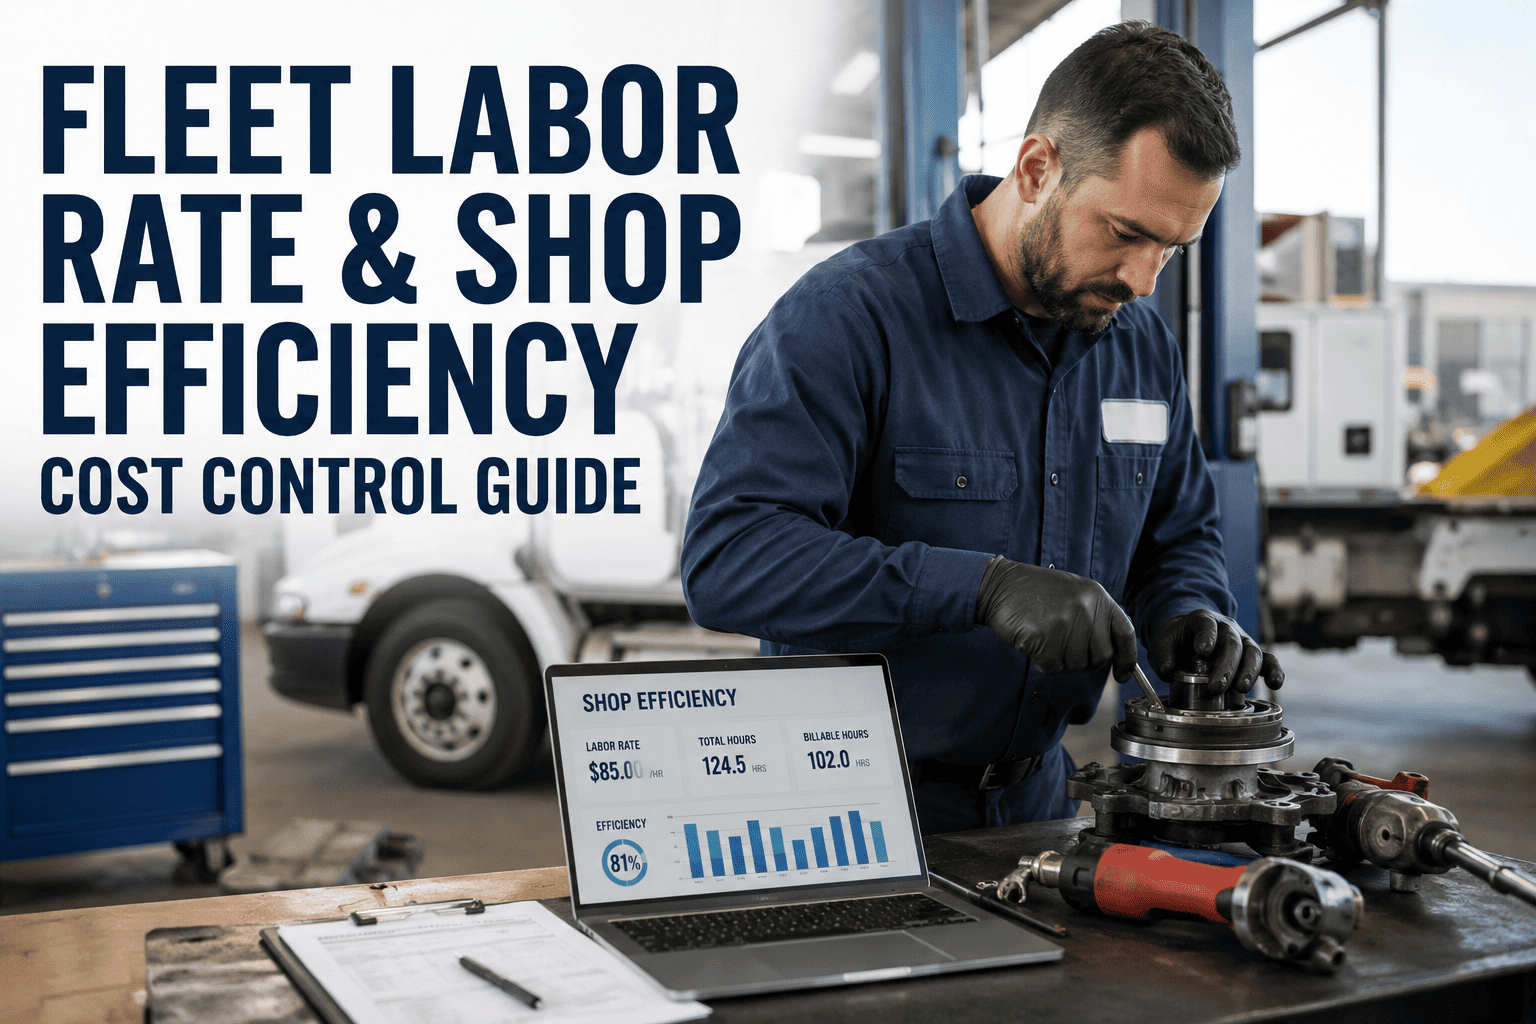
Fleet Labor Rate & Shop Efficiency Cost Control Guide
By Corin Hale on July 30, 2026
Fleet labor cost control is the single biggest lever maintenance managers have over rising in-house shop budgets — technician labor now accounts for 35–45% of total fleet maintenance spend in most operations, and unlike parts or fuel, it is highly controllable. Shop efficiency, measured as wrench time versus clock time, typically hovers at a disappointing 25–35% in shops running on paper, whiteboards or legacy systems, meaning two-thirds of every labor dollar may be leaking into overhead rather than value-producing repair work. This guide breaks down how to control fleet labor rates, improve fleet shop labor efficiency, and convert idle technician hours into measurable uptime using a CMMS-driven approach. OxMaint's AI-powered maintenance platform gives you the wrench-time tracking, shop scheduling and labor-rate visibility needed to turn fleet maintenance labor efficiency from a guess into a number you manage — you can Start Free Trial or book a personalized demo to see it on your fleet.
FLEET LABOR COST CONTROL
Is your shop labor budget quietly leaking 65% of every wrench hour?
Fleet technician labor cost is now a top-two expense for most in-house shops — and most managers can't see where the hours go. OxMaint turns fleet labor rate control and shop efficiency from a monthly surprise into a daily, data-driven decision.
of technician clock time is NOT spent turning wrenches in the average in-house fleet shop
THE COST PRESSURE
Why fleet technician labor cost is rising — and what's actually controllable
Technician wages have climbed 18–25% since 2021, yet fleet shop efficiency has stayed flat or declined. The gap between what you pay for labor and what you get in productive repair output is the cost line you can close.
Average wrench-time percentage in shops without CMMS-driven scheduling
$194K
Annual labor value lost in a 10-tech shop operating at 28% wrench time vs. 55%
Fleet maintenance labor cost rises for reasons outside your control — wage inflation, benefit increases, technician shortages, parts delays that extend bay dwell time. But the largest controllable factor sits inside your shop: how efficiently scheduled labor converts into completed, compliant work orders. When technicians wait for assignments, chase parts, repeat diagnoses or duplicate paperwork, your fleet labor rate stays the same while productive output drops. That invisible gap is where fleet labor cost management either wins or loses.
A shop paying 10 technicians $72/hr at 28% efficiency burns $194,000/year in non-productive labor. The same shop at 55% efficiency recovers most of that value without adding headcount.
WHERE HOURS LEAK
The five hidden drivers of low fleet shop labor efficiency
Before you can control fleet labor cost, you need to see where clock-time hours go missing. These five leaks account for 70%+ of the gap between what you pay for and what you get.
01
Unscheduled wait time between jobs
Technicians finish a work order and wait 20–45 minutes for the next assignment because there's no live shop schedule. At $72/hr across 10 techs, that's $360–$800/day in idle labor alone.
18%
02
Parts chasing and stockout delays
A tech leaves a bay to find a filter, belt or brake kit that isn't where the system says it is. Each parts hunt costs 15–30 minutes of wrench time and cascades into missed PM windows.
15%
03
Repeat diagnostics and missing repair history
Without centralized asset history, a different tech re-diagnoses the same intermittent fault. Duplicate troubleshooting can consume 2–4 labor hours per repeat event on complex systems.
14%
04
Paperwork and manual data entry
Paper work orders, handwritten parts logs and end-of-shift data entry eat 45–90 minutes of technician time per day — time that should be wrench time, not admin time.
12%
05
Reactive firefighting displacing planned PMs
When unplanned breakdowns hijack the schedule, preventive maintenance gets pushed. The result: higher emergency labor premiums and more repeat failures downstream.
11%
WORKED EXAMPLE
What fleet labor cost control looks like in a real shop
Consider a 180-vehicle municipal fleet with an in-house shop of 8 technicians, each paid a fully-loaded $68/hr. Annual clocked labor: 16,640 hours. Total labor spend: roughly $1.13M/year.
BEFORE OXMAINT — BASELINE
Wrench time: 26%
Productive wrench hours
4,326 hrs
Non-productive labor cost
$836K
PM compliance rate
61%
Unplanned downtime events/mo
23
AFTER OXMAINT — 6 MONTHS
Wrench time: 49%
Productive wrench hours
8,154 hrs
Non-productive labor cost
$453K
PM compliance rate
94%
Unplanned downtime events/mo
9
NET ANNUAL LABOR VALUE RECOVERED
$383,000
The same 8 technicians, same labor rate, same budget — nearly doubling productive output by eliminating schedule gaps, parts delays and paperwork drag through CMMS-driven shop efficiency.
HOW OXMAINT HELPS
How OxMaint drives fleet maintenance labor efficiency up and labor cost down
OxMaint's AI-powered CMMS platform attacks each labor-efficiency leak directly — giving managers real-time visibility into wrench time, automating shop scheduling, and eliminating the paper drag that steals technician hours.
Real-time wrench-time tracking
Digital work orders with start/stop timers capture actual wrench time per technician, per asset, per job code. Managers see a live shop dashboard showing who's wrenching, who's waiting and why — closing the visibility gap that hides 15–20% of labor cost.
Outcome: 25–40% improvement in measurable wrench time within 90 days
Automated shop scheduling & PM compliance
AI-driven scheduling auto-assigns work orders based on technician skill, availability and asset priority — eliminating the 20–45 minute gap between jobs. Preventive maintenance auto-triggers on meter readings or calendar intervals so PMs never slip.
Outcome: PM compliance rises to 90%+ and unplanned breakdowns drop 30–50%
Integrated spare-parts inventory
Parts are reserved to work orders and tracked in real time, so technicians know exactly where the filter, belt or brake kit is before they walk to the storeroom. Auto-reorder points prevent stockouts that stall bay dwell time.
Outcome: Parts-chasing time cut by 60–75%; bay turnaround improves 15–20%
Mobile work orders & full asset history
Technicians complete digital work orders on tablets or phones — no paper, no end-of-shift data entry. Every repair, PM, parts usage and diagnostic note is stored against the asset, so no tech ever re-diagnoses a problem a colleague already solved.
Outcome: 45–90 min/day of admin time per technician returned to wrench time
BENCHMARK TABLE
Fleet shop labor efficiency benchmarks: where does your shop sit?
Use these industry benchmarks to gauge where your fleet maintenance labor efficiency stands today and what target range to aim for with CMMS-driven cost control.
Shop Maturity Level
Wrench Time %
PM Compliance
Labor Cost / Unit
Typical Tools
Reactive (paper / whiteboard)
20–28%
50–65%
Baseline + 35%
Paper WOs, spreadsheets
Basic CMMS (legacy / desktop)
30–38%
70–80%
Baseline + 18%
On-prem CMMS, manual entry
Managed (modern CMMS)
42–52%
85–93%
Baseline + 6%
Cloud CMMS, mobile WOs
Optimized (AI-driven CMMS)
55–65%
94–99%
At or below baseline
OxMaint: AI scheduling, predictive PM
Shops operating at the reactive level typically pay a 30–40% premium on fleet technician labor cost without realizing it — the dollars are spent but the productive output isn't there. Moving from reactive to optimized with an AI-driven platform like OxMaint can recover $40K–$80K per technician per year in productive labor value, making the payback period on implementation typically 60–90 days.
See exactly where your technician labor hours are going — book a 30-minute demo
OxMaint will show you a live shop-efficiency dashboard on your own assets, your own work orders and your own labor rates. Most managers spot $50K+ in recoverable labor value in the first session.
Fleet labor rate and shop efficiency cost control — your questions answered
What is a good fleet shop labor efficiency benchmark?
A well-run in-house fleet shop using a modern CMMS should target 45–55% wrench time, meaning roughly half of all clocked technician hours are spent on direct, value-producing repair work. World-class shops with AI-driven scheduling and mobile work orders can reach 55–65%. If your shop is below 35%, you're likely losing $30K–$60K per technician annually to non-productive time that is recoverable. You can Start Free Trial to measure your baseline in days, not months.
How is fleet technician labor cost calculated?
Fleet technician labor cost is calculated as the fully-loaded hourly rate (base wage + benefits + overhead allocation) multiplied by total clocked hours. To get the true cost per productive repair hour, divide total labor cost by wrench-time hours only — not total hours. This reveals how much non-productive overhead is baked into every actual repair and is the number most shops underestimate by 40% or more.
How does a CMMS reduce fleet maintenance labor cost?
A CMMS reduces fleet maintenance labor cost by automating work-order scheduling, eliminating paper-based admin time, providing real-time parts availability so technicians don't chase inventory, and capturing full asset repair history so no diagnostic work is duplicated. The combined effect typically lifts wrench time from 25–30% to 45–55% within 3–6 months, recovering 30–40% of non-productive labor spend without adding headcount.
What's the fastest way to improve fleet wrench time?
The fastest wins come from eliminating the gap between jobs — implementing automated shop scheduling so the next work order is assigned before the current one closes — and replacing paper work orders with mobile digital entry to recover 45–90 minutes of admin time per technician per day. Shops using OxMaint typically see a 15–20 percentage-point wrench-time improvement within the first 90 days. Book a Demo to see the scheduling dashboard on your fleet.
How long does it take to see ROI from fleet labor cost management software?
Most in-house fleet shops see measurable ROI within 60–90 days of implementing a CMMS like OxMaint. The payback comes from three sources: recovered wrench time (worth $30K–$60K/tech/year), reduced unplanned downtime from higher PM compliance (typically 30–50% fewer breakdown events), and lower parts carrying cost from inventory visibility. For a 10-technician shop, total first-year value recovered usually ranges from $250K to $500K.
Stop guessing at labor cost. Start managing wrench time.
Every day without shop-efficiency visibility is a day your fleet labor budget leaks non-productive hours. OxMaint gives you the dashboards, scheduling and asset history to turn technician labor from overhead into measurable, manageable value.