Every plant historian is sitting on years of tag data — temperature, pressure, vibration, current draw — that almost nobody looks at until after a failure, when someone pulls up the trend to explain what happened. That data could have predicted the failure weeks earlier if anything had been watching it continuously. Historian integration with AI changes the order of operations: instead of reading the trend after the fact, OxMaint reads it as the data is written and flags the pattern that precedes a failure before the failure happens. OxMaint connects to your historian's tag stream, learns normal behavior per asset, and turns a developing anomaly into a work order automatically. Book a demo to see your own historian data put to work this way.
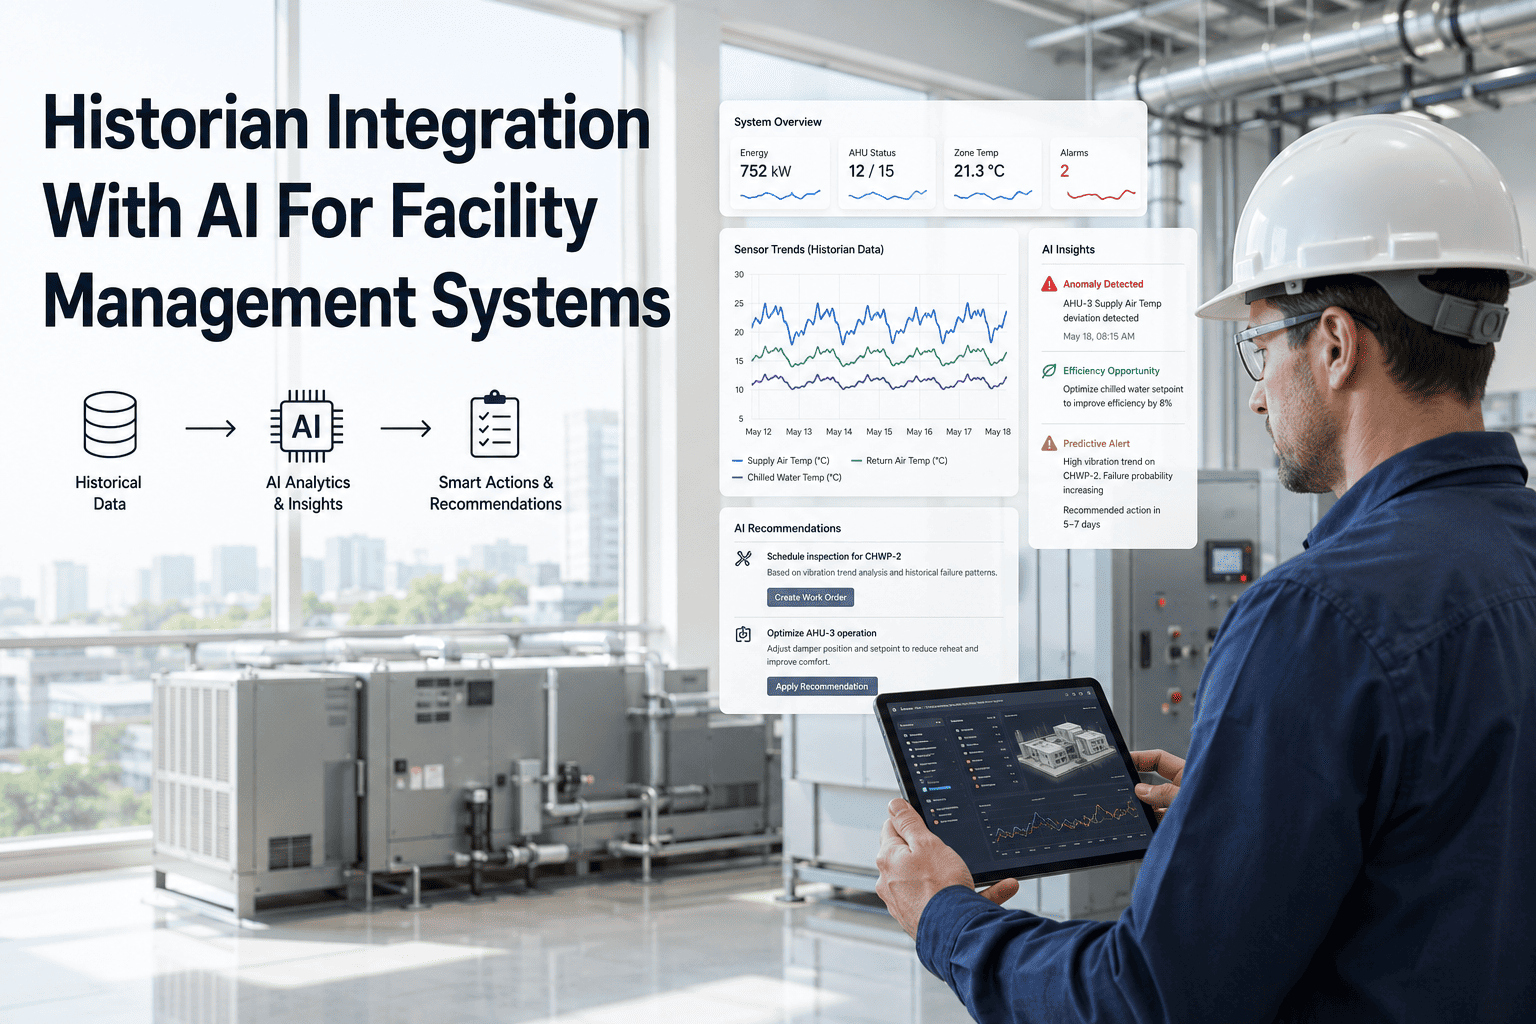
OxMaint connects to OPC and SCADA historian tags, learns normal asset behavior, and converts developing anomalies into work orders before failure.
Temperature, pressure, vibration, and current tags stream continuously from SCADA or OPC sources.
OxMaint establishes the normal operating range and cyclical pattern for each tag, per asset.
A drift from baseline raises an anomaly score, well before any tag crosses a hard alarm limit.
A work order is created with the trend attached, assigned before the asset reaches failure.
| Equipment | Leading Signal | Typical Early Window |
|---|---|---|
| Motor bearings | Vibration signature drift | |
| Pumps | Current draw and cavitation pattern | |
| Furnace / kiln refractory | Shell temperature gradient | |
| Compressors | Discharge pressure variance | |
| Conveyor drives | Torque and slip pattern |
- Data is reviewed reactively, usually after a failure
- Hard alarm limits fire only once damage has begun
- Pattern analysis depends on an engineer's manual review
- No automatic link between a trend and a work order
- Tag patterns are scored continuously, in real time
- Drift is flagged weeks before a hard limit is reached
- Detection runs automatically across every monitored asset
- Trend, asset, and assignment attached to one work order
"I've seen historian databases with five years of perfectly good vibration and temperature data that nobody ever modeled against a baseline. The data was never the problem — the missing piece was always a system that watched it continuously and knew when to raise a flag."
Your historian already has the early warning buried in years of tag data. OxMaint is the layer that reads it in time to act.