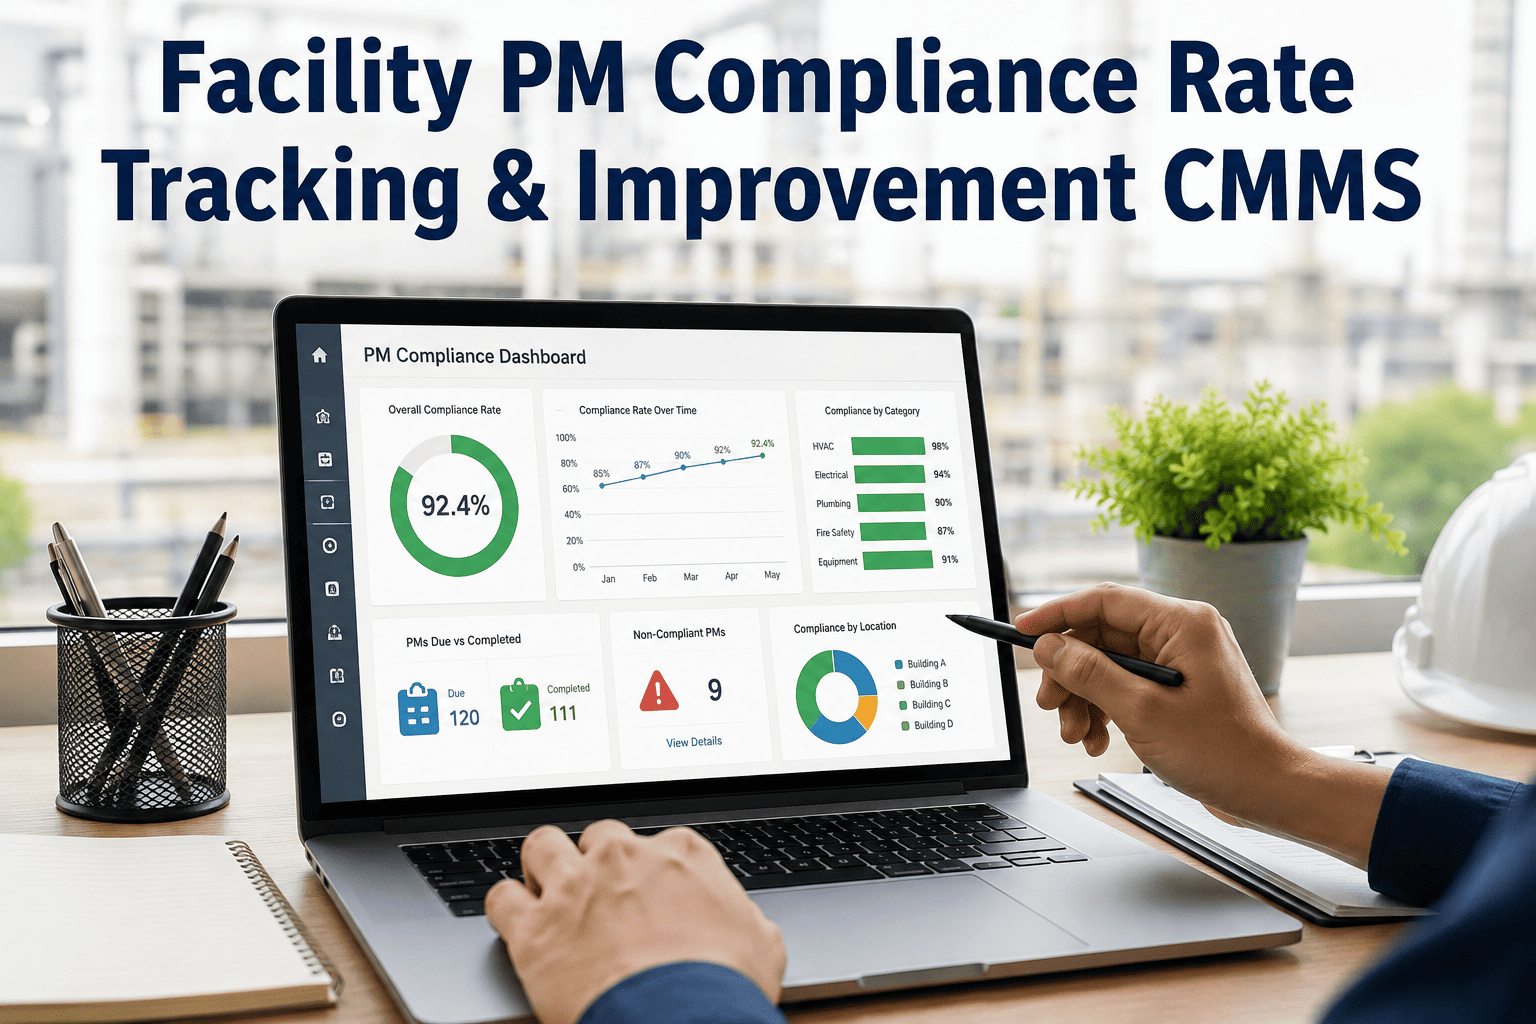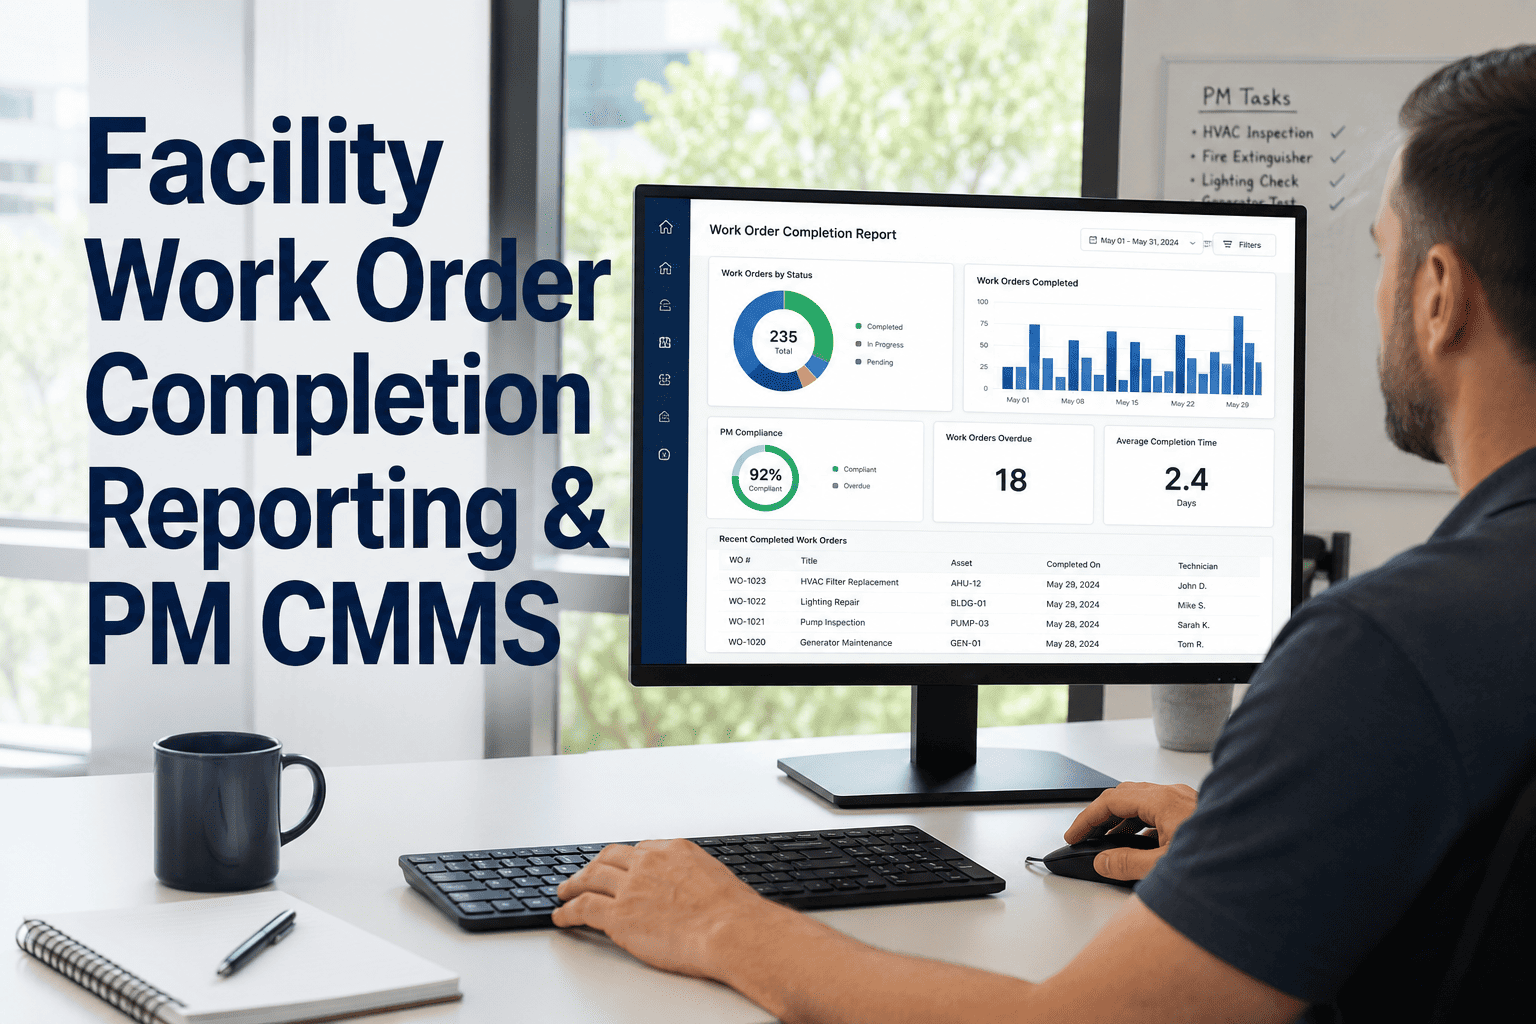
Most facility teams don't lack maintenance data — they lack a way to see it clearly. Preventive maintenance tasks get logged, work orders get closed, and technicians move on to the next call, but nobody pulls the numbers together until month-end, when a small compliance dip has already turned into a breakdown. Industry benchmarks put a strong PM compliance rate at 90% or higher, yet most facility managers can only guess where their buildings and technicians actually stand this week. A CMMS that turns raw work order data into a weekly compliance report — by building, by technician, and by task type — closes that gap before it becomes downtime. See what a live compliance report looks like for your own portfolio by booking a demo with OxMaint.
Facility Work Order Completion Reporting That Actually Predicts Breakdowns
Turn scattered work order data into a weekly compliance report — broken down by building, by technician, and by task type — so overdue PMs get caught before they become failures.
Why Weekly Reporting Beats Month-End Firefighting
A monthly maintenance report tells you what already went wrong. A weekly report tells you what is about to go wrong — while there is still time to act. Facility managers who only review compliance at month-end are reading a history book; the technician who skipped three PMs on the second floor chiller plant two weeks ago is invisible until the equipment fails and the report finally catches up. Weekly, building-level and technician-level reporting turns that history book into a live signal you can actually respond to.
The PM Compliance Formula, Visualised
Every compliance report starts with one calculation. Getting the inputs right — and pulling them automatically from closed work orders instead of a spreadsheet someone updates on Fridays — is what makes the number trustworthy.
Where Does Your Compliance Rate Land?
Not every compliance percentage means the same thing. The scale below shows how facility management benchmarks typically classify a PM compliance score, so a weekly number becomes an action item rather than just a data point.
Stop Reconstructing Compliance From Memory Every Month-End
OxMaint pulls PM compliance, overdue task counts, and technician-level completion rates from your closed work orders automatically — no spreadsheet exports, no manual tallying, no surprises at review time.
Five Report Views Every Facility Manager Needs
A single overall compliance percentage hides where the problem actually lives. These are the report views that turn one number into an answerable question.
| Report View | What It Shows | Best Reviewed | Action Trigger |
|---|---|---|---|
| By Building | PM compliance rate per property, ranked against portfolio average | Weekly | Any building below 80% flagged for a schedule and staffing review |
| By Technician | Individual completion rate, average time per task, and overdue count | Weekly | Sustained gap versus team average triggers a coaching or route review |
| By Task Type | Compliance split across HVAC, electrical, plumbing, and life-safety PMs | Weekly | Recurring category failure points to a parts or training gap |
| Overdue Task Log | Every PM past its due window, sorted by how many days overdue | Daily | 15+ days overdue escalated to the facility manager automatically |
| Compliance Trend | Rolling 12-week trend line per building, compared to prior period | Monthly | Three consecutive declining weeks triggers a root-cause review |
Overdue Task Visibility — Know How Bad It Is, Not Just That It Is
An overdue PM on day one and an overdue PM on day twenty carry very different risk. Grading overdue tasks by age turns a flat backlog list into a prioritised action queue.
A Simple Weekly Reporting Cadence
Reporting only works if it fits inside a routine someone actually follows. Most facility teams that sustain 90%+ compliance run some version of this three-touch weekly cycle.
Frequently Asked Questions
Your Next Compliance Report Should Take Seconds, Not a Weekend
OxMaint builds the weekly, by-building, by-technician compliance report automatically from your closed work orders — so overdue PMs get caught while they're still a 3-day flag, not a breakdown.