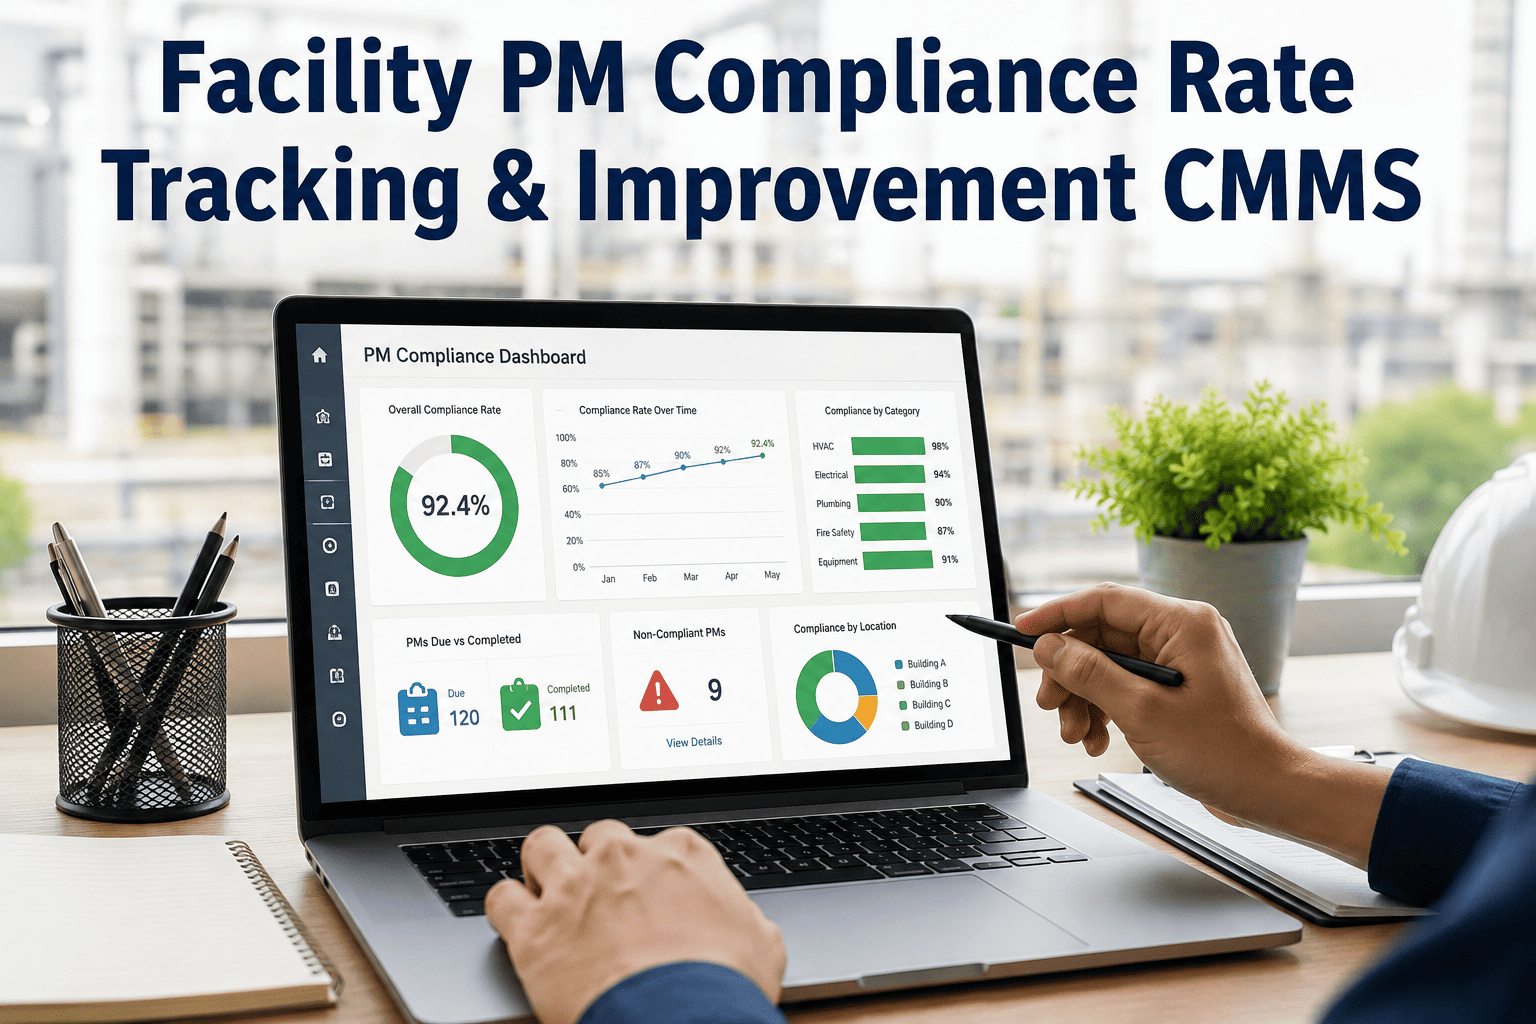
Only 90% preventive maintenance compliance separates world-class facility operations from the reactive maintenance spiral that quietly eats budgets and shortens equipment life — yet 56% of facilities still track this number on a spreadsheet updated once a month, often too late to catch the staffing gap or parts shortage causing the slide. PM compliance rate is the single most predictive leading indicator in facility maintenance: a falling number almost always shows up months before the matching spike in breakdowns and emergency repair spend. Facilities running below 80% are operating reactively whether their monthly report shows it clearly or not, and the ones stuck below 65% are already paying 4 to 6 times more per repair than a team that stays ahead of the schedule. Closing that gap starts with knowing your real number, finding the root cause, and fixing it with a system built to catch the slip early — not with more manual chasing at month end. See how OxMaint tracks PM compliance automatically from every work order your technicians close.
Is Your Facility's PM Compliance Rate World-Class — Or Just Assumed?
Preventive maintenance only protects your assets if it actually gets done on time. This guide breaks down the compliance benchmark facility managers are measured against, why the number slips, and the exact fixes that bring it back — without another spreadsheet.
What PM Compliance Rate Actually Measures
PM compliance rate is the percentage of scheduled preventive maintenance tasks completed within their required time window — not just completed eventually. A PM finished three weeks late still shows up as "done" on a basic report, but it does not count toward true compliance under the standard 10% rule used across the industry.
The PM Compliance Benchmark Scale
Not every compliance number means the same thing. Here is where the industry draws the line between a programme in crisis and one operating at world-class standard.
Why PM Compliance Slips — Root Causes and the Fix
A falling compliance rate is a symptom, not the problem. It almost always traces back to one of four causes — and each one needs a different fix.
| Root Cause | What You'll See | Compliance Impact | OxMaint Fix |
|---|---|---|---|
| Schedule overloaded vs. technician capacity | Backlog grows weekly; techs skip lower-priority PMs to keep up | Compliance drops fastest on non-critical assets first | Workload view balances PM density against real technician hours available |
| Parts not staged before PM due date | Technician arrives, job stalls, PM gets rescheduled or skipped | Chronic lateness that breaches the 10% window | Auto-reserves parts against the PM calendar ahead of the due date |
| Reactive work pulling techs off PMs | Emergency work orders spike while planned work order count falls | Compliance and planned maintenance percentage fall together | Priority locks protect Tier 1 and Tier 2 PM slots from reassignment |
| No visibility into late vs. completed | Monthly report shows "180 of 200 done" with no context on how late | Compliance number is overstated and misleads planning | Applies the 10% window rule automatically per PM frequency |
Stop Guessing Your PM Compliance Rate. See It Live, Every Week.
OxMaint calculates PM compliance automatically from every closed work order, applies the 10% window rule with zero manual math, and flags slipping assets before the monthly meeting — not after the breakdown.
The 4-Step Roadmap to Improve PM Compliance
Moving from a struggling compliance rate to a world-class one is not a one-time project — it is a repeatable weekly cadence built on four steps.
Expert Perspective
Frequently Asked Questions
Every Late PM Is a Breakdown Warning You Haven't Seen Yet.
OxMaint calculates PM compliance automatically from every work order, applies the 10% window rule with no manual math, flags at-risk assets before they fail, and gives you the weekly compliance review your programme needs to hit world-class benchmark — without another spreadsheet.