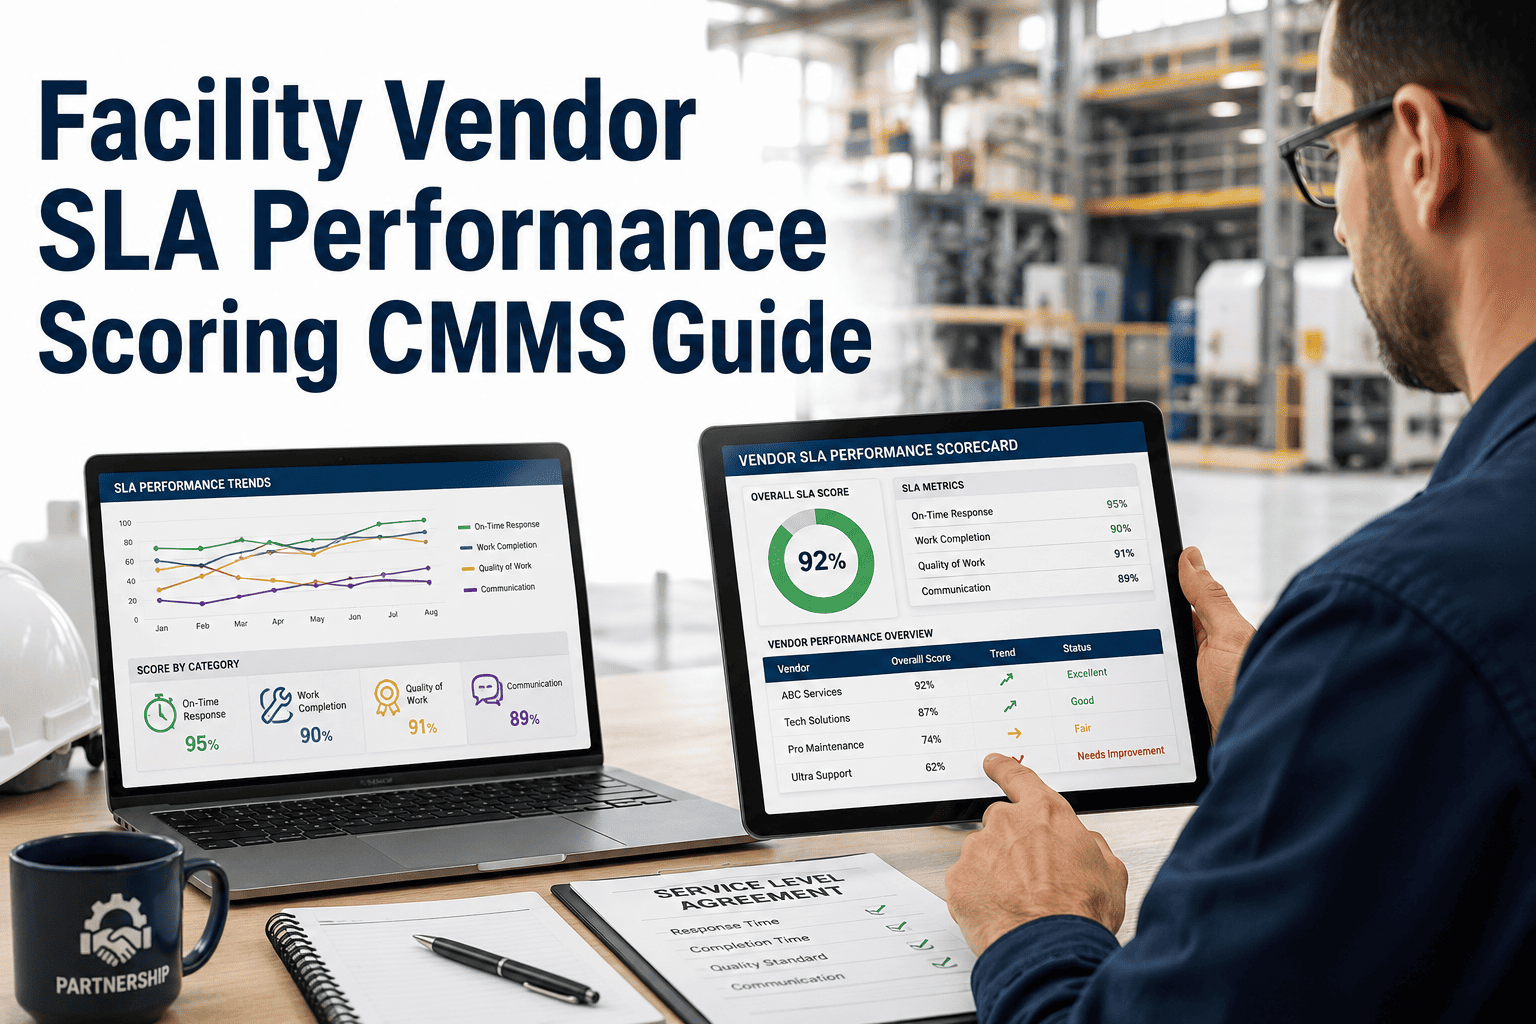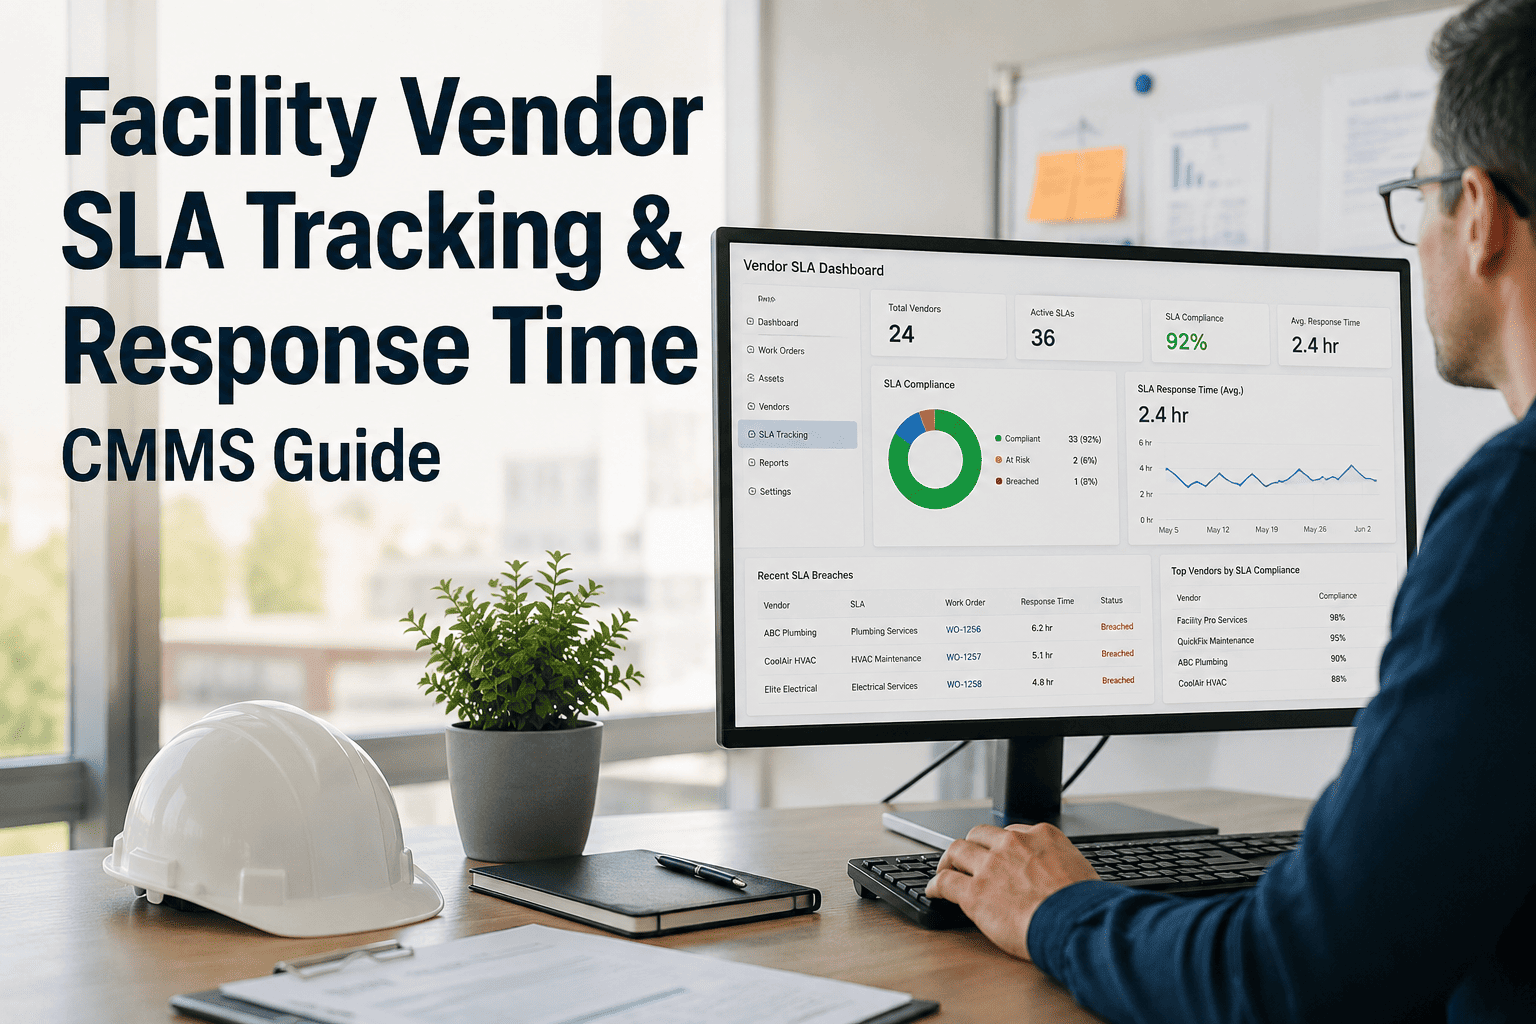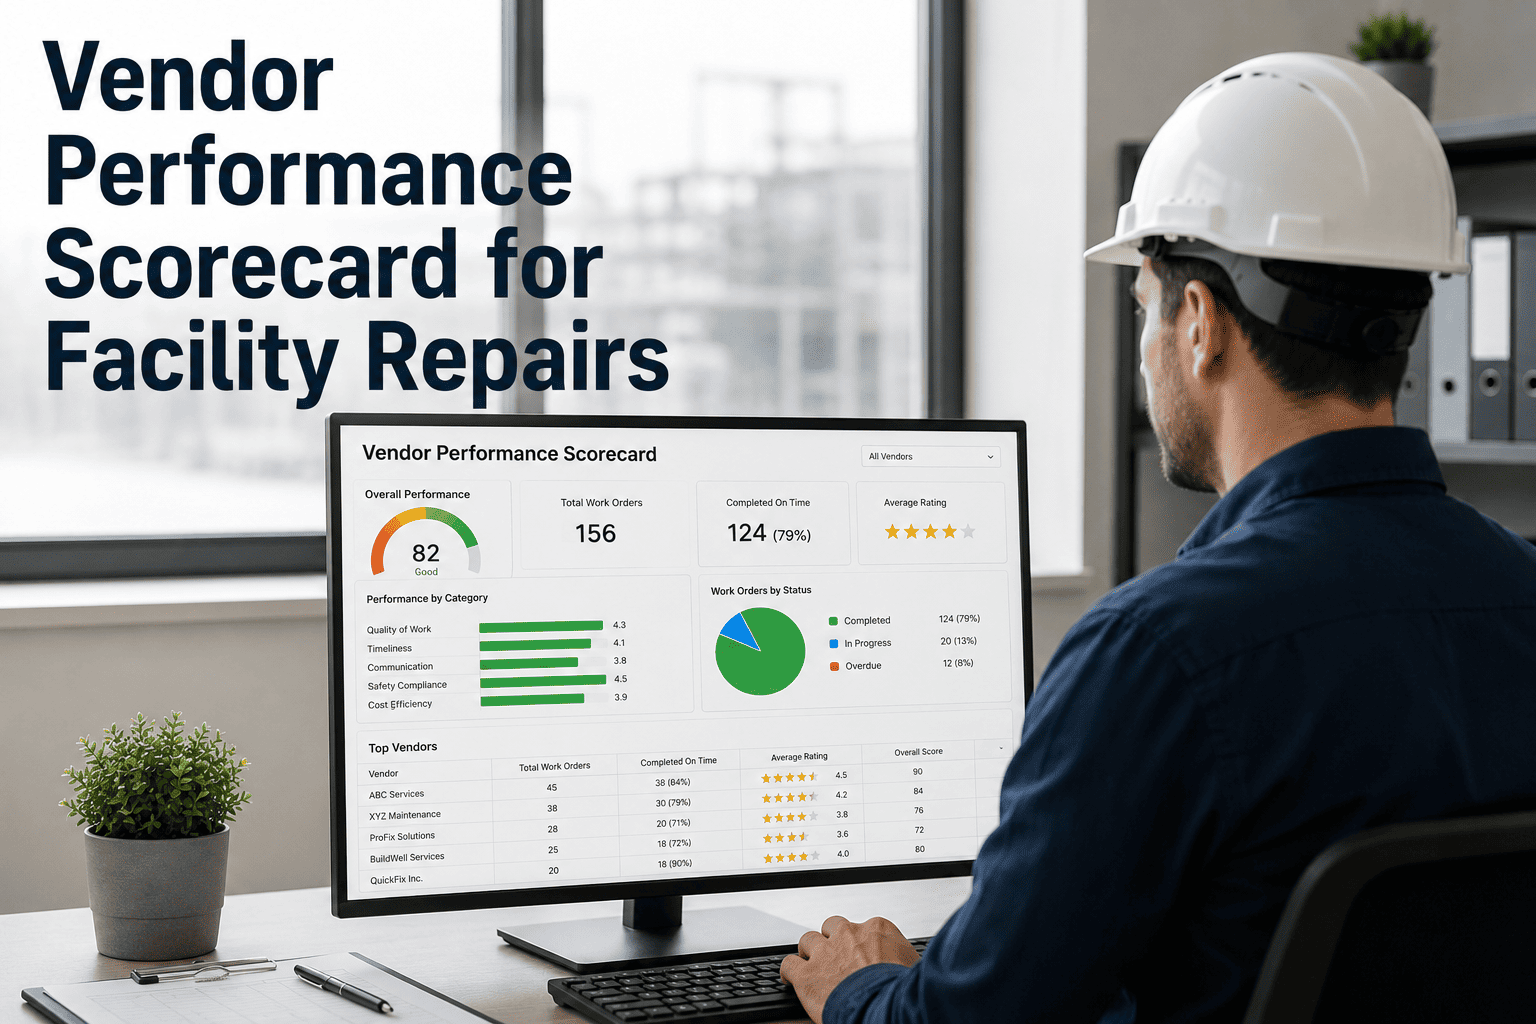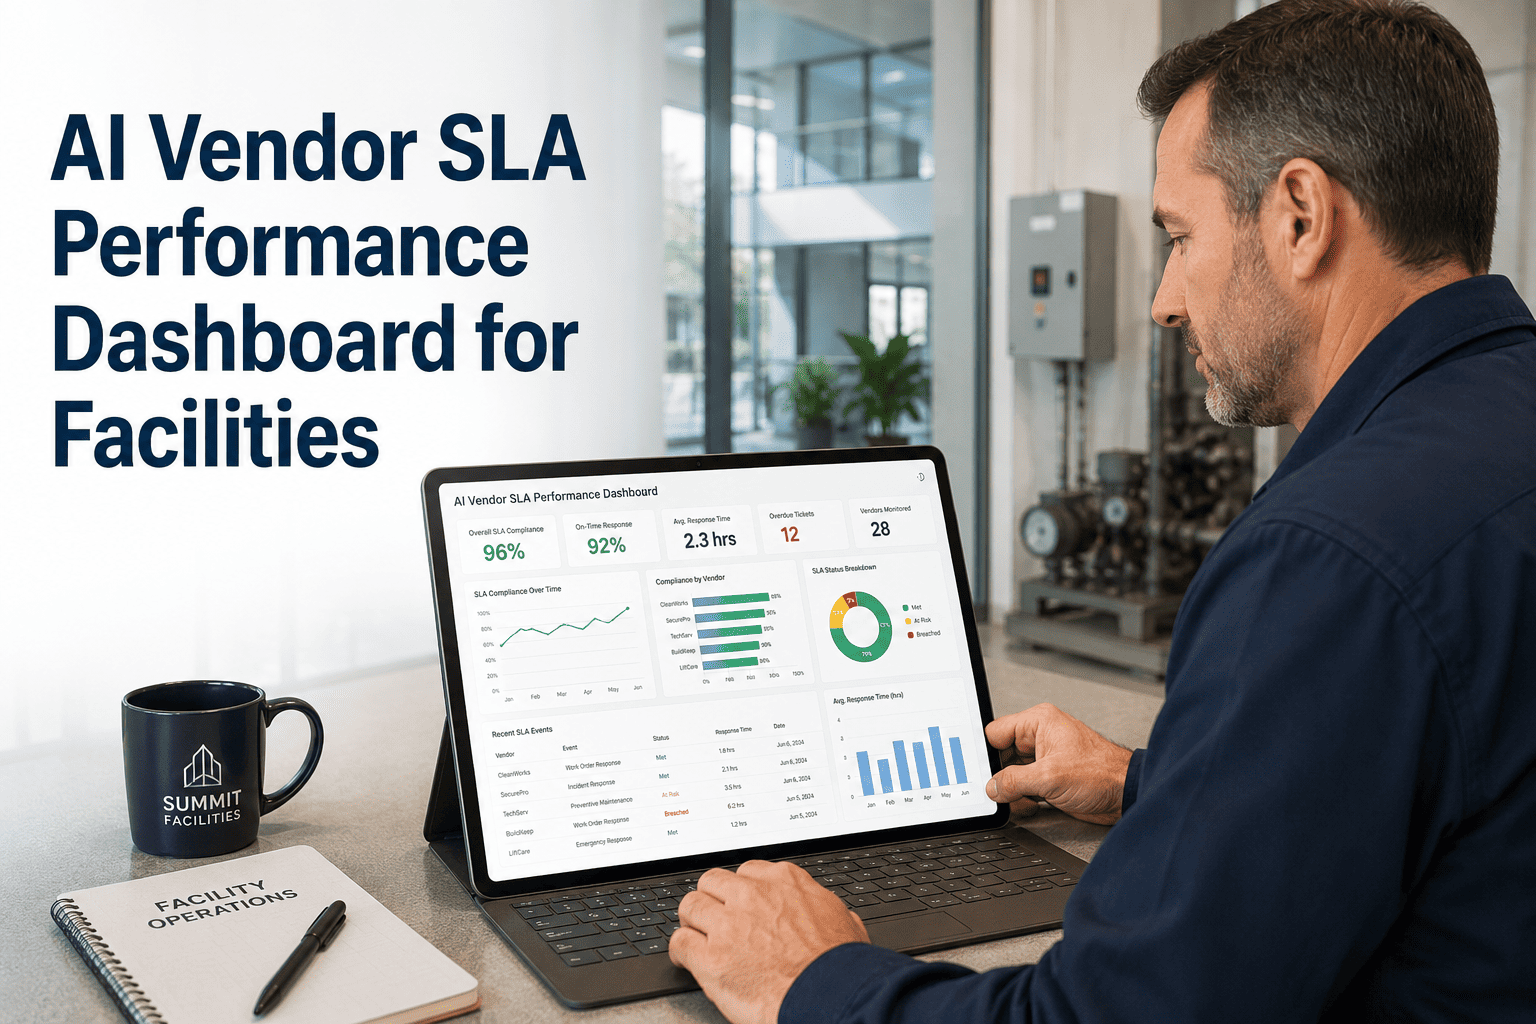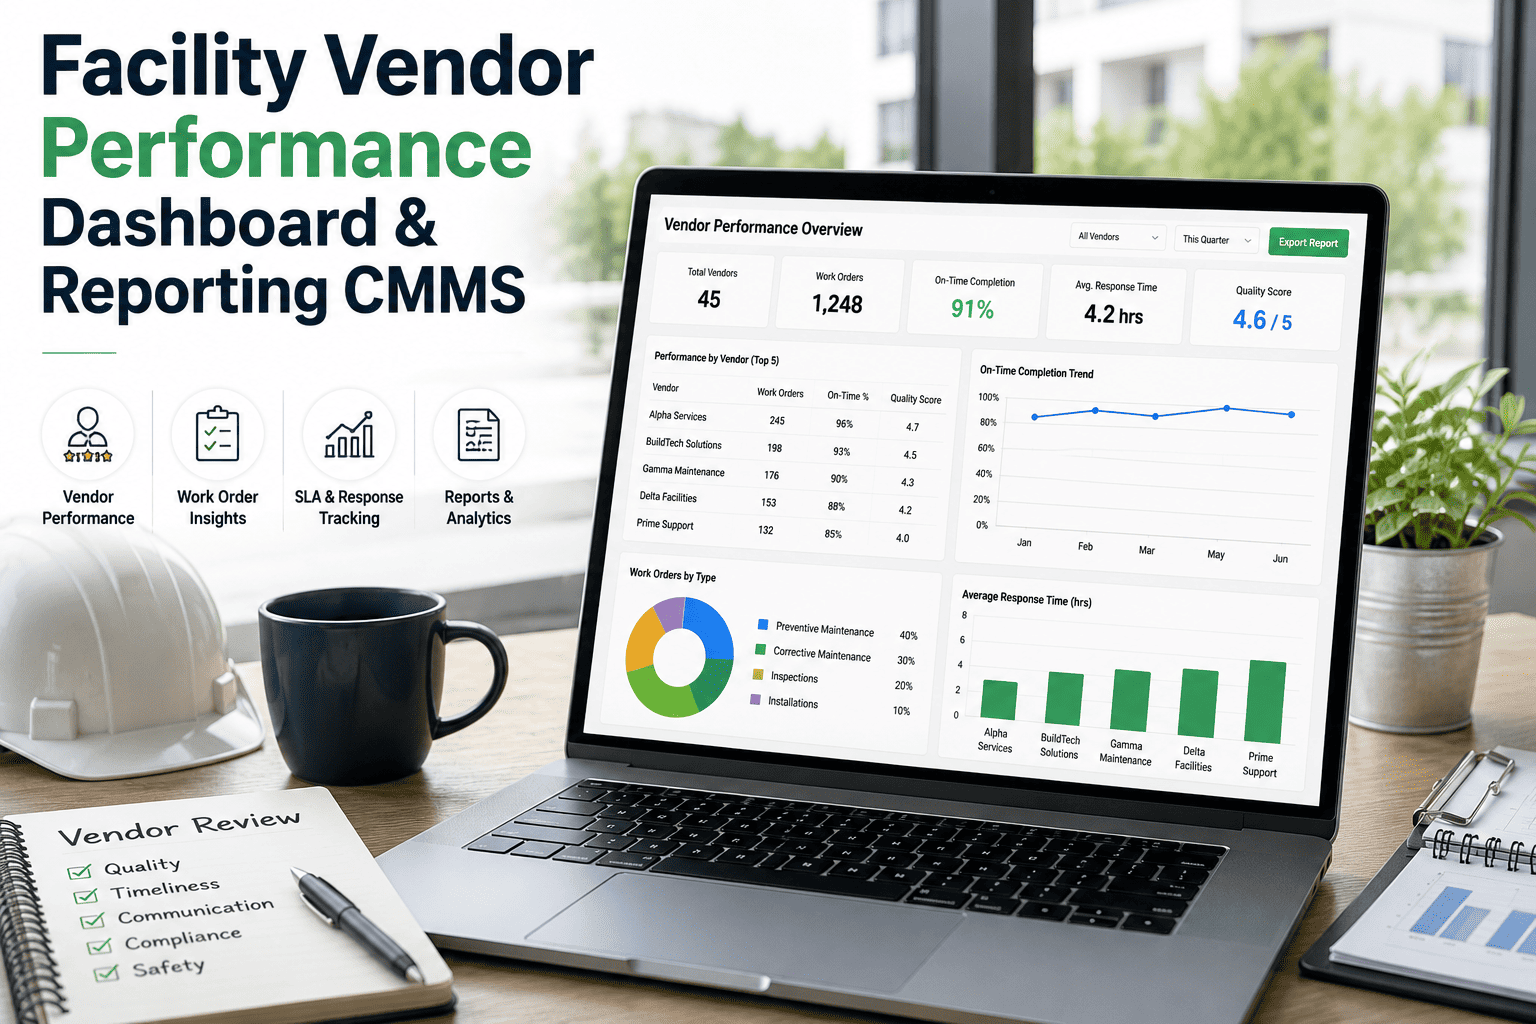
Facility teams now run dozens — sometimes hundreds — of vendor relationships across HVAC, fire-life-safety, janitorial, landscaping, and specialized trades, yet most still measure vendor health on gut feel and a monthly invoice. A facility vendor performance dashboard built on a CMMS replaces that guesswork with live response-time, completion-rate, and cost-per-job analytics you can act on. Portfolio managers using Start Free Trial typically cut late work orders by 30-45% within two quarters by tying SLA breaches to automatic scorecards. This guide walks through the metrics, formulas, and reporting cadence that turn vendor data into renegotiation leverage.
Are your vendors actually hitting SLA — or just invoicing on time?
Most facility teams track 3–5 vendors in a spreadsheet and miss the other 80% of spend. A CMMS-backed dashboard surfaces response time, first-time-fix rate, and cost-per-job across every vendor in your portfolio — in one live view.
The six KPIs every vendor scorecard must track
Industry benchmarks from IFMA and APQC show that facilities monitoring fewer than four vendor KPIs overpay by 12–18% versus peers running six or more. These are the non-negotiables.
Minutes from work-order assignment to vendor acknowledgment. Best-in-class vendors acknowledge critical work orders in under 30 minutes and routine ones under 4 hours.
Percentage of work orders resolved on the first visit without a callback or part re-order. Top-quartile HVAC and fire-safety vendors hit 85%+; below 70% signals a training or stocking gap.
Share of work orders closed by the agreed SLA deadline. A 90% threshold is the FM industry norm; every percentage point below it typically costs $1,200–$2,800 per quarter in downstream penalties.
Total invoiced labor + parts + travel divided by closed work orders. Track it by category — a $480 average for a chiller service means little until you benchmark it against the $310 portfolio median.
Work orders reopened within 30 days for the same asset and issue. Anything above 8% indicates either misdiagnosis or deferred root-cause work — both erode asset lifecycle by 11–19%.
Percentage of closed work orders with complete COIs, safety sign-offs, and asset photos attached. Critical for NFPA, OSHA, and Joint Commission audits — a 100% rate is the only acceptable target.
Formulas that turn raw work-order data into vendor grades
A dashboard without a scoring model is just charts. These three formulas — ported directly into the CMMS reporting layer — produce a composite 0–100 vendor score you can use in quarterly business reviews.
A vendor with 142 on-time closes out of 160 assigned jobs scores 88.75%. Weight this metric at 30% of the composite score — it is the single strongest predictor of portfolio uptime.
Baseline is the 12-month rolling median cost per job category for that vendor tier. A CVI of +18% means the vendor is 18% above their own historical norm — a flag, not yet a verdict.
Scores below 75 trigger a performance improvement plan; below 60, the vendor is moved to a 90-day probation list with no new work orders routed until remediation is signed off.
A 180-asset commercial portfolio spending $42K/yr on HVAC vendor A
Over 12 months, Vendor A closed 198 of 240 work orders on time (OTCR = 82.5%), held a first-time-fix rate of 71%, averaged 52-minute response, 11% rework, and 94% documentation compliance. Plugged into the composite formula, Vendor A scores 74.2 — just under the 75 threshold. The facility manager routes the scorecard to the vendor, sets a 60-day improvement target on rework and FTFR, and holds $9K of planned spend in escrow until the next review. Two quarters later the vendor's rework drops to 6%, FTFR climbs to 83%, and the composite hits 81.7. That is the dashboard doing its job: measurable behavior change, not a phone call.
A 30-60-90 day rollout timeline for live vendor reporting
Teams that attempt a big-bang vendor dashboard launch stall at 40% adoption. A phased 90-day rollout — benchmark, score, act — consistently lands at 85%+ vendor participation by day 90.
Benchmark & Baseline
Import 12 months of historical work orders into the CMMS. Tag every vendor by trade and tier. Establish baseline OTCR, FTFR, cost-per-job, and rework rates. Output: a one-page baseline scorecard per vendor, shared internally only.
Score & Share
Switch the dashboard to live mode. Begin sending monthly vendor scorecards automatically from the CMMS. Hold a 30-minute QBR with each vendor covering their composite score, top failure mode, and one improvement target. Expect pushback in week 5 — it is normal.
Act & Renegotiate
Tie score thresholds to contract terms: vendors above 85 get priority routing; vendors below 60 enter probation. Use the CVI trend line to renegotiate unit rates — most portfolios recover 6–11% of annual vendor spend in this window.
What changes when vendor data moves from spreadsheet to dashboard
The shift is not cosmetic. Facilities that replace manual vendor tracking with a CMMS dashboard report 3× faster issue resolution and 40% less time spent on vendor administration.
| Dimension | Spreadsheet tracking | CMMS vendor dashboard |
|---|---|---|
| Data freshness | Updated monthly, often stale by week 2 | Live — refreshed on every work-order state change |
| Vendor count covered | 3–8 key vendors; long tail ignored | All vendors, every trade, every site |
| Scoring method | Manual gut rating, 1–5 scale | Weighted composite 0–100, formula-driven |
| Time to spot a failing vendor | 60–90 days (after complaints pile up) | Same day — breach triggers an alert |
| Renegotiation leverage | Anecdotal, emotional, contested | Data-backed, benchmarked, hard to dispute |
| Admin hours per month | 22–30 hours compiling reports | Under 4 hours reviewing auto-generated views |
What facility teams see within the first quarter
"We caught an HVAC vendor billing 22% above their own 12-month baseline for the same chiller service. One conversation, backed by the dashboard, reset the rate and saved $11K that quarter alone."
"The composite score changed the conversation with vendors. Instead of arguing about whether service was 'good,' we were looking at an 78 versus an 86 and talking about the two metrics that closed the gap."
Stop managing vendors on invoices. Start managing them on data.
Stand up a live vendor performance dashboard in under a week. Import historical work orders, auto-generate scorecards, and send your first QBR-ready report by day 14.
Vendor performance dashboard — common questions
How much historical work-order data do I need before the dashboard is useful?
A minimum of 90 days gives directional signals, but 12 months of history is the sweet spot — it covers seasonal cycles, lets you establish a defensible baseline cost-per-job, and smooths out one-off events. Most CMMS implementations can import 24 months of CSV work-order data in under two hours, and the dashboard begins calculating composite scores the moment the import completes. If you have less than 90 days, start anyway; the baselines simply tighten as data accrues.
Can vendors see their own scorecard, or is it internal only?
Both modes are supported. Most teams run internal-only for the first 30 days to validate the numbers, then switch on a vendor-facing portal where each vendor sees their own composite score, trend line, and rank within their trade — but never another vendor's data. Vendor-facing transparency is the single biggest driver of behavior change; portfolios that share scorecards see 2.3× faster improvement than those that keep them internal. You can configure access in Start Free Trial by vendor and by site.
What happens when a vendor disputes a low composite score?
Every component of the score is traceable back to individual work orders — the dashboard links the composite to the exact jobs, dates, and SLA thresholds that dragged it down. In a QBR, you open the scorecard, click through to the work-order list, and review the specific incidents together. Disputes drop sharply because the conversation shifts from opinion to documented events. Vendors who consistently dispute documented breaches typically score below 60 and are candidates for probation or replacement.
Does the dashboard handle vendors across multiple sites and trades?
Yes — vendor records are site-aware and trade-tagged, so a national janitorial vendor can be scored per site, per region, or rolled up to a portfolio-level composite. This matters because a vendor may perform well at one site and poorly at another due to local crew quality. The dashboard defaults to per-site scoring for exactly this reason, with a roll-up view for executive reporting. You can see a live multi-site, multi-trade demo at Book a Demo.
How is this different from the reporting I already get from my work-order system?
Standard work-order reporting tells you what happened — 42 jobs closed, 6 late, 3 callbacks. A vendor performance dashboard tells you why it happened and what to do about it: Vendor A is 22% above cost baseline, Vendor B's rework rate is trending up for three consecutive months, and Vendor C should get priority routing because their composite is 89. It converts operational data into vendor management decisions, automatically, every month, without a spreadsheet in sight.
Your vendors are generating data right now. Are you using it?
Every late work order, every callback, every over-billed job is already in your system. A vendor performance dashboard turns that into scorecards, alerts, and renegotiation leverage — starting today.
Free 14-day trial · No credit card