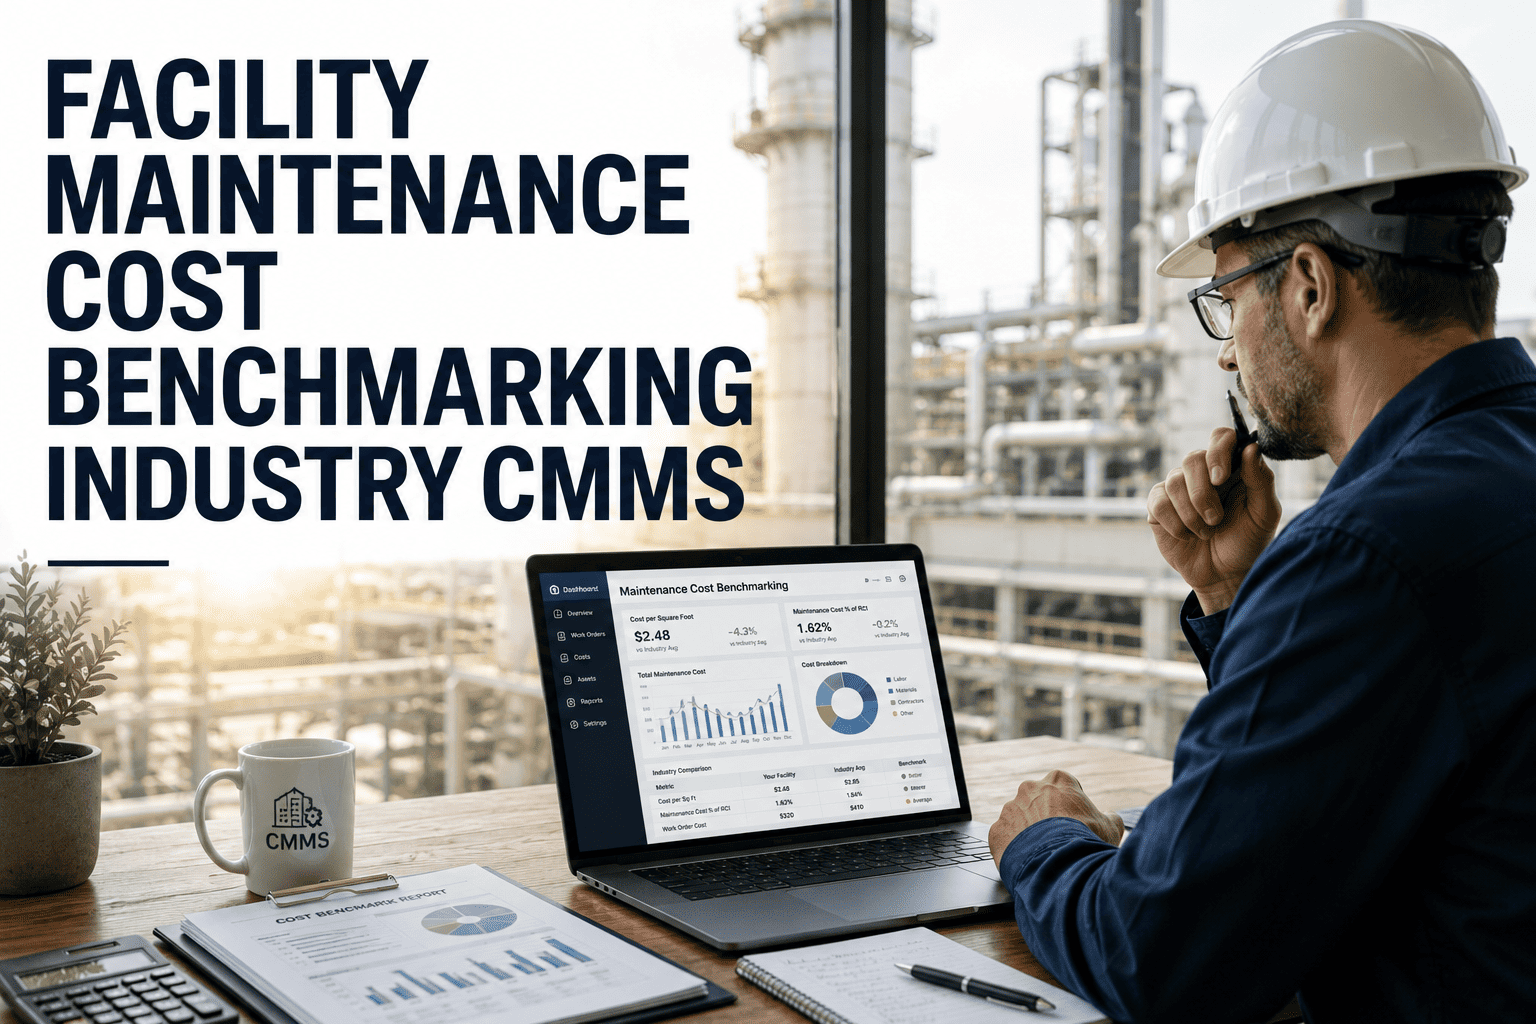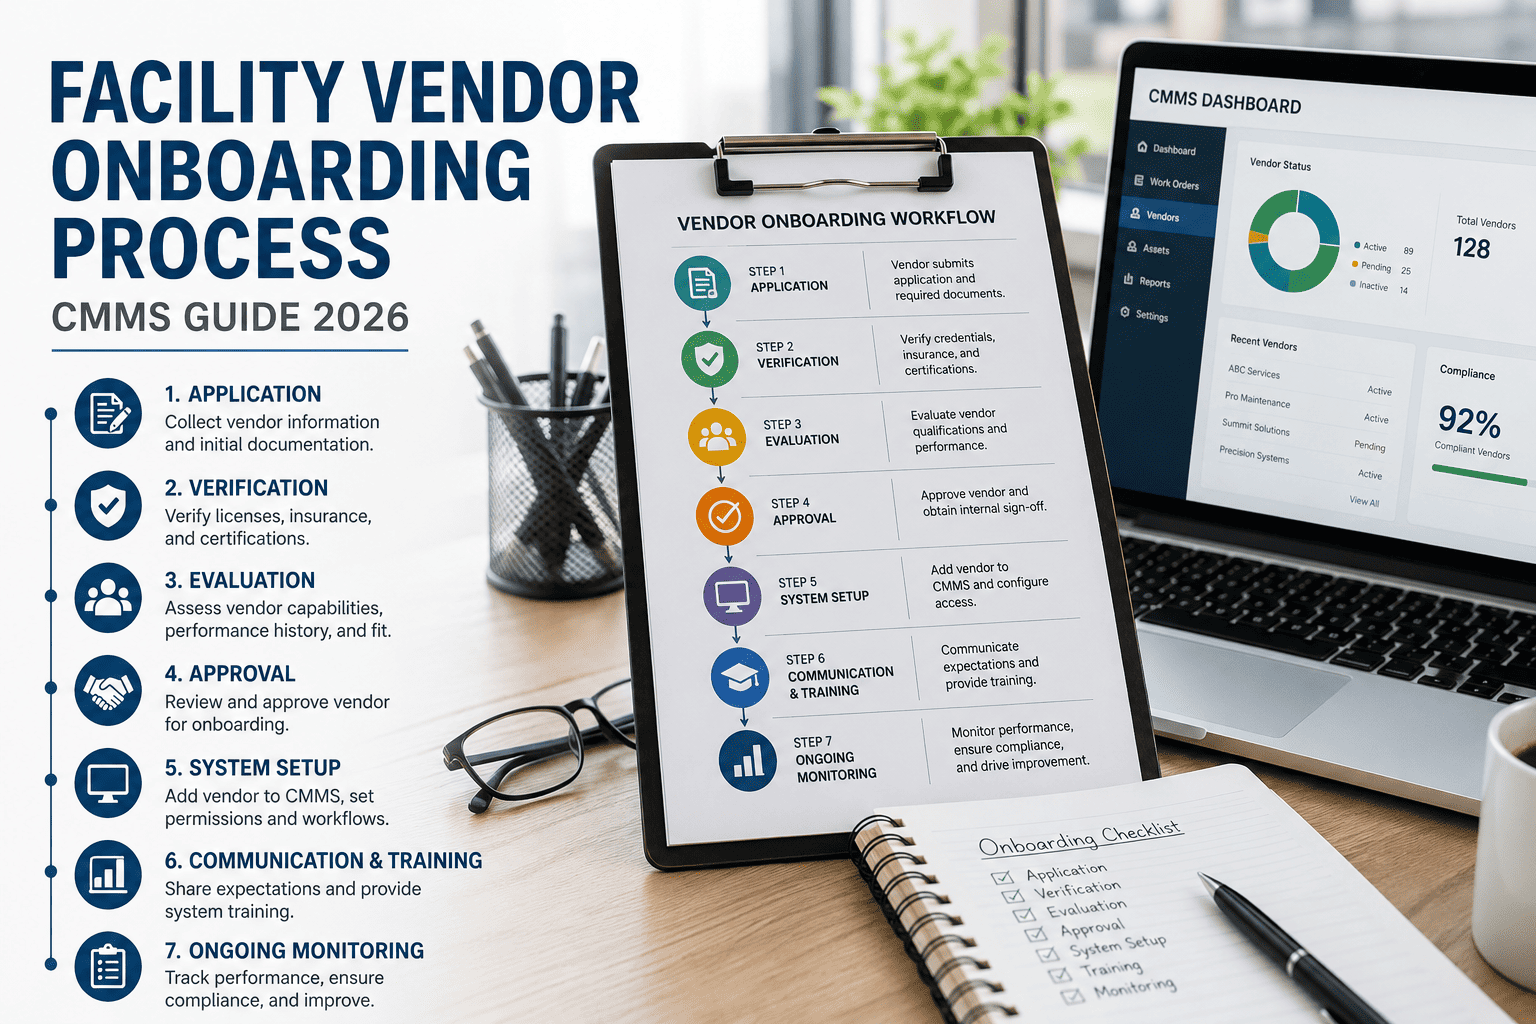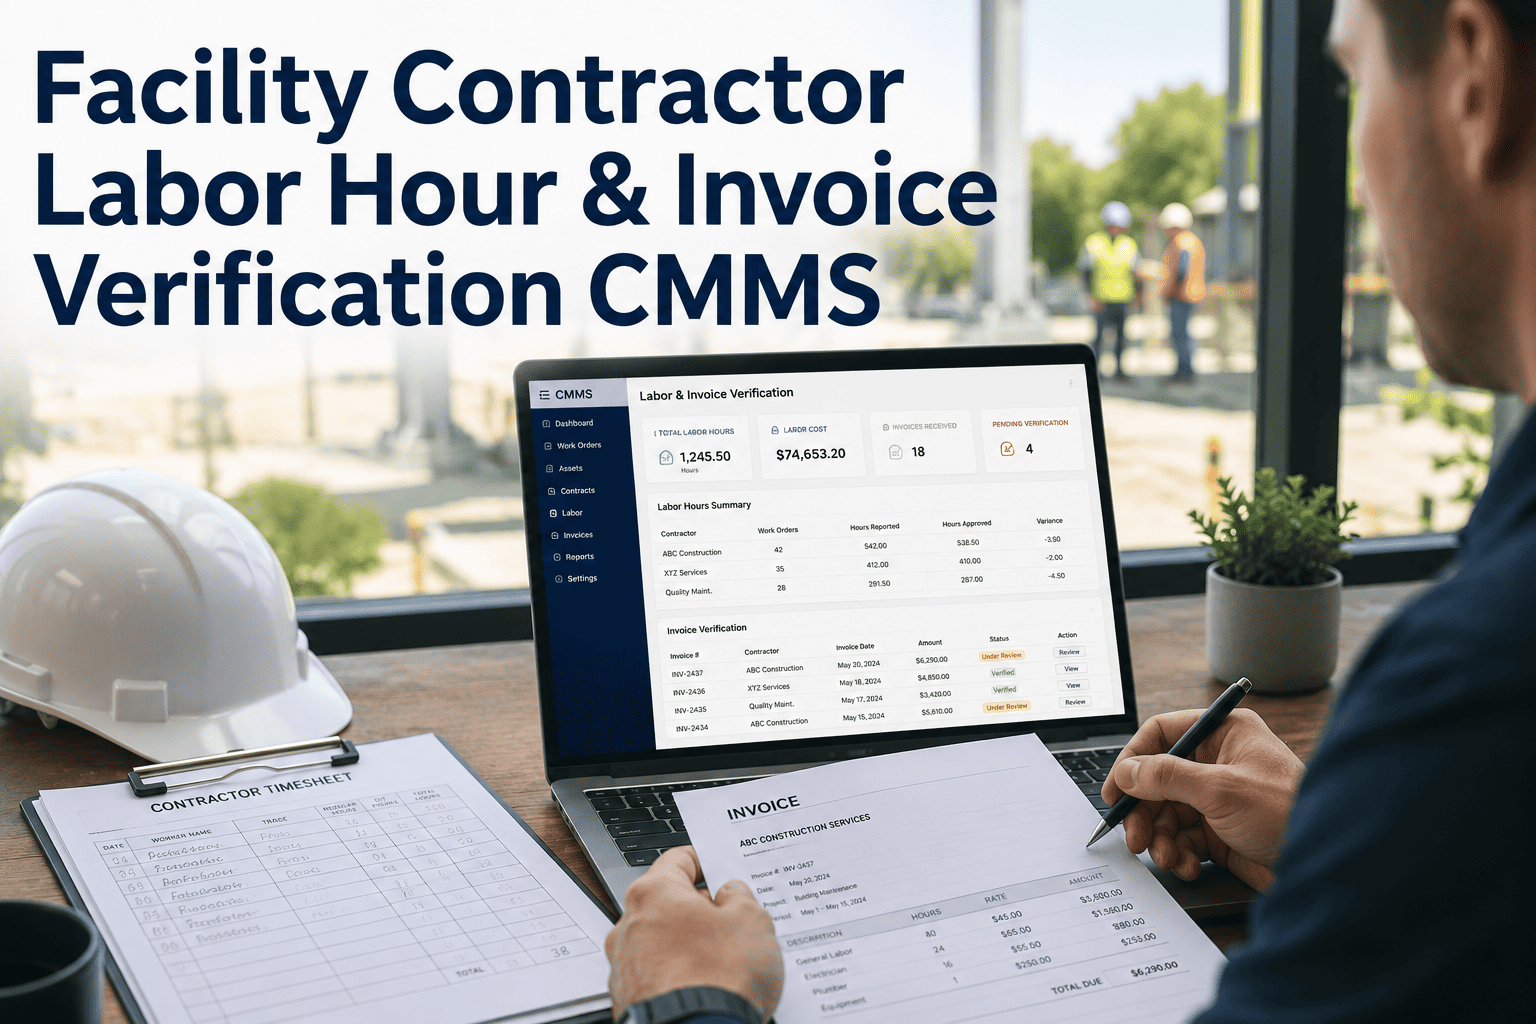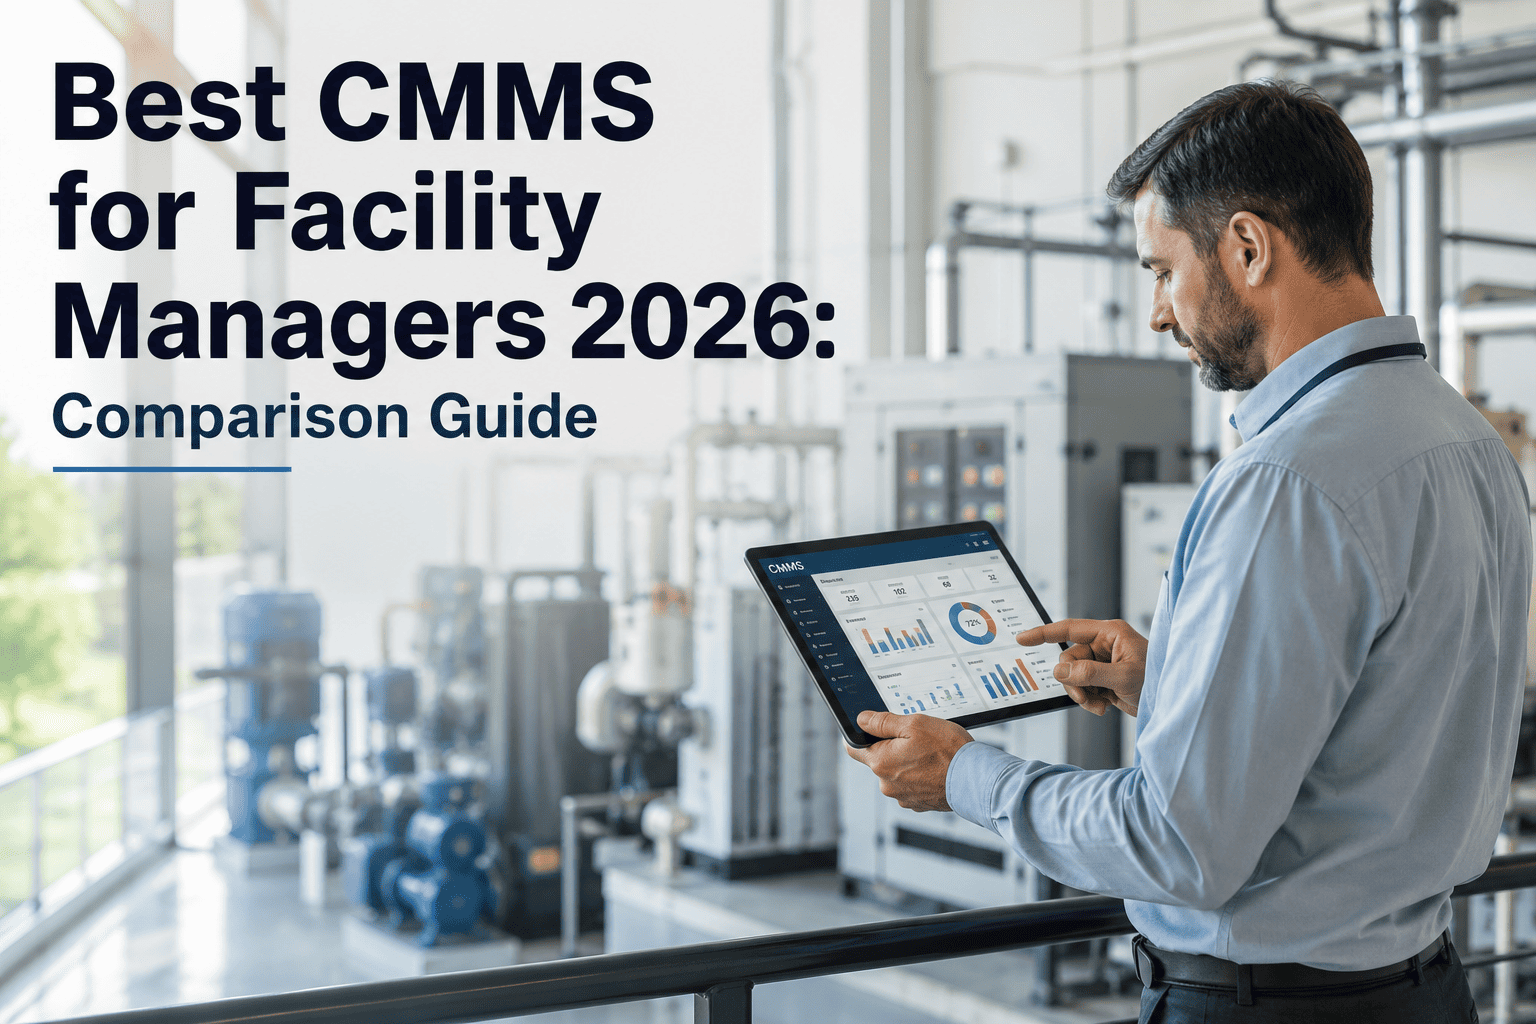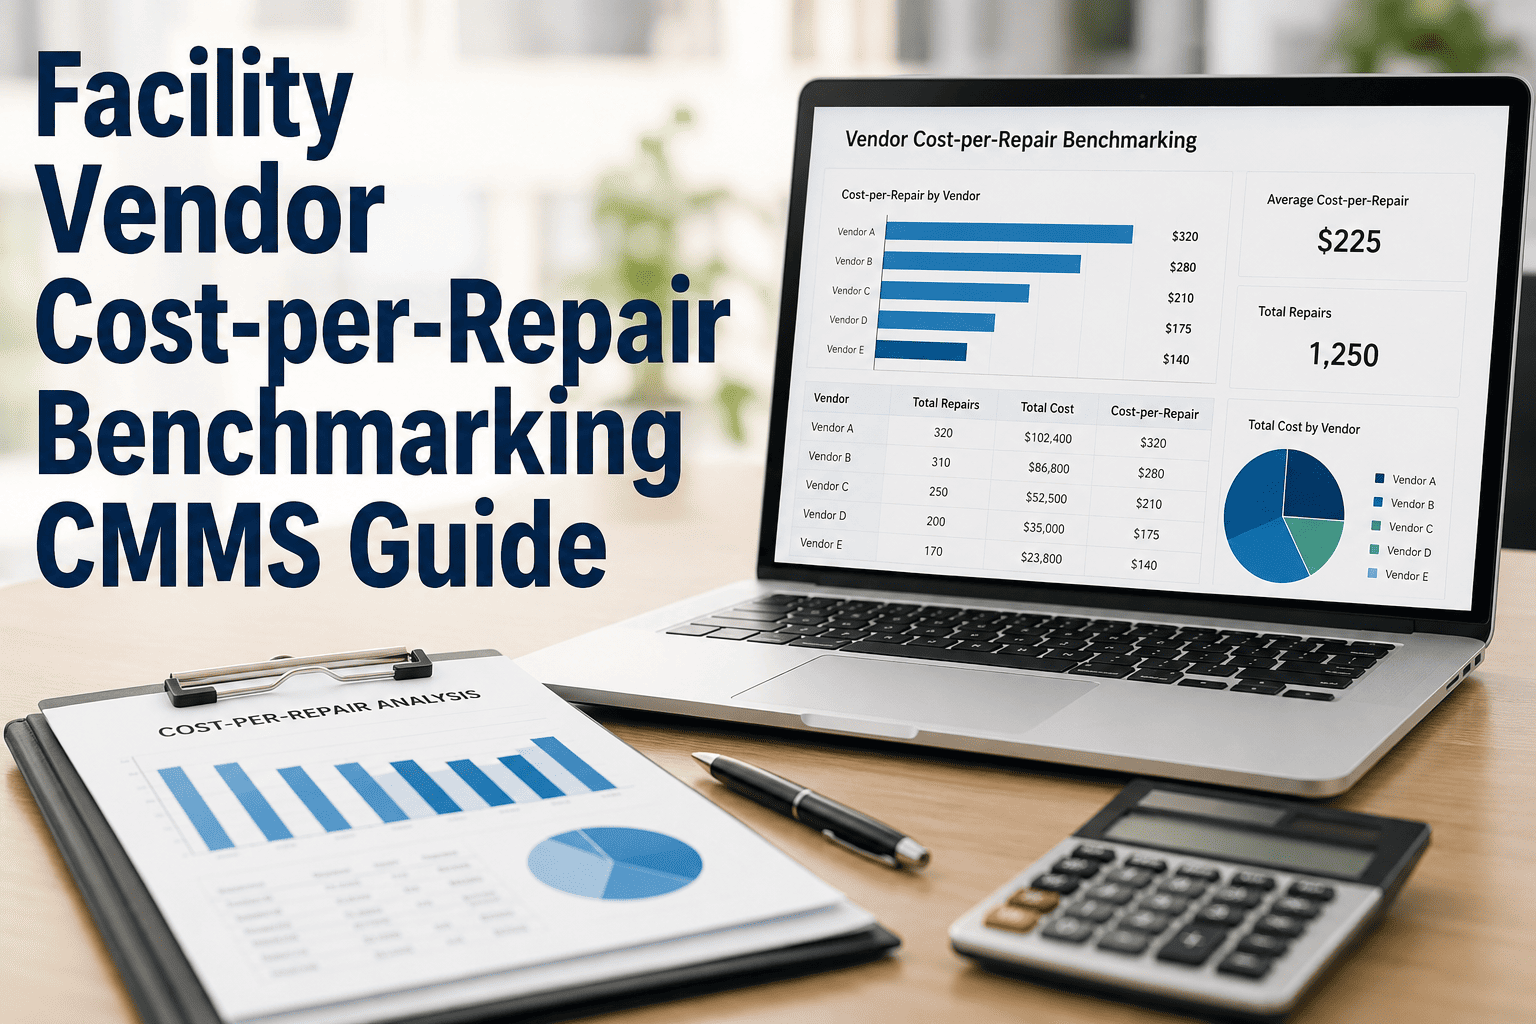
Vendor cost-per-repair is the single most volatile line item in a facility maintenance budget, yet fewer than one in three teams benchmark it systematically. Without tying every invoice line back to a closed work order in your CMMS, you absorb an estimated 8–14% in cost leakage from duplicated charges, inflated labor hours, and parts markups that were never agreed on. This guide walks through invoice verification, cross-vendor cost comparison, and CMMS-based benchmarking so you can defend every dollar of facility spend. Ready to act now? Start Free Trial and connect your vendor list in under an hour.
CMMS Vendor Cost Benchmarking Guide · 2026
Is your facility overpaying vendors by 12% on every repair?
Most facility teams benchmark labor internally but never benchmark external vendor cost-per-repair. The result: silent cost leakage, inconsistent invoice approvals, and no defensible baseline for renegotiation. This guide shows you how to build one — using data already sitting in your CMMS.
The Benchmark Baseline
What a healthy vendor cost-per-repair looks like in 2026
Across mid-sized facilities managing 150–500 assets, the median fully-loaded vendor cost-per-repair runs $312, but the spread between the top and bottom quartile is nearly 2.4×. Knowing where you sit on that curve is the first step to closing the gap.
A 180-asset plant spending $42,000 per year on outsourced facility repairs should expect a fully-loaded cost-per-repair between $285 and $340 if vendors are performing routine corrective and preventive work. If your blended average exceeds $380, you are almost certainly in the bottom quartile — and the gap is rarely about vendor pricing alone. It is usually a process gap: invoices arriving without a linked work order, parts billed at list instead of agreed markup, and labor hours that cannot be reconciled to a dispatch window.
The Cost Leakage Formula
Quantifying what unverified vendor invoices actually cost you
Cost leakage is not a single error — it is the compound effect of four failure modes that occur when invoice approval is disconnected from CMMS work order history.
Annual cost leakage
Leakage = (Vendors × Repairs/Vendor/Year × Avg Invoice $) × Leakage Rate
Where Leakage Rate is the % of invoice dollars that cannot be tied to a verified, closed work order with matching labor hours and parts. Industry benchmark range: 8–14%.
Worked example
12 vendors × 65 repairs × $312 × 11% = $26,889/yr
A 180-asset facility with 12 active vendors, averaging 65 repairs per vendor per year at the median cost, loses roughly $26,900 annually to unverified charges. Benchmarking and invoice verification typically recover 60–70% of that within one renewal cycle.
Orphan invoices
Invoices with no matching closed work order in the CMMS — the single largest leakage source, accounting for ~38% of recoverable spend.
Duplicate charges
The same repair billed across two invoice cycles or split between a service ticket and a PM work order. Affects ~24% of leakage.
Hours inflation
Labor hours billed beyond the CMMS dispatch-to-close window. ~22% of leakage; catchable with timestamp reconciliation.
Parts markup drift
Parts billed above the contracted markup or at list price instead of the negotiated vendor rate. ~16% of leakage.
Cross-Vendor Comparison
Benchmarking repair cost across your vendor pool
Once every invoice is tied to a closed work order, you can normalize cost-per-repair by asset category and compare vendors on a level field. The table below shows a real benchmark structure for a facility managing HVAC, electrical, and plumbing vendors.
| Vendor | Asset Category | Repairs (YTD) | Avg Cost / Repair | On-Time Close % | Leakage Rate | Verdict |
|---|---|---|---|---|---|---|
| Vendor A — HVAC | RTUs, chillers | 48 | $284 | 94% | 6% | Top quartile |
| Vendor B — HVAC | RTUs, AHUs | 52 | $351 | 81% | 13% | Renegotiate |
| Vendor C — Electrical | Panels, lighting | 37 | $268 | 96% | 5% | Top quartile |
| Vendor D — Plumbing | Fixtures, lines | 29 | $398 | 74% | 17% | Replace |
| Vendor E — General | Mixed corrective | 61 | $322 | 88% | 10% | Watch |
The comparison reveals a pattern that pure spend analysis misses: Vendor B is not the most expensive per repair, but their 13% leakage rate and 81% on-time close make them 19% more costly on a fully-loaded basis than Vendor A for the same asset category. That insight only surfaces when invoice dollars, work order timestamps, and closed-ticket rates live in the same CMMS record.
Implementation Timeline
A 90-day path to defensible vendor cost benchmarking
You do not need a procurement transformation to capture most of the savings. A focused 90-day cycle, run from inside your CMMS, typically recovers 60–70% of identified leakage before the next vendor renewal.
Connect and normalize vendor data
Import your active vendor list, map each to an asset category, and backfill the last 12 months of closed work orders. Target: 95% of historical repairs linked to a vendor ID and an asset tag.
Invoice-to-work-order reconciliation
Route every incoming vendor invoice through the CMMS. Auto-flag any invoice line that cannot match to a closed work order within a 5% dollar tolerance. Median facility flags 18–24% of invoices in the first cycle.
Benchmark and rank vendors
Calculate blended cost-per-repair, on-time close rate, and leakage rate per vendor. Identify the bottom-quartile vendor in each asset category and prepare a renegotiation or replacement brief.
Renegotiate and monitor
Armed with benchmarked data, renegotiate markup terms with at-risk vendors or trigger an RFP for replacement. Set a monthly leakage dashboard so variance is caught in weeks, not quarters.
Stop approving vendor invoices you cannot benchmark
OxMaint ties every invoice line to a closed CMMS work order, flags leakage in real time, and ranks your vendors by true cost-per-repair. Most facilities see the first recovered dollar within 30 days.
Frequently Asked Questions
Vendor cost-per-repair benchmarking, answered
What exactly counts as "cost-per-repair" in a CMMS?
Cost-per-repair is the fully-loaded dollar amount tied to a single closed corrective work order: vendor labor, travel and dispatch fees, parts at agreed markup, and any ancillary charges. It excludes preventive maintenance scheduled work and internal labor unless explicitly allocated. The CMMS calculates it by summing all invoice lines linked to that work order ID and dividing by one — then averaging across all closed repairs for a given vendor and asset category over a rolling 12-month window.
How do I verify a vendor invoice against a work order?
Match the invoice to the work order on five fields: work order ID, asset tag, vendor ID, dispatch timestamp, and close timestamp. Then reconcile line items: labor hours billed should not exceed the gap between dispatch and close; parts billed should match the parts-used log on the work order. Any variance beyond a 5% tolerance gets flagged for review. You can automate this entirely in OxMaint — Book a Demo to see the reconciliation flow.
What leakage rate should trigger vendor renegotiation?
Any vendor with a sustained leakage rate above 10% over two consecutive billing cycles warrants a formal review. Above 15%, you should prepare a replacement RFP. The industry median is 8%, and top-quartile facilities hold their vendors under 6%. Leakage rate is a stronger signal than raw cost-per-repair because it isolates process and billing integrity from legitimate price differences.
Can I benchmark vendors across different asset categories?
Only with normalization. A $400 plumbing repair and a $400 HVAC repair are not directly comparable because the underlying labor rates, parts costs, and complexity differ. Benchmark within an asset category first — HVAC vendors against HVAC vendors — then use a weighted blended cost-per-repair if you need a single facility-wide vendor scorecard. The CMMS handles the weighting automatically when asset categories are tagged correctly on every work order.
How long until I see measurable savings?
Most facilities recover 60–70% of identified leakage within the first 90 days of implementing invoice-to-work-order reconciliation, because the largest source — orphan invoices with no matching work order — is caught immediately at approval. Full vendor renegotiation savings typically land at the next contract renewal cycle, 3–6 months out. You can Start Free Trial and connect your vendor list in under an hour to begin the first reconciliation cycle this week.
Build your defensible vendor cost baseline this quarter
Join the facility teams using OxMaint to verify every invoice, benchmark every vendor, and recover the 8–14% that silently leaks from their repair budgets every year.
Free 14-day trial · No credit card