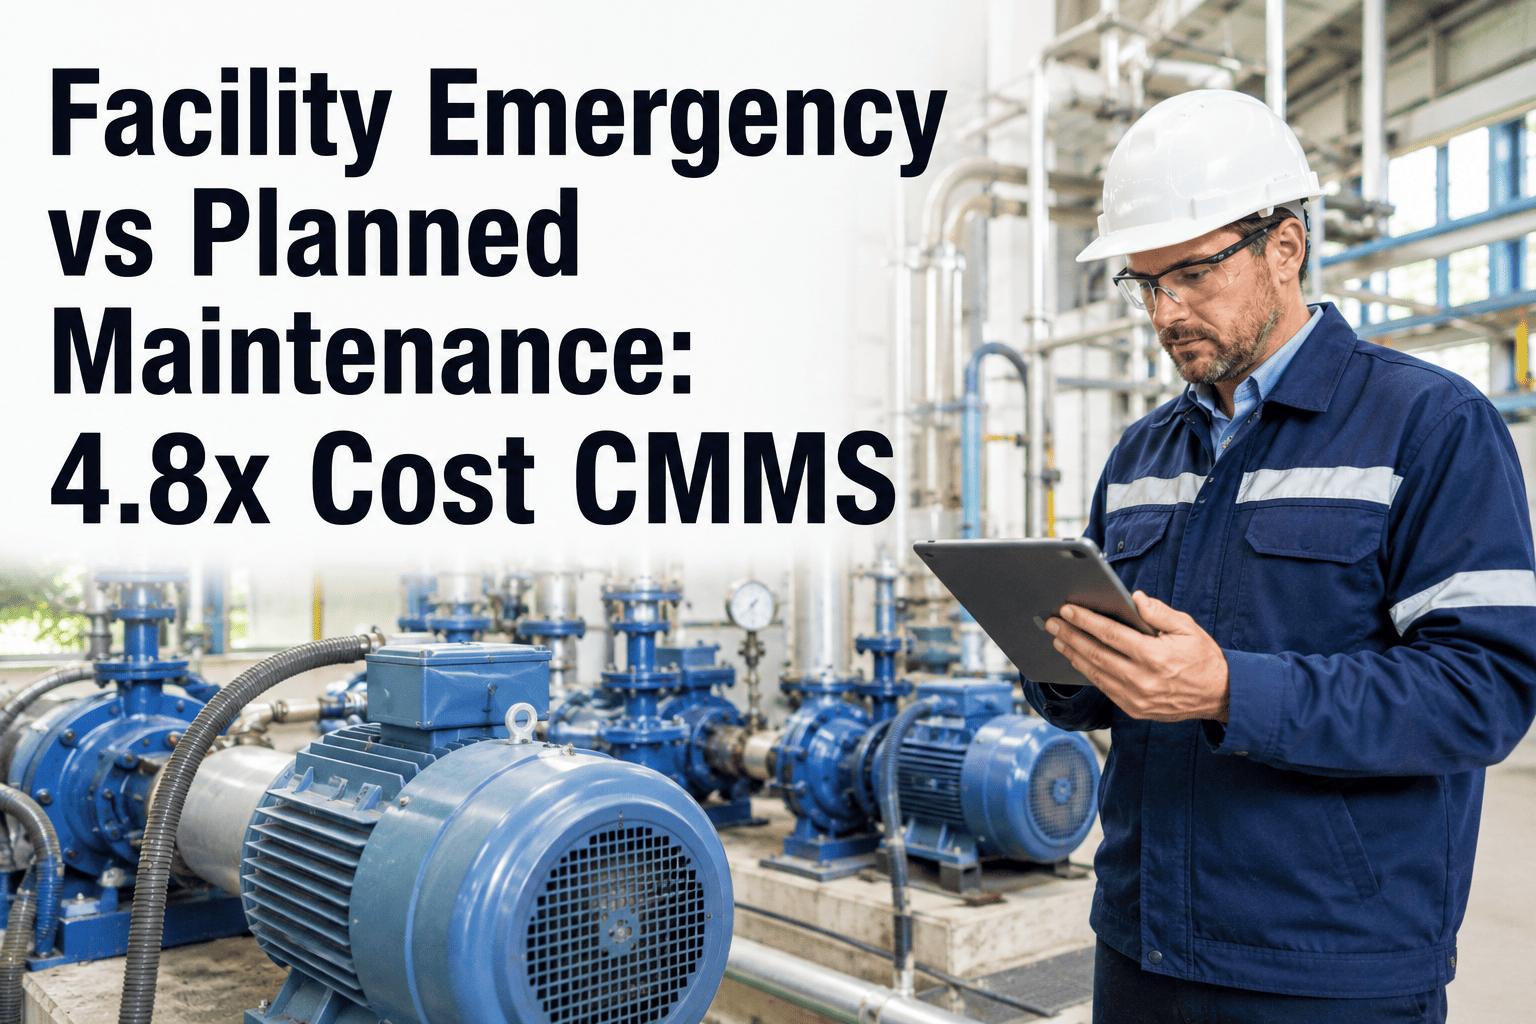
When a chiller fails on a Friday afternoon, the invoice that follows almost never matches what a facility manager expects going in. After-hours labor rates, rushed freight on a replacement part, and every hour the space sits unusable stack up fast, and facility teams that track this closely now put the average emergency repair at roughly 4.8 times the cost of the identical job done as planned work. That gap does not show up as one dramatic line item, it shows up quietly, across dozens of work orders a year, until reactive spend has quietly become the largest number in the maintenance budget. The teams that reverse this are not the ones working harder during emergencies, they are the ones who shrink how often an emergency happens in the first place. See what that shift looks like on your own asset list with OxMaint.
Emergency vs Planned Maintenance: What the 4.8x Gap Actually Costs You
A side-by-side look at why reactive repairs cost so much more than planned work, what the ratio between them says about your budget, and how a connected CMMS closes the gap.
Where the Extra 4.8x Actually Comes From
None of that extra cost shows up as a single suspicious charge. It is spread across four places that a planned work order simply never touches, which is exactly why the gap is so easy to underestimate until someone adds it up.
Emergency Repair vs Planned Maintenance, Side by Side
| Cost Factor | Emergency Repair | Planned Maintenance |
|---|---|---|
| Labor rate | Overtime, weekend, or after-hours premium pricing | Standard scheduled rate during regular working hours |
| Parts sourcing | Rush freight and short-notice supplier markup | Ordered ahead through normal inventory reorder points |
| Downtime impact | Unplanned outage during active operating hours | Scheduled during a planned maintenance window |
| Documentation | Often skipped or reconstructed after the fact | Captured automatically at the point of work |
| Budget predictability | Variable, absorbs contingency reserves | Fixed, scheduled, and forecastable in advance |
| Average cost per incident | Roughly 4.8 times the equivalent planned job | Baseline cost, the 1x reference point |
Every Emergency Work Order Is a Preventable Line Item
OxMaint schedules preventive work automatically, flags parts before they run out, and keeps a full history on every asset, so fewer jobs ever reach emergency status in the first place.
The Ratio That Actually Sets Your Budget
The single number that predicts your total maintenance cost better than any other is the split between reactive and planned work. Most facilities sit closer to the reactive side than they realize.
Shifting even 10 points from reactive to planned typically cuts total program cost by 5 to 8 percent, without adding a single extra technician.
How Facility Teams Shift the Ratio in 4 Stages
Frequently Asked Questions
Stop Paying the 4.8x Emergency Premium
OxMaint moves your assets, PM schedules, work orders, and spare parts into one connected system, so fewer jobs ever reach emergency status and your reactive ratio keeps moving in the right direction.