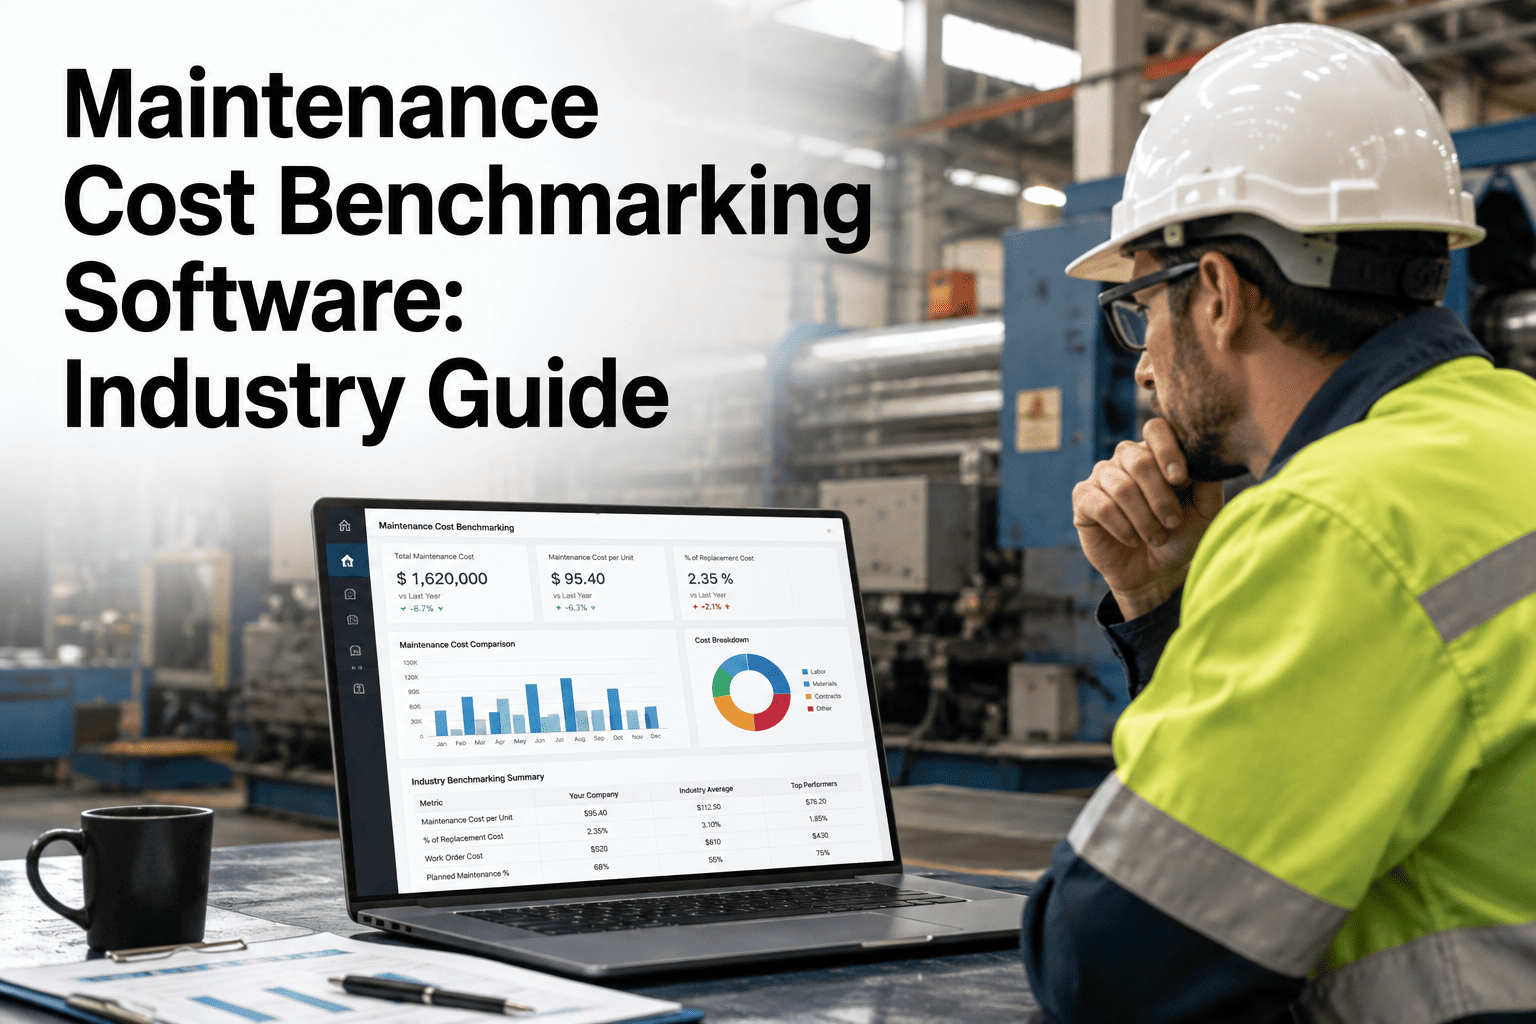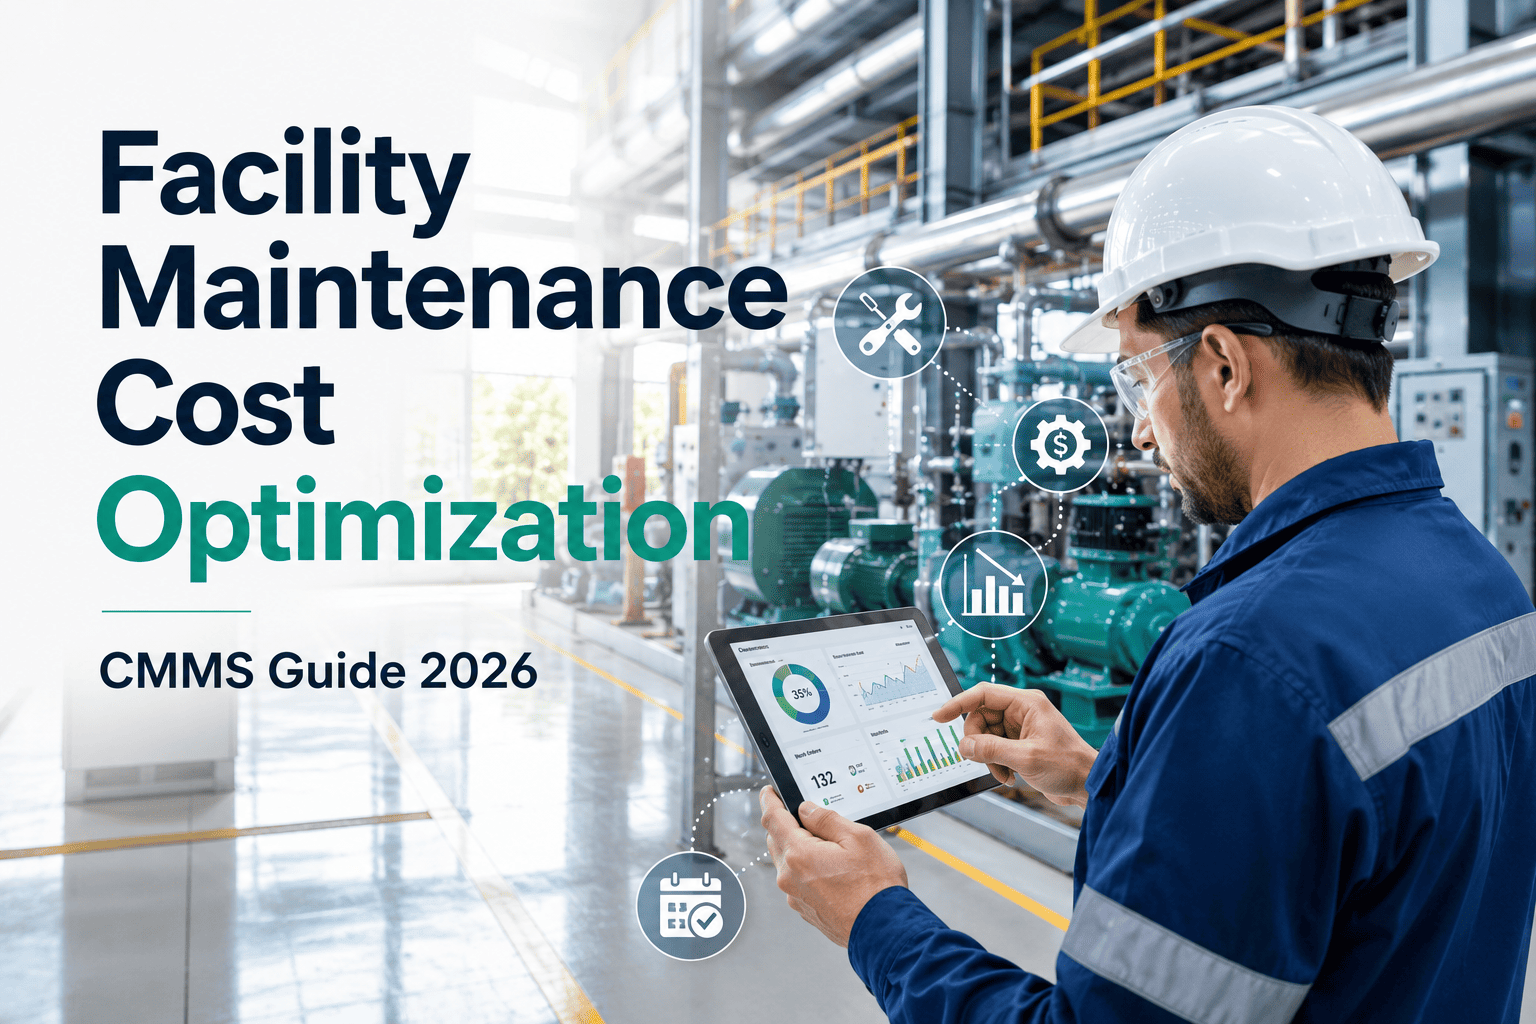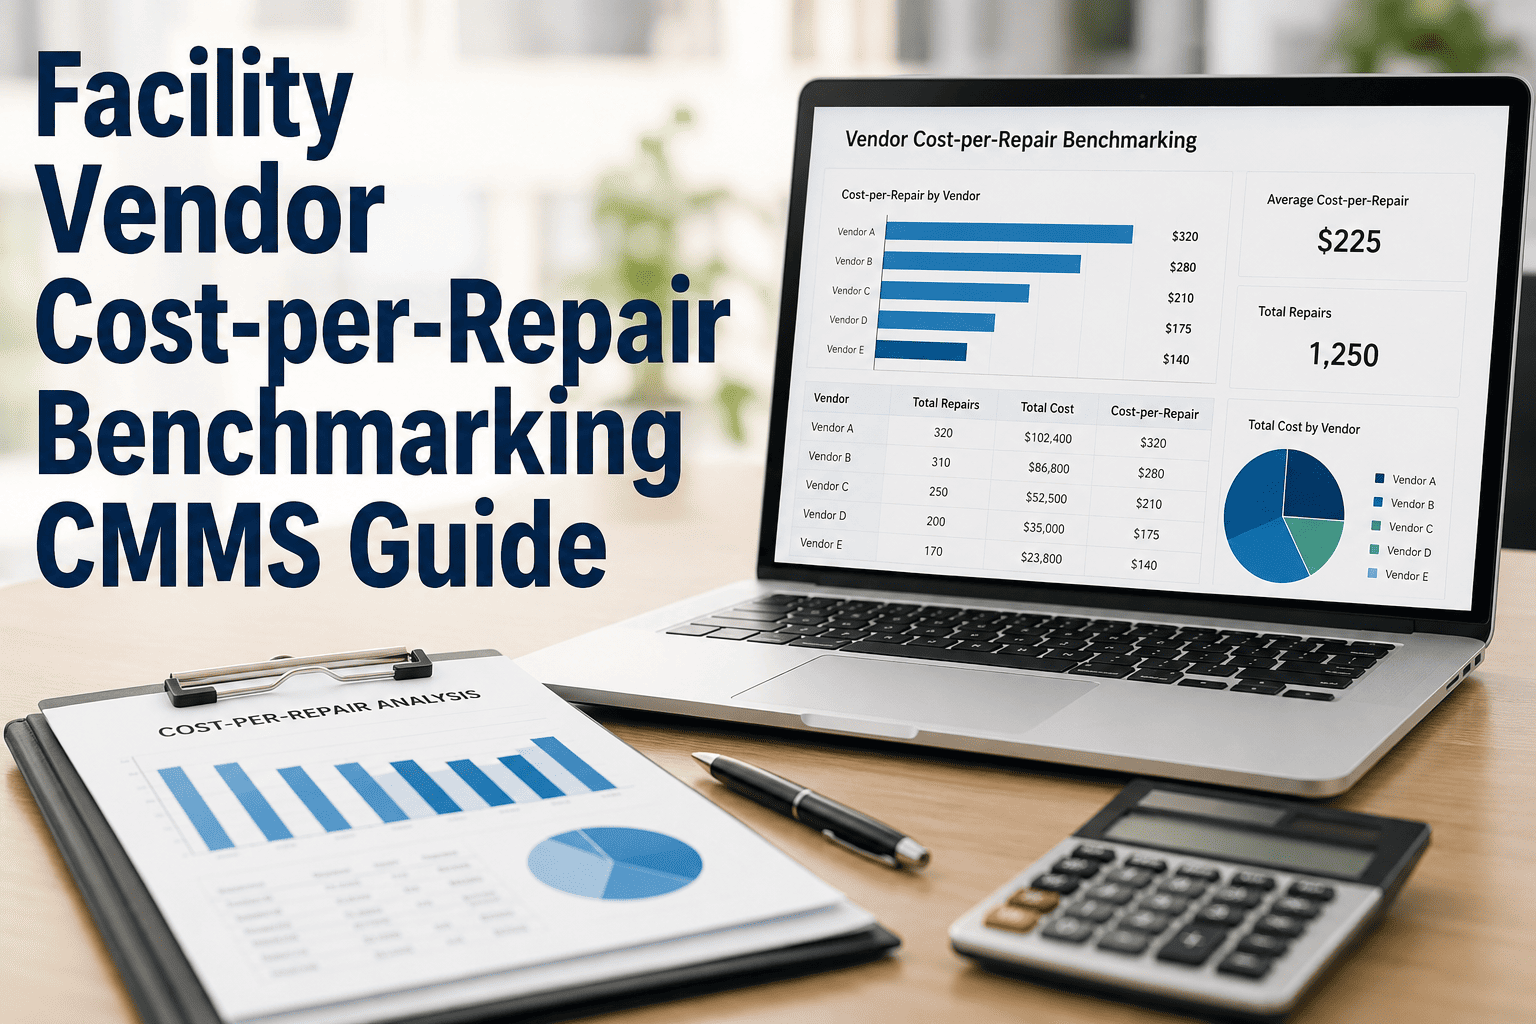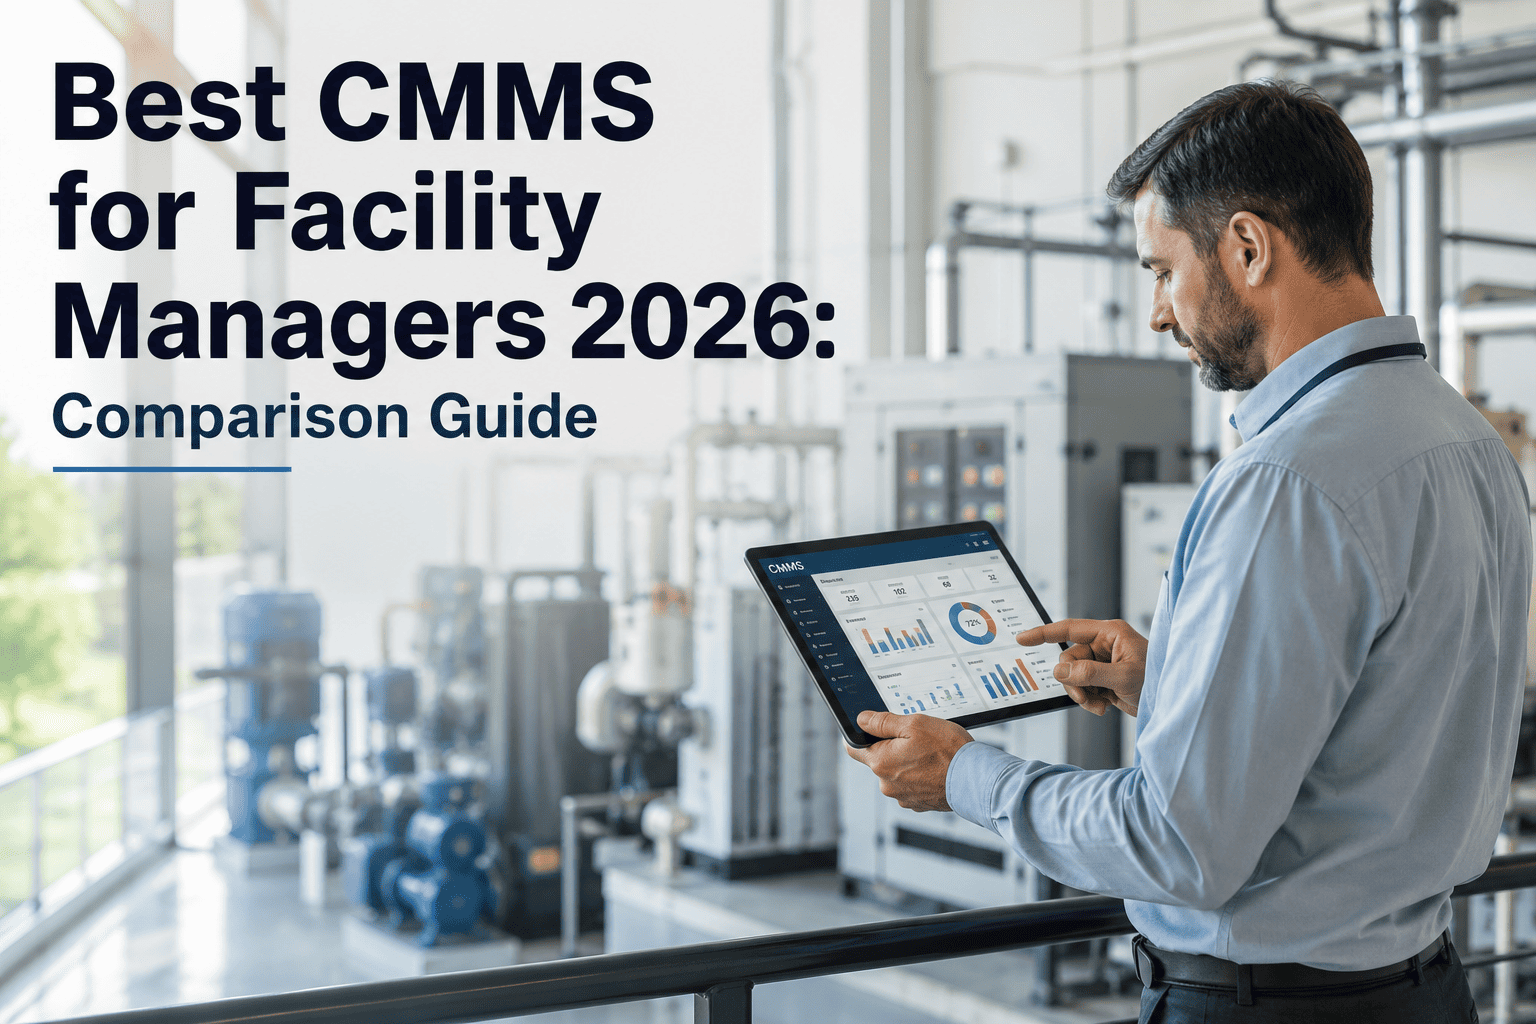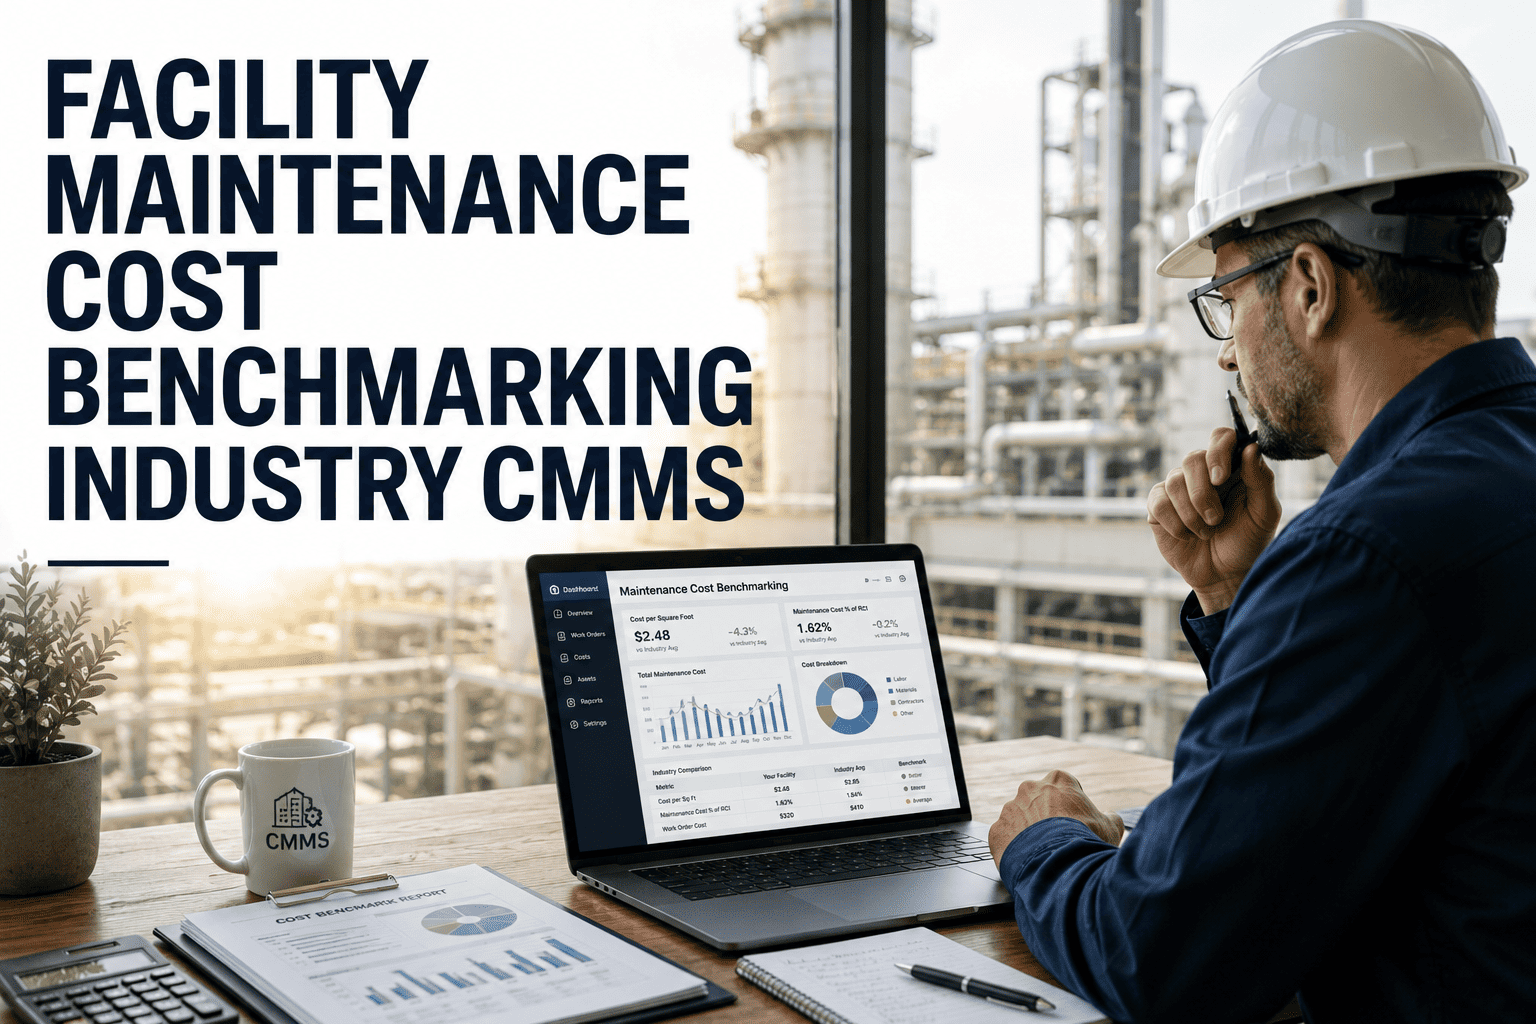
Facility maintenance cost benchmarking is the process of comparing your portfolio's maintenance spend, labor efficiency, and asset downtime against industry standards and peer facilities to uncover hidden waste and prioritize improvements. For multi-site operations, a reliable facility cost per sqft metric typically ranges from $1.40 to $3.50 depending on asset age and industry, but most plant managers lack the data infrastructure to measure it accurately. A modern industry benchmark CMMS solves this by standardizing work order data, automating cost roll-ups by asset class, and providing live facility peer comparison dashboards. This facility benchmarking guide 2026 breaks down the exact cost benchmarks, formulas, and CMMS facility comparison strategies you need to close the performance gap. Ready to turn raw maintenance data into a competitive advantage? Start Free Trial and see your live baseline within minutes.
Stop Guessing. Start Benchmarking Your Facility Maintenance Costs.
Most maintenance teams operate blind—spending 15–30% more than industry peers on reactive repairs without even knowing it. A CMMS facility benchmark gives you the exact cost per square foot, labor ratio, and downtime metrics needed to close the gap and justify budget requests with hard data.
Facility Cost Per SqFt: How Do You Compare?
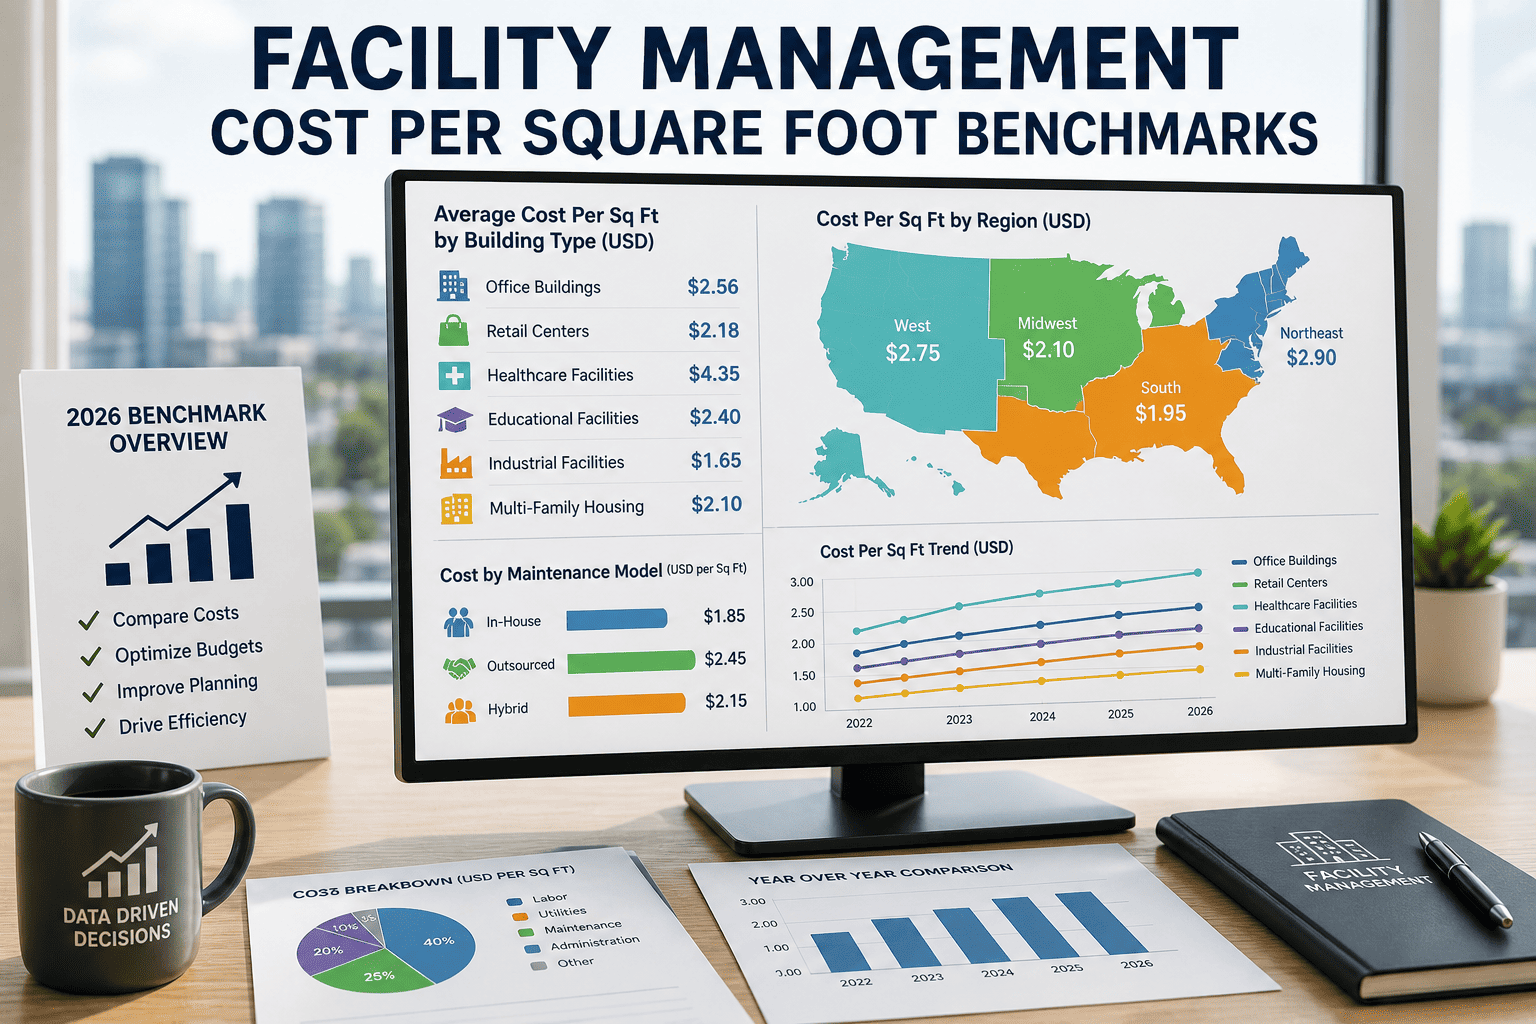
Maintenance cost per square foot is the foundational facility cost standard for real estate and plant management, but the benchmark shifts dramatically based on your industry, asset density, and operational hours.
| Facility Type | Cost / SqFt (Low) | Cost / SqFt (High) | Reactive Work Order % | Industry Peer Benchmark |
|---|---|---|---|---|
| Commercial Office | $1.40 | $2.20 | 45% | Below $2.00 |
| Healthcare / Hospital | $2.80 | $4.50 | 35% | Below $3.50 |
| Manufacturing / Industrial | $2.00 | $4.00 | 40% | Below $3.20 |
| Education / Campus | $1.20 | $2.10 | 50% | Below $1.80 |
| Data Center / High-Tech | $3.50 | $6.00+ | 20% | Below $5.00 |
Worked Example: A 180-asset manufacturing plant operating at 120,000 sqft spending $42K/month on maintenance is running at $4.20/sqft annually—31% above the manufacturing facility industry comparison benchmark. By shifting 60% of reactive work orders to preventive maintenance via an industry benchmark CMMS, that same plant typically reduces its facility cost standard back below $3.00/sqft within 6 months.
The Core Facility Cost Benchmarking Formulas
To execute a reliable facility peer comparison, you must normalize your data using standardized reliability formulas. Here are the three calculations every maintenance manager must track monthly.
Maintenance Cost Per Square Foot
Measures the pure financial footprint of your maintenance operation. Use this for high-level facility industry comparison and annual budget justification.
Preventive vs Reactive Ratio
The gold standard for facility benchmarking guide 2026 compliance. World-class teams maintain a 70/30 PM-to-reactive split; teams operating below 50% PM are overspending on emergency labor.
Asset Replacement Value (RAV) Ratio
An ISO 55000-aligned facility cost standard. A CMMS facility benchmark target of 2–3% indicates healthy spend; above 5% suggests your assets are failing and require capital replacement.
How OxMaint Powers CMMS Facility Benchmarking
Spreadsheets and legacy EAM systems hide your benchmarking data in silos. OxMaint’s AI-powered CMMS standardizes your work order data and automatically generates facility peer comparison analytics out of the box.
Live Cost Per SqFt Dashboards
Auto-calculates facility cost per sqft across your entire portfolio by rolling up labor, parts, and contractor invoices—no manual spreadsheet exports required. Cut reporting time by 90%.
Predictive Downtime Alerts
AI-driven predictive maintenance flags asset failures 7–14 days before they happen, reducing unplanned downtime by 30–50% and driving your reactive work order ratio below 20%.
Spare Parts Inventory Optimization
Tracks spare-parts costs against asset RAV to prevent overstocking. Facilities typically free up 15–25% of tied-up capital while maintaining 95% parts availability for critical assets.
Multi-Site Facility Peer Comparison
Compare maintenance cost standard across different buildings or plants in real-time. Identify bottom-quartile performers and replicate top-quartile PM schedules instantly.
See How Your Facility Benchmarks Against the Industry
Book a 30-minute demo and our reliability engineers will map your current maintenance costs against live industry data inside OxMaint.
A 4-Month Timeline to CMMS Facility Benchmarking
Transitioning from reactive maintenance to a fully benchmarked, data-driven facility does not happen overnight. Follow this proven CMMS benchmarking facility implementation roadmap.
Data Centralization & Asset Registry
Import all assets, legacy work orders, and spare parts into OxMaint. Eliminate paper and spreadsheet silos. Establish a clean baseline for your facility cost standard.
Standardize PM Schedules
Build preventive maintenance triggers based on meter readings and time. Shift 40% of reactive workload to scheduled PMs to stabilize labor costs and reduce emergency overtime.
Activate Cost Tracking
Link labor rates, parts pricing, and contractor invoices directly to work orders. Generate your first accurate facility cost per sqft report and compare it against the industry benchmark CMMS data.
Facility Peer Comparison & AI Predictions
Enable OxMaint’s predictive analytics to forecast asset failures. Use the facility peer comparison dashboard to identify remaining inefficiencies and optimize your capital replacement plan.
The ROI of Benchmarking with a CMMS
When you standardize facility cost benchmarking through an AI-powered CMMS, the financial impact is measurable within the first fiscal quarter.
Facility Maintenance Benchmarking FAQs
What is a good facility maintenance cost per square foot?
A standard commercial office facility should target a maintenance cost of $1.40 to $2.20 per square foot annually. Industrial manufacturing plants typically range from $2.00 to $4.00 per square foot. If your costs exceed the high end of your industry benchmark, it indicates an over-reliance on reactive maintenance and aging assets.
How does a CMMS help with facility peer comparison?
A CMMS standardizes how work orders, labor hours, and parts costs are recorded across all your facilities. This allows you to generate apples-to-apples facility peer comparison dashboards instantly, highlighting which sites are overspending and which PM strategies are working best so you can replicate them.
How do I calculate the Replacement Asset Value (RAV) ratio for benchmarking?
Calculate the RAV ratio by dividing your total annual maintenance cost by the total Replacement Asset Value of your facility, then multiply by 100. An ISO 55000-aligned facility cost standard targets 2–3%. If your RAV ratio exceeds 5%, you are likely overspending on repairing failing equipment and should consider capital replacement. You can track this automatically by setting up your asset registry in OxMaint—book a demo to see it in action.
What is the ideal preventive to reactive maintenance ratio?
World-class maintenance teams maintain a 70% preventive to 30% reactive work order ratio. If your facility is operating below 50% preventive maintenance, you are incurring unnecessary emergency labor costs and prolonged downtime. A CMMS facility benchmark dashboard will immediately flag this imbalance.
How long does it take to see ROI from a facility benchmarking CMMS?
Most facilities see a measurable return on investment within 3 months of implementing a CMMS for benchmarking. By eliminating paper work orders, optimizing spare parts inventory, and shifting to predictive maintenance, teams typically cut annual maintenance spend by 18% and reduce unplanned downtime by 30–50%.
Ready to Beat Your Facility Maintenance Benchmarks?
Join the maintenance leaders using OxMaint to cut costs, predict failures, and prove their ROI with hard data. See how your facility stacks up against the industry today.
Free 14-day trial · No credit card