Between 30–50% of MRO inventory in the average facility storeroom has not moved in 24 months. On the same shelves, critical parts run to zero without warning because no system connected the PM schedule — which predicted the demand — to the inventory level, which would have shown the stockout coming. Traditional spare parts planning treats demand as historical: last year's consumption rate, plus a gut-feel safety stock, equals this year's reorder point. AI-driven demand forecasting treats it as predictive: asset condition scores, PM calendars, work order consumption history, and failure pattern analysis generate a continuous, recalculated probability of needing each part before the demand event happens. Bain's 2024 MRO benchmark found that operations using AI risk-segmented stock policies hold 23% less inventory while achieving near-perfect service levels compared to organisations using traditional par-level or fixed reorder-point systems. Book a demo to see OxMaint's Predictive Maintenance AI for spare parts demand forecasting — or start free today.
Article · Predictive Maintenance AI · Inventory & Spares
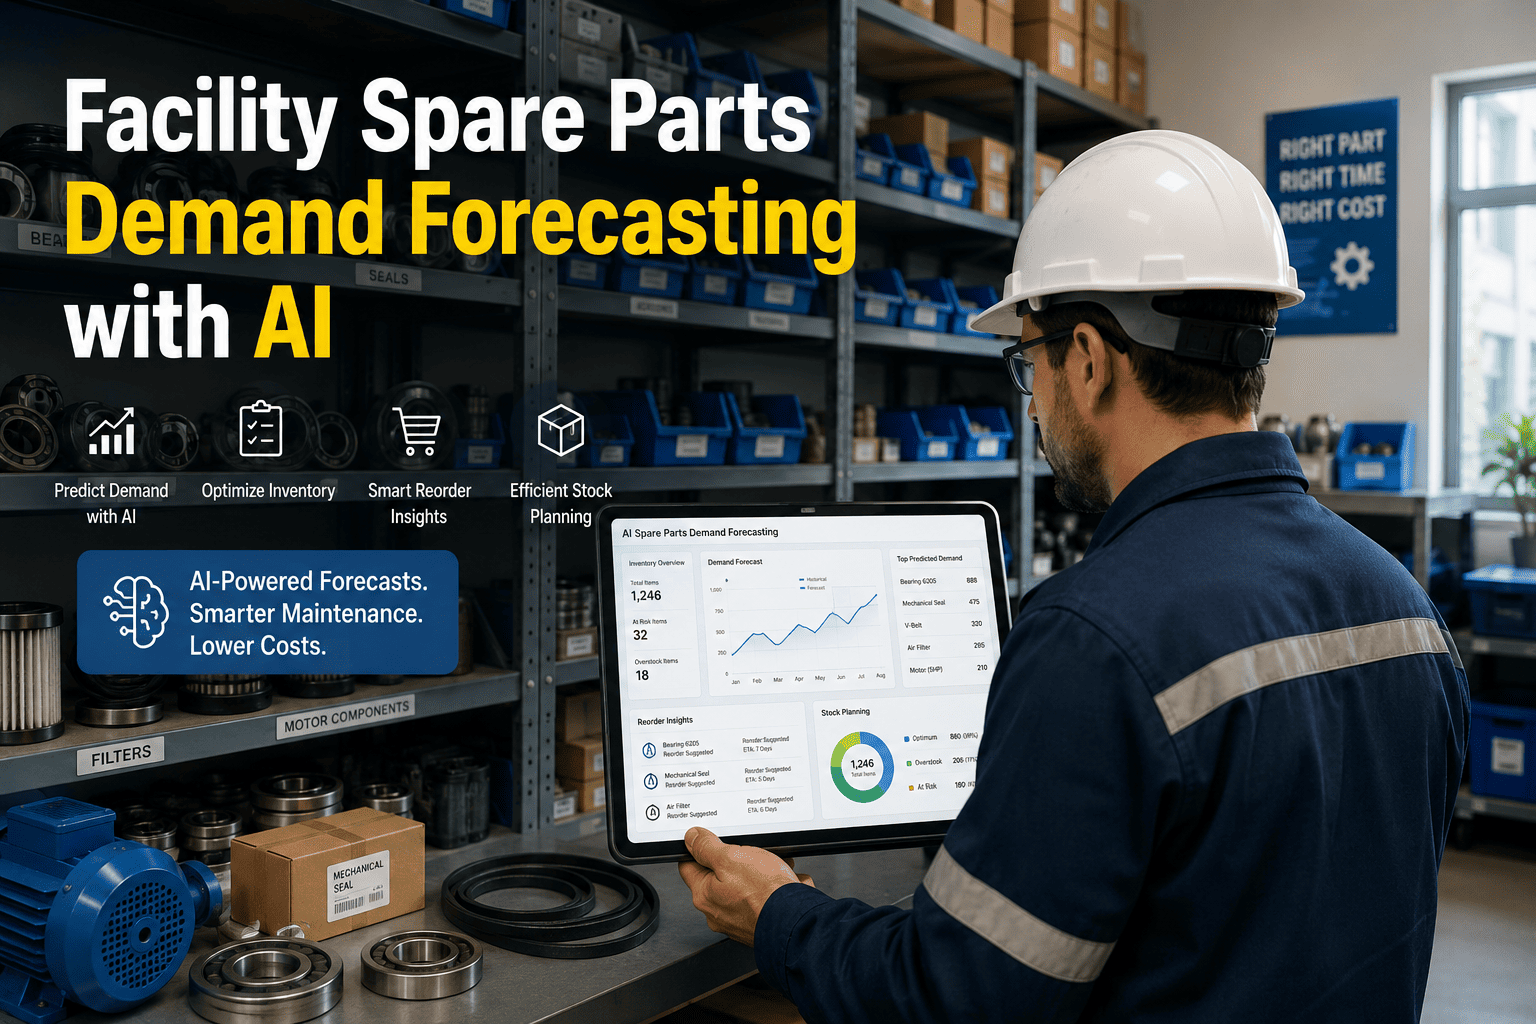
Facility Spare Parts Demand Forecasting with AI
How AI connects asset history, failure trends, PM schedules, and condition data to predict which parts you will need — before the work order that requires them is raised — so your storeroom holds less excess and runs out of nothing critical.
25–35%
Inventory carrying cost reduction in Year 1 — AI-driven forecasting vs manual planning
23%
Less inventory held with AI risk-segmented policies — same service level (Bain 2024)
30–50%
Of MRO parts not moved in 24 months — capital tied up in parts that prevent the critical ones
The 4 Data Sources That Make AI Forecasting Better Than Manual Planning
Manual demand forecasting uses one data source: last year's consumption. AI demand forecasting uses four simultaneously — and updates continuously as each data source changes. The result is a reorder point that reflects what is actually about to happen in your facility, not what happened 18 months ago.
01
Asset Condition Scores
An asset with a declining condition score is approaching a corrective repair. The parts required for the most probable failure mode on that asset — drawn from its repair history — have their demand probability elevated automatically. No one needs to flag the asset as "at risk." The condition trend does it.
Example: HVAC chiller condition score drops from 82 to 71 in 90 days → bearing and seal demand probability elevated → safety stock for those parts adjusted before the failure request is raised
02
PM Schedule Lookahead
Every PM work order on the calendar has a parts list. AI reads the PM schedule 4–12 weeks ahead and aggregates the parts that will be consumed across all scheduled jobs in that window. Parts that will be needed at high volume in 6 weeks are reserved or reordered now — before the PM window competes with reactive demand for the same stock.
Example: 14 air handler PMs scheduled in weeks 6–8 → 14 sets of filters, 7 belt kits → staged procurement triggered 6 weeks before execution window
03
Work Order Consumption History
Every part drawn from inventory against a work order is a data point. Over 12–18 months, consumption patterns emerge per part per asset class — seasonal variation, post-PM-cycle demand spikes, parts that always get replaced in pairs even though the work order only lists one. AI detects these patterns and incorporates them into the forecast. Static historical average does not.
Example: Pump seals consumed 3× faster in Q1 (freeze-thaw stress period) → seasonal safety stock adjustment applied automatically each November
04
Failure Pattern Analysis
Mean time between failures per asset, failure mode clustering by asset age and operating environment, and correlation between specific observations in work order notes and subsequent part replacement — all feed the failure probability model. A motor that has had bearing noise noted in two consecutive work orders is statistically within a predictable window of bearing replacement. The bearing demand forecast reflects this before the work order exists.
Example: MTBF for valve actuators in building B is 14 months → actuators installed 11–13 months ago flagged → stock levels checked and elevated proactively
Manual Planning vs AI Forecasting — The Operational Difference
| Planning Dimension |
Manual / Static Planning |
OxMaint AI Forecasting |
| Demand signal used |
Last 12 months average consumption — does not account for asset age, PM timing, or condition |
4 simultaneous signals: condition score, PM lookahead, consumption history, failure pattern — continuously updated |
| Reorder point updates |
Set once per year during storeroom review — stays static until someone manually adjusts it |
Recalculated continuously as asset condition changes, PM schedule shifts, or supplier lead times update |
| Seasonal demand variation |
Not incorporated — summer HVAC demand and winter heating demand treated the same |
Seasonal consumption patterns learned from work order history — stock levels automatically elevated before peak demand periods |
| Slow-moving stock identification |
Manual stockroom audit — typically annual, identifies problem after capital is already tied up |
Continuous zero-movement flag — parts with no consumption and no forecast demand flagged for review in real time |
| Multi-site inventory visibility |
Each facility manages its own storeroom independently — no cross-facility visibility |
Portfolio view shows parts available at other facilities — transfers prevent emergency orders for stock that already exists in the portfolio |
| Emergency purchase rate |
10–15%+ of purchases are emergency orders at 2–5× planned cost |
20–40% reduction in emergency purchases when AI demand sensing drives replenishment |
PREDICTIVE MAINTENANCE AI · OXMAINT · INVENTORY
Your Storeroom Holds Too Much of the Wrong Parts and Not Enough of the Right Ones. AI Fixes Both.
OxMaint Predictive Maintenance AI forecasts spare parts demand from asset condition scores, PM schedules, consumption history, and failure patterns — so your storeroom holds 23% less inventory and runs out of nothing critical.
The Criticality-Velocity Matrix — Stocking Strategy by Part Type
Not all parts need AI forecasting equally. The Criticality-Velocity Matrix aligns stock strategy with the consequence of unavailability and the frequency of demand — ensuring AI effort is concentrated where it drives the most value.
High Criticality
AI-Managed Safety Stock
Dynamic reorder point updated continuously from condition and PM data. Never runs below minimum. Emergency order auto-triggered before stockout.
Pump seals · Motor bearings · HVAC compressor capacitors
Insurance Stock with Failure Prediction
Guaranteed minimum stock held regardless of consumption. AI failure prediction triggers replenishment before the asset enters failure window.
Control transformers · Boiler pressure vessels · Fire pump components
Low Criticality
Standard Replenishment
Fixed reorder point with lean safety stock. Demand is predictable; criticality is low. Standard min/max management — no AI required.
Filters · Belts · Lubricants · Lamp replacements
Zero Stock / JIT Order
Not stocked. Ordered when needed. Low criticality and infrequent demand means carrying cost exceeds value. AI flags these for removal from storeroom.
Decorative fittings · Non-critical sensors · Legacy parts for decommissioned assets
Expert Review
"The reason AI demand forecasting produces better outcomes than manual planning is not because it is more sophisticated — it is because it updates. A static reorder point set in January does not know that the chiller it is stocking parts for has been running harder than normal since June and is now showing early bearing wear. A static reorder point set in January does not know that you have 14 AHU preventive maintenances scheduled in October that will consume more filters in that month than the previous 8 months combined. AI does not have magical knowledge that a human planner does not have access to. It just updates continuously on the data that the planner would need to review manually — and it does it for every part in the storeroom simultaneously, not just the ones the planner has time to review this week. The 23% inventory reduction that Bain's research documents is not from eliminating useful stock. It is from eliminating the safety stock that was added to compensate for not knowing what was coming. When you know what is coming, you need less buffer."
Marcus Webb, CMRP, CRL
Certified Maintenance and Reliability Professional (SMRP) · Certified Reliability Leader · 19 years industrial maintenance operations and inventory management · Specialist in predictive maintenance programme design and MRO inventory optimisation
Frequently Asked Questions
How does AI demand forecasting differ from traditional min/max stocking?
Traditional min/max sets a fixed reorder point based on historical average consumption and holds a static safety stock buffer. It does not update when the asset the part serves is showing early wear, does not know that a batch of PMs will consume 14 of that part next month, and does not account for seasonal demand variation unless someone manually adjusts the parameters annually.
AI demand forecasting updates the reorder point continuously using four live data signals: asset condition scores, PM schedule lookahead, work order consumption history, and failure pattern analysis. The result is a reorder point that reflects current and anticipated demand rather than past average demand — which is where the 23% inventory reduction with maintained service levels comes from.
Book a demo to see OxMaint's AI reorder point calculation in action.
How much historical data does AI need before it improves forecasting accuracy?
OxMaint's AI demand forecasting begins generating improved reorder points from 3–6 months of work order data — enough history to identify consumption patterns and begin correlating asset condition signals with part consumption. Full seasonal pattern recognition requires 12–18 months. The accuracy gain compounds with data volume: a facility that has been running OxMaint for 24 months will have measurably better forecast accuracy than one at 6 months, particularly for parts with intermittent or lumpy demand patterns. For new deployments, the AI starts from static min/max parameters and transitions to dynamic forecasting as the work order history accumulates — the system improves progressively rather than requiring a data warehouse before generating any value.
Can AI demand forecasting work across multiple facility sites sharing inventory?
Multi-site forecasting is where AI creates the most significant value gap versus manual planning. A facility manager who manually manages one storeroom cannot monitor inventory availability at 12 other facilities simultaneously. OxMaint's AI forecasting operates at the portfolio level — when Facility A has 12 units of a part it has not consumed in 8 months and Facility B is about to run out, the system flags the transfer opportunity before Facility B places an emergency order at a 2–5× cost premium. Portfolio-level demand aggregation also improves forecast accuracy: the combined consumption signal across multiple sites is more statistically reliable than the lumpy, intermittent demand signal at any single site.
Start free to configure OxMaint's multi-site inventory visibility.
What is the ROI calculation for AI-driven spare parts forecasting?
The ROI calculation has three components: carrying cost reduction — 25–35% reduction in MRO inventory carrying costs (typically 20–30% of inventory value annually); emergency purchase premium elimination — each emergency purchase avoided saves 2–5× the planned unit cost plus expedited freight; and working capital release — AI typically identifies $1–2M in slow-moving excess stock per facility that can be liquidated or redistributed. For a facility with $800,000 in MRO inventory value and a 15% emergency purchase rate, the first-year return from carrying cost reduction and emergency purchase elimination typically exceeds $60,000 — before the working capital release from slow-mover disposal. Implementation cost in OxMaint is a fraction of this figure at any facility size.
PREDICTIVE MAINTENANCE AI · OXMAINT
Your Asset Condition Score Knows a Part Is Coming. Your Storeroom Should Too.
OxMaint Predictive Maintenance AI connects the 4 demand signals that matter — asset condition, PM schedules, consumption history, and failure patterns — to generate the dynamic, continuously updated reorder points that hold 23% less inventory, eliminate emergency purchases, and ensure every critical part is available when the work order that needs it is raised.