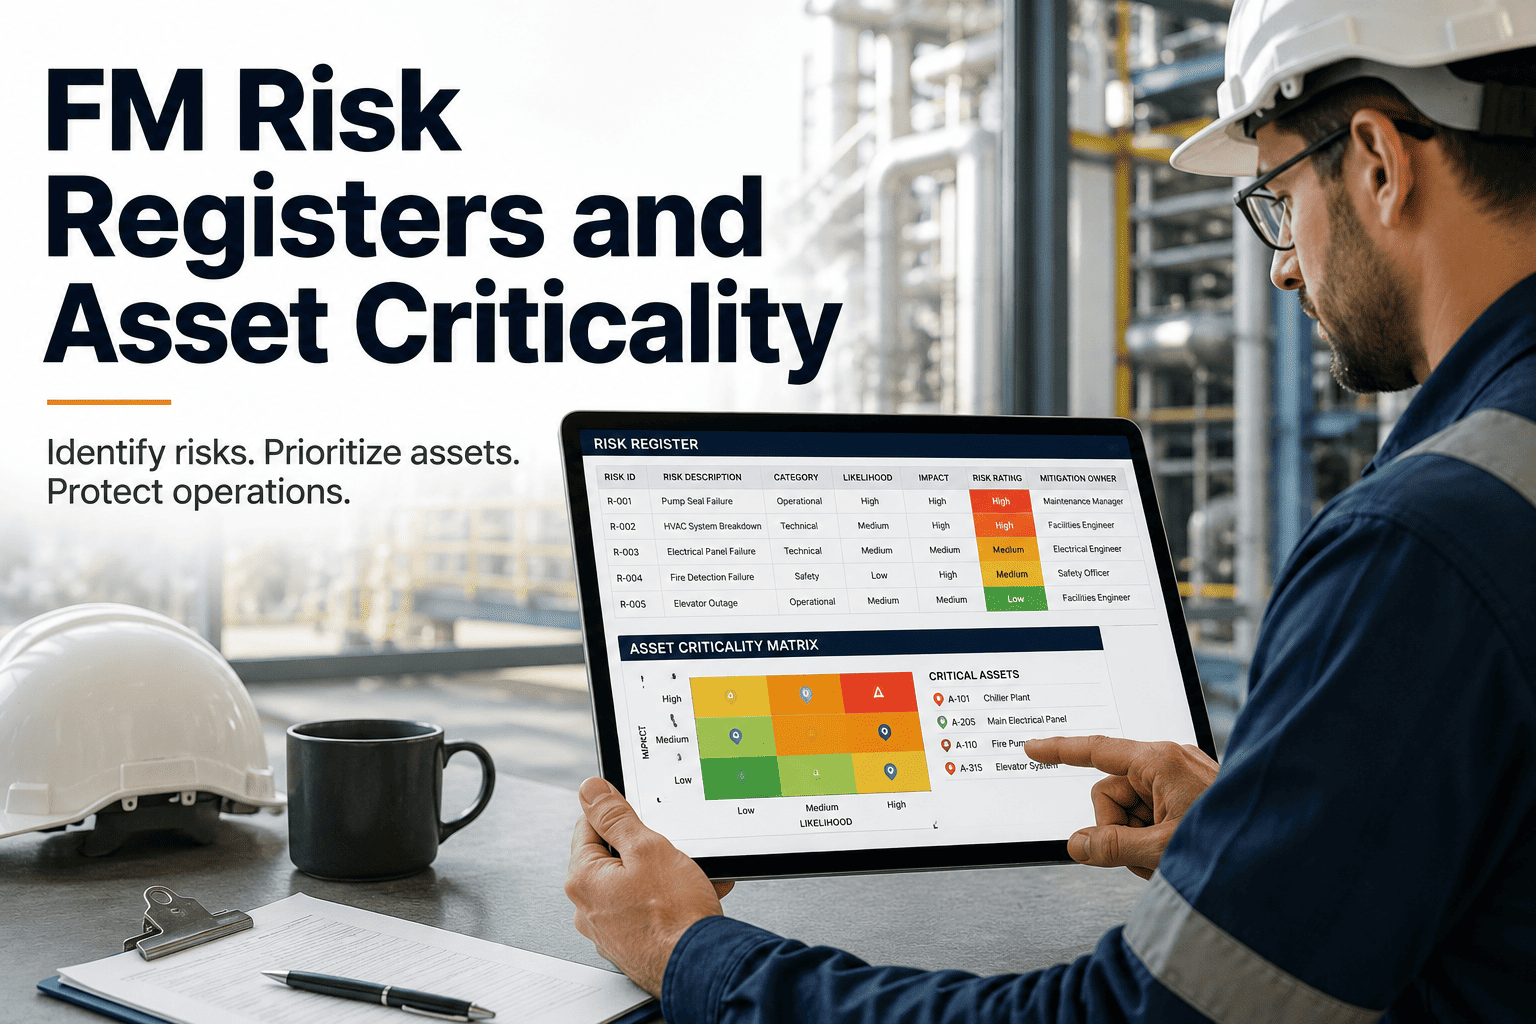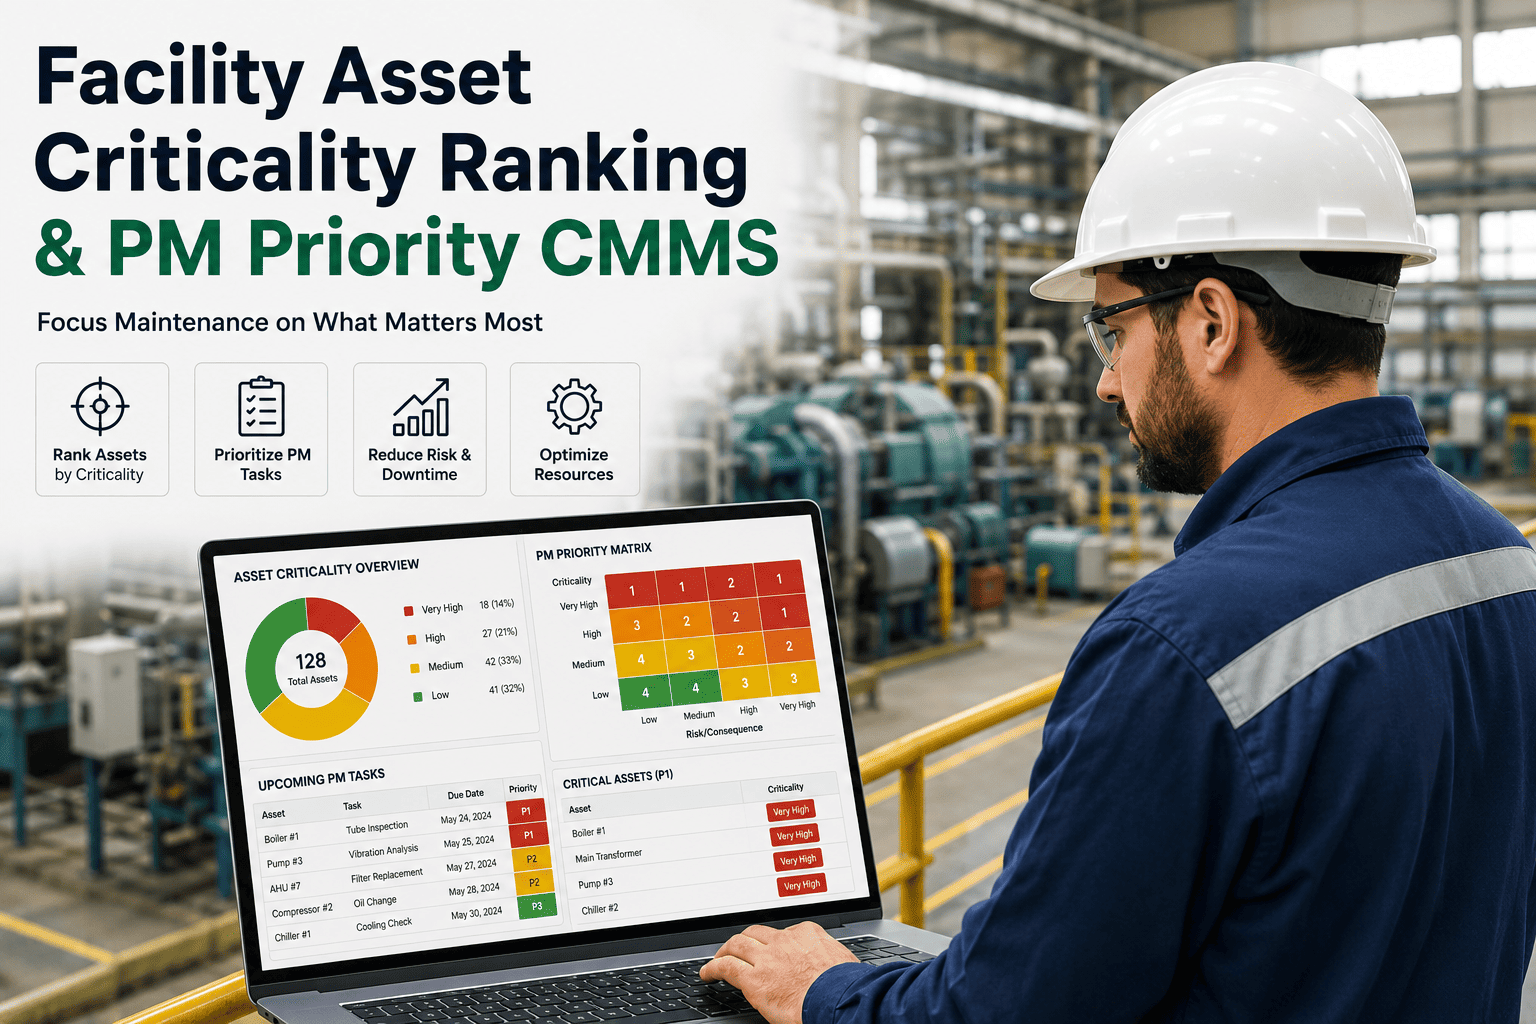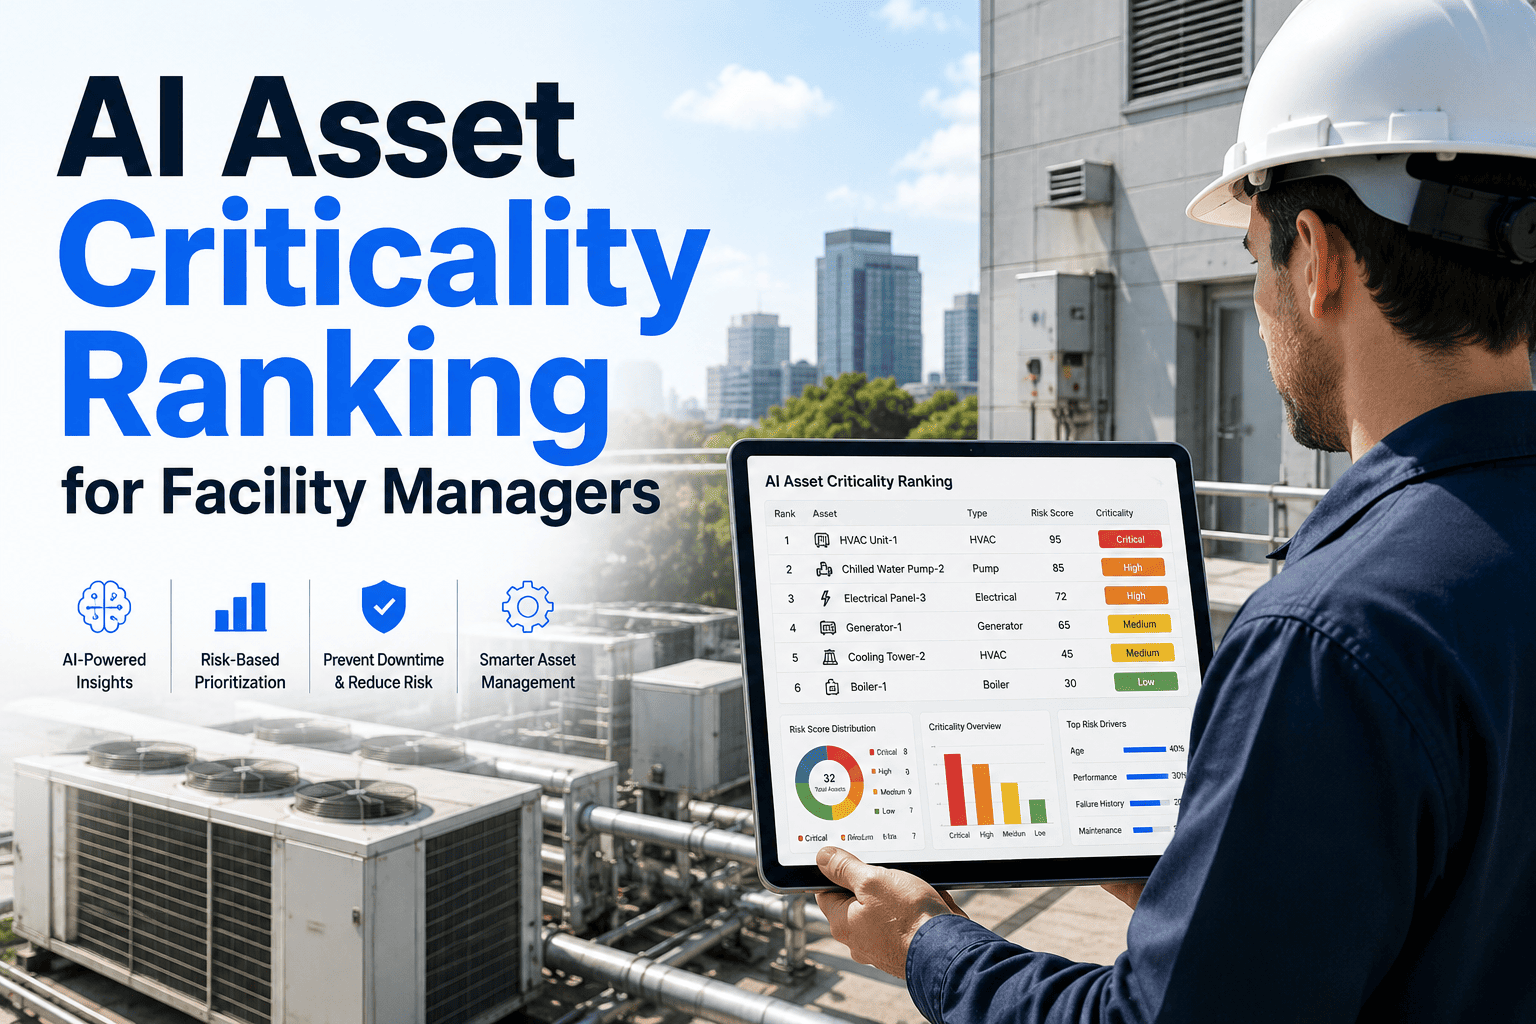
A facility with 2,000 maintainable assets cannot give every asset the same maintenance attention — that is not a resources problem, it is a decision problem. The facility manager who treats a lobby lamp with the same PM urgency as the main electrical transformer is not optimising their team; they are consuming finite maintenance capacity on assets that will not affect operations when they fail, while the assets that will cause significant downtime, safety incidents, or compliance failures receive the same routine attention as everything else. Asset criticality ranking — the systematic process of scoring every asset by its risk, downtime impact, cost of failure, and compliance importance — is the analytical foundation that makes maintenance investment allocation rational rather than intuitive. OxMaint's AI analytics module automates this analysis, building a continuously updated criticality score for every asset using live failure history, work order patterns, and cost data — surfacing which assets demand priority investment and which can safely run on a lower-frequency schedule.
Risk Priority Number scoring. Failure Mode and Effects Analysis. AI-driven pattern recognition across failure history and cost data. A continuously updated criticality rank for every asset in your portfolio — so maintenance spend goes where risk is highest, not where noise is loudest.
OxMaint extends the FMEA-based RPN framework with two additional dimensions specific to building operations — compliance impact and substitutability — producing a five-factor criticality score that reflects the full operational risk of each asset.
How badly does this asset's failure impact building operations, occupant safety, or service delivery? Scored 1–10 across four consequence categories: operations loss, life safety risk, regulatory non-compliance, and financial impact.
How frequently does this asset type fail under your facility's operating conditions? OxMaint calculates occurrence from the asset's own failure history, age and condition, and industry MTBF data — real data, not subjective estimate.
How easily can developing failure be detected before it causes operational impact? Assets with sensor coverage or structured inspections score lower. Assets with sudden, unannounced failure modes score highest.
Does this asset's failure trigger a regulatory notification, inspection impairment, or permit violation? Fire suppression systems, elevators, and boilers carry compliance consequences that multiply failure cost well beyond the repair bill.
Is there a redundant system or bypass that maintains service during repair? A sole-source chiller serving the entire building scores highest. An asset with full standby redundancy scores lowest on this dimension.
Once OxMaint calculates the composite criticality score for every asset, it assigns each to one of four tiers — each with a distinct PM frequency, inspection cadence, spare parts policy, and response SLA.
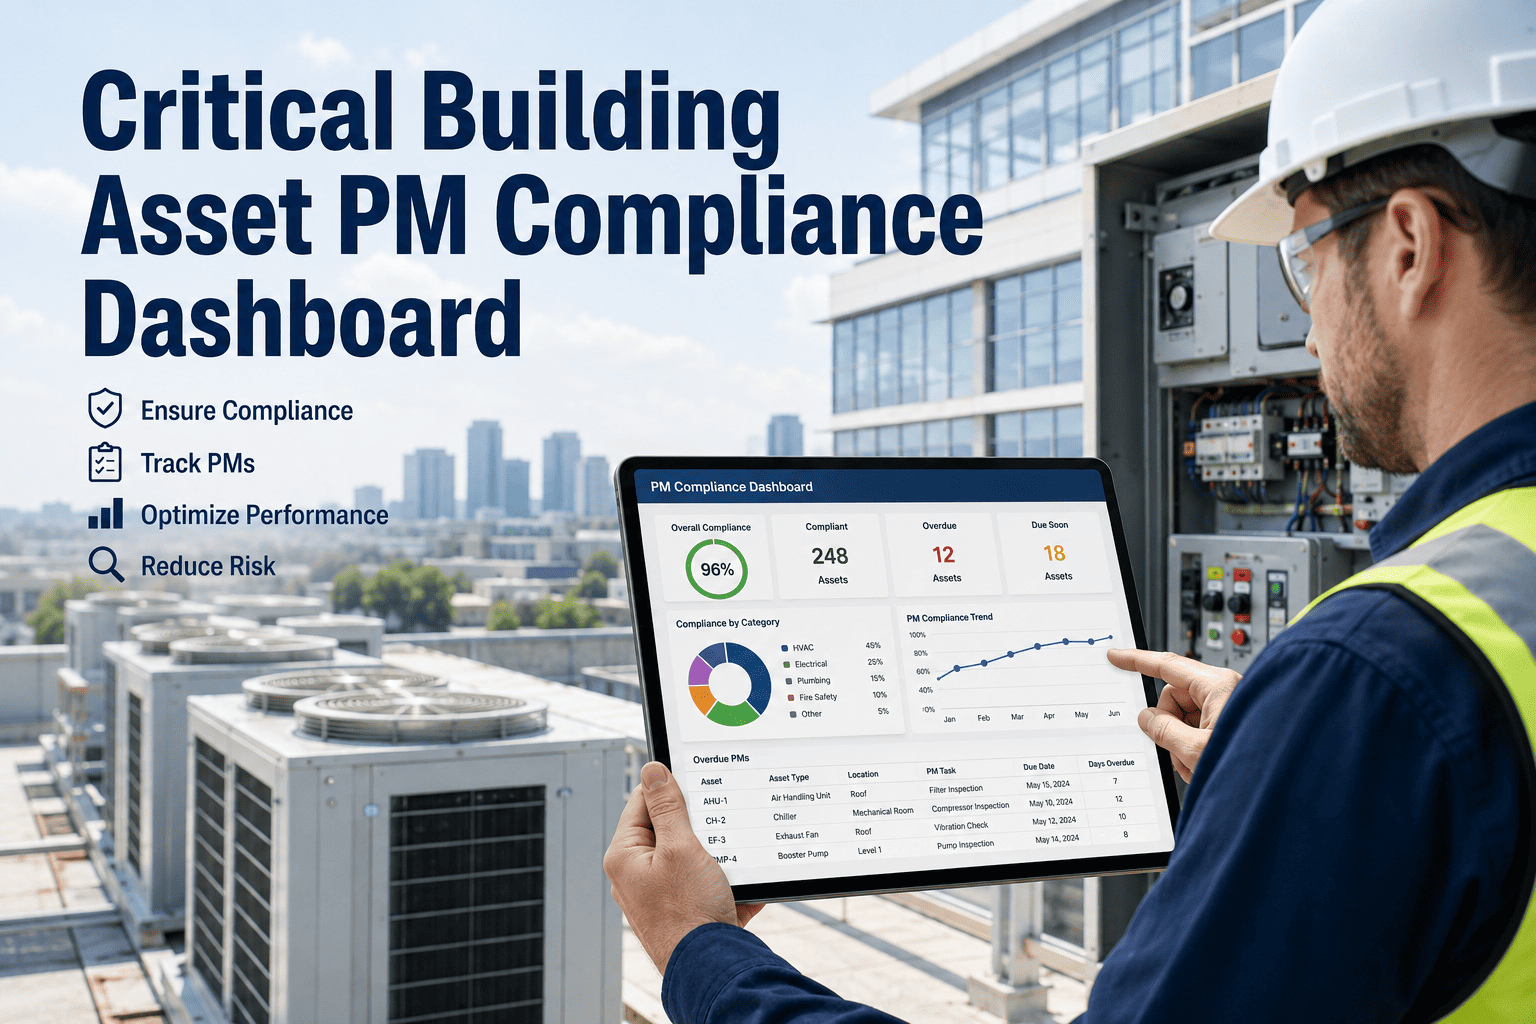
Live breakdown of asset count by tier with active work orders, PM compliance, and open deficiencies per tier. Directors see immediately whether critical assets are receiving proportional attention or whether effort is distributed uniformly regardless of risk.
Every open work order ranked by asset criticality × job urgency. A routine PM on a Tier 1 asset ranks above a corrective job on a Tier 4 asset. Systematic, consistent prioritisation — not subjective.
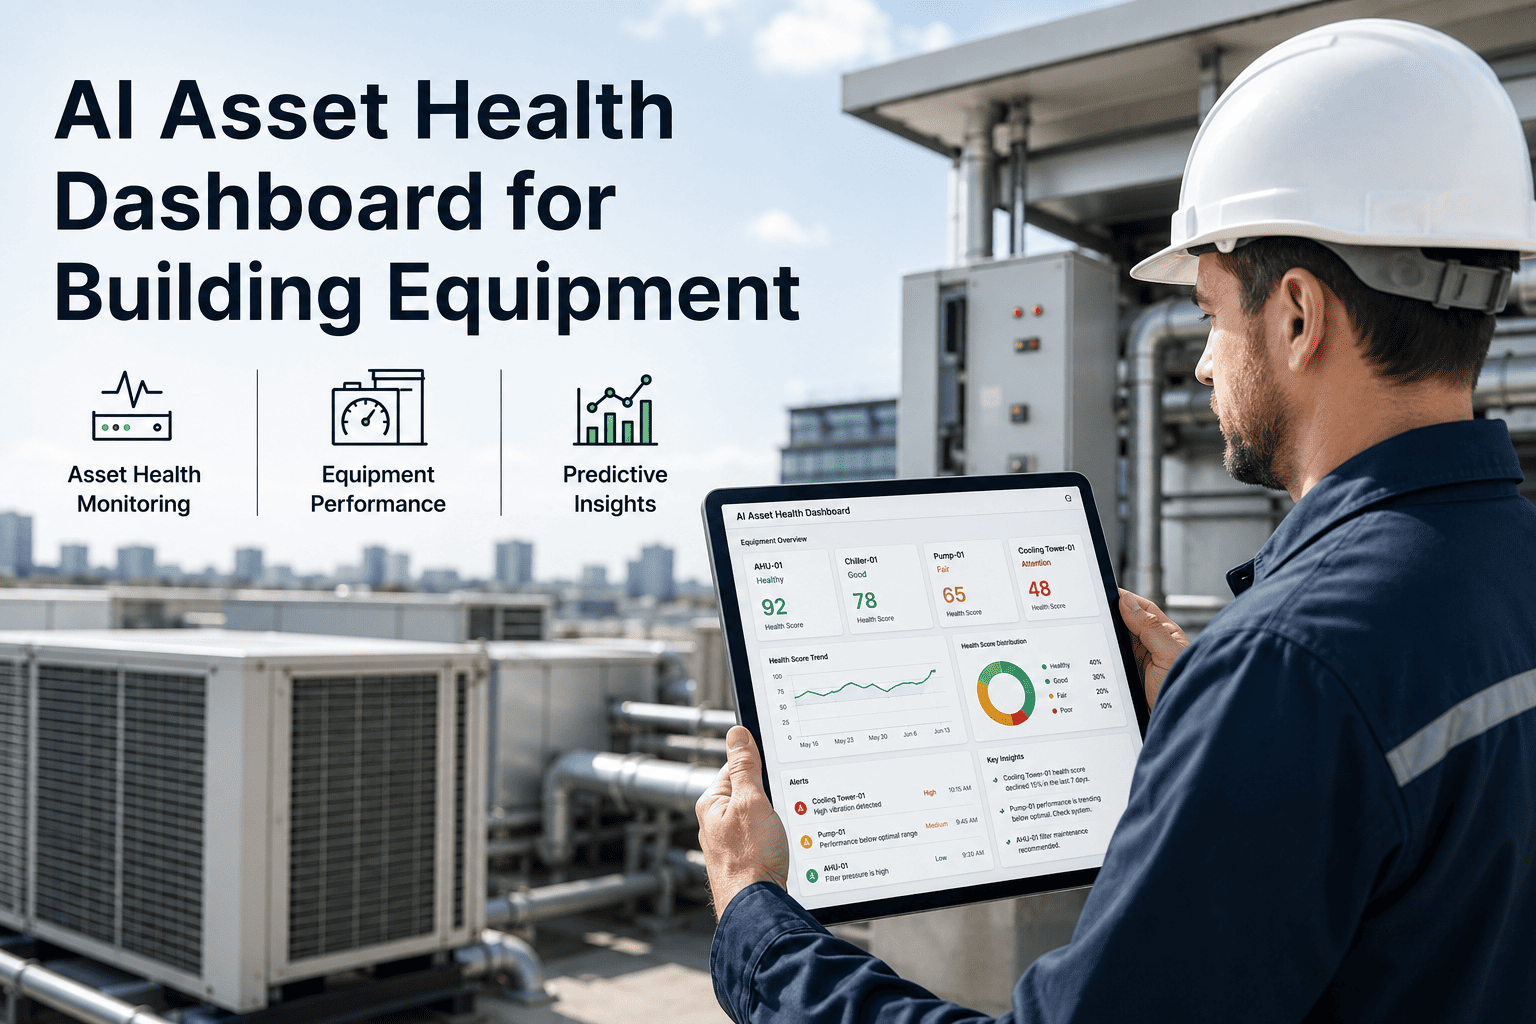
AI-generated failure probability estimates for Tier 1 and 2 assets based on age-adjusted MTBF, maintenance gap analysis, and condition trend data. Pre-emptive PM recommendations surface before any alarm fires.
Maintenance spend broken down by tier — actual vs. budget and 12-month trend. When Tier 1 assets are underspent relative to their criticality score, the dashboard flags the emerging risk before it becomes an unplanned failure.
The most common mistake I see in facility maintenance budgeting is treating every asset as equally important when allocating resources. A facility manager will cut PM frequency uniformly by 20% during a budget squeeze — applying the same reduction to the main transformer serving 40,000 sq ft of occupied space as to a toilet exhaust fan. The consequence is predictable: within 18 months, the asset that should have received more attention fails, the emergency repair costs more than the entire 20% budget reduction saved, and the facility manager cannot explain why the PM programme failed without conceding that no one knew which assets actually mattered. Asset criticality ranking converts that implicit knowledge into explicit scoring. It has to be systematic, it has to use real failure history rather than subjective ratings, and it has to update continuously as assets age. An AI system that does this continuously and surfaces results in the planner's daily queue is worth more than any PM programme applied uniformly to assets that don't merit the attention.
How does OxMaint's AI calculate criticality scores — does it require manual input?
OxMaint calculates criticality scores from three data sources automatically: your asset register (age, type, condition), your work order history (failure frequency, repair cost, downtime duration), and your compliance record (inspection schedules, permit obligations). For new assets, OxMaint uses industry MTBF benchmarks as the baseline — improving as facility-specific data accumulates. Facility managers can review and override AI-generated scores, with all overrides logged for audit purposes. Start your free trial to see criticality score generation for your current asset register.
How often does OxMaint recalculate asset criticality scores?
Criticality scores are recalculated on three triggers: weekly automated refresh incorporating the previous 7 days of work order data; immediately when a failure event is logged (occurrence score updates in real time); and when an age milestone or condition inspection changes the asset's rating. This continuous recalculation ensures the ranking reflects actual operating conditions rather than a point-in-time snapshot that grows stale. Book a demo to see the refresh cycle configured for your facility type.
Can OxMaint criticality scoring help justify maintenance budget requests?
Yes. OxMaint generates a criticality-based budget justification report showing the number of Tier 1 and 2 assets in the portfolio, their current PM compliance rate, the historical correlation between PM compliance and failure events, and the projected cost of deferred maintenance based on failure probability. When a finance director asks why the maintenance budget needs to increase, the answer is a data-backed analysis showing which high-criticality assets are currently under-maintained and what the expected cost of the resulting failures is. Start your free trial to generate a criticality budget report for your portfolio.
How does ISO 55001 relate to asset criticality ranking?
ISO 55001 requires organisations to identify which assets are critical to their objectives and demonstrate that resources are allocated proportionally to that criticality. A uniform PM schedule applied regardless of risk profile does not satisfy this requirement. OxMaint's criticality ranking — with documented scoring methodology, continuous refresh, and planner queue integration — provides the evidence of risk-based prioritisation that ISO 55001 auditors look for. Book a demo to see the ISO 55001 documentation package from OxMaint's analytics.
OxMaint's AI analytics engine continuously scores every building asset on severity, occurrence, detection, compliance impact, and substitutability — ranking them in a live priority order that drives PM scheduling, spare parts allocation, and maintenance budget decisions with data rather than intuition.