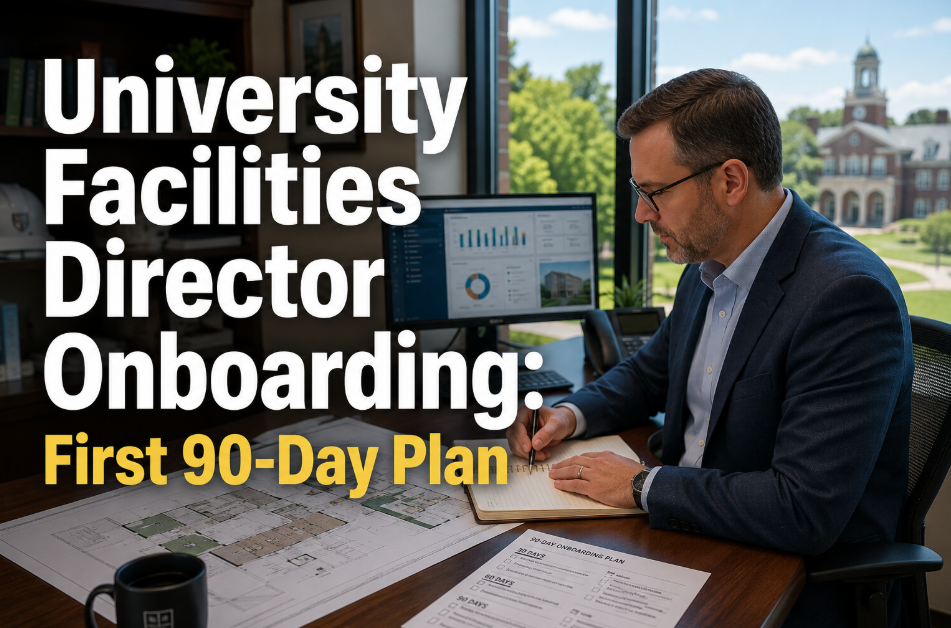
The associate director of facilities at a mid-sized state university opens her requisition tracker on a Tuesday morning and sees the same numbers she saw three months ago: 14 open trades positions, an average time-to-fill of 187 days, and three retirements scheduled before the end of the fiscal year. Her HVAC shop is running at 62% staffing. Her electrical shop just lost a 22-year journeyman to a private contractor offering $14 more per hour. The plumbing apprentice she hired in spring left for a union pipefitter program in August. Meanwhile, the work order backlog has crossed 3,400 open tickets, deferred maintenance keeps climbing, and the provost wants to know why classroom 214 in the chemistry building still has no functioning fume hood. This is the university trades workforce shortage in 2026 — and it cannot be solved by hiring alone. The math does not work. The labor pool is shrinking, wages are not competitive, and the work keeps accumulating. The institutions closing the gap are doing it through a combination of smarter hiring funnels, real apprenticeship pipelines, retention engineering, and CMMS-driven productivity that recovers 15–25% of lost capacity without adding a single headcount. If you want to evaluate productivity recovery for your own campus shops, you can start a free trial or book a demo to see the workflow on a campus configuration.
The Shortage in Numbers
Why University Trades Hiring Has Become Structurally Harder
The university trades workforce shortage is not a hiring problem you can solve by posting more requisitions. It is a structural mismatch between a shrinking, aging skilled labor pool and a higher-education compensation framework that was designed for a different decade. Public universities face three pressures at the same time: 41% of in-house trades staff are eligible to retire within five years, private-sector wages for HVAC, electrical, and controls technicians have grown 22–34% since 2020, and the pipeline of new tradespeople entering the workforce has not kept pace with retirements in any major metro area. The campuses that recognize this is not a temporary cycle are restructuring their entire workforce strategy — and using their CMMS as a productivity multiplier to absorb the gap. To see how productivity recovery actually shows up in technician hours, you can start a free trial on a campus configuration.
62%
Average shop staffing rate
Of authorized headcount actually filled across HVAC, electrical, plumbing, and controls at public 4-year universities.
$14/hr
Wage gap to private sector
Median delta between university pay scale and private contractor rates for licensed journeymen in trades roles.
3.2x
Backlog growth multiplier
Open work order backlog grows roughly 3.2x faster than headcount loss because of the deferred-maintenance compounding effect.
28%
First-year apprentice attrition
Of new apprentices leave campus programs within 12 months — often to union halls or private contractors with structured pathways.
Root Causes
Six Forces Driving the Campus Trades Gap
Before any hiring strategy works, the underlying causes have to be understood at the leadership level. The trades shortage on campuses is the result of six overlapping forces, and any retention or recruitment plan that addresses only one or two will fail. The institutions that have stabilized their workforce in the last 24 months have built strategies that address all six in parallel — and they have used CMMS data to quantify the cost of each force in dollar terms that resonate with the CFO. If you want to model that cost on your own backlog, you can book a demo to walk through the workforce analytics.
01
Demographic Cliff
The trades workforce skews older than nearly any other occupational category. Median age of a campus HVAC technician is 49. Retirements are accelerating while new entrants have declined for 12 consecutive years.
02
Wage Compression
University pay bands move with classified staff cycles, not the labor market. Private HVAC and controls firms can raise wages quarterly. Public universities often need 18-month approval cycles to adjust scales.
03
Slow Hiring Cycles
Average requisition-to-start time is 187 days. The best candidates accept offers from private contractors in 9–14 days. Campuses lose talent before they can interview them.
04
No Career Ladder
Many campus shops have flat structures — apprentice, journeyman, and lead. Without clear progression, apprentices leave for union halls that publish multi-year wage and skill milestones.
05
Tool and System Friction
Paper work orders, fragmented asset records, and clipboard rounds force experienced technicians to spend 30–40% of their day on coordination instead of skilled work. The job feels older than it should.
06
Aging Asset Pressure
Average campus building is 47 years old. Asset failure rates rise faster than headcount. The same crew handles more reactive work each year, which crowds out preventive maintenance and accelerates the cycle.
Hiring Strategy
Building a Trades Hiring Funnel That Actually Closes Candidates
Most university trades hiring funnels are designed for a labor market that no longer exists. They assume candidates will apply, wait 90 days for a panel interview, accept a wage 18–22% below the private market, and stay for 20 years. None of those assumptions hold in 2026. The campuses that are filling positions have rebuilt the funnel around four mechanics: speed, transparency, total-rewards packaging, and an honest career pathway. The goal is not to compete with private contractors on wage alone — it is to compete on stability, benefits, training investment, and the daily work experience.
Lever 01
Compress Time-to-Offer Under 30 Days
Pre-approved interview panels, standing background-check vendors, and conditional offers extended within 72 hours of interview. Campuses that move from 187 days to 28 days see 3.4x higher offer acceptance.
Lever 02
Publish Total Compensation, Not Base Wage
Health, retirement match, tuition remission for dependents, paid holidays, and pension value add $28k-$45k to a published base. Most candidates never see this until offer stage — by then, half have signed elsewhere.
Lever 03
Target Mid-Career, Not Just Journeymen
Tradespeople with 8–14 years of private contractor experience often value campus stability after raising young families. Recruiting messaging built around predictable schedules and benefits outperforms wage-led pitches.
Lever 04
Build Relationships With Local Trade Schools
Campus visits, paid summer shadow programs, and equipment lab partnerships create a feeder pipeline. Universities investing in 2–3 local technical schools fill 35–50% of entry-level roles from those relationships.
Lever 05
Hire Veterans Through SkillBridge
Transitioning military personnel with HVAC, electrical, and mechanical MOS designations bring credentialed experience. SkillBridge fellowships allow zero-cost evaluation before offer with a 78% conversion rate.
Lever 06
Replace Panel Interviews With Shop Walk-Throughs
Skilled tradespeople evaluate jobs by the shop, the tools, the CMMS, and the lead. A 90-minute shop tour with the working crew converts at 2.6x the rate of a conference-room panel interview.
Apprenticeship Pipelines
Building a Real Apprenticeship Program That Retains Talent
Campuses have run apprenticeship programs for decades, but most are unregistered, unstructured, and produce graduates who immediately leave for higher-paying private work. A real apprenticeship pipeline — one that retains 70%+ of graduates as career campus tradespeople — has four ingredients that the underperforming programs lack. The first is a registered apprenticeship status through the U.S. Department of Labor or state equivalent, which gives apprentices a portable nationally-recognized credential and signals the program is serious. The second is a wage progression tied to clear competency milestones tracked in the CMMS itself. The third is a defined journeyman pathway with named mentors and rotation through every shop. The fourth is a retention bonus structure that begins at journey-out and increases over the first five post-completion years.
Apprenticeship Wage and Competency Progression — Sample Four-Year Pipeline
Year 1
55% of journey rate
Tools, safety, basic systems, supervised work orders only, CMMS data entry
2,000 OJT + 144 RTI hours
Year 2
65% of journey rate
Independent PM execution on Tier 3 assets, code basics, system commissioning support
2,000 OJT + 144 RTI hours
Year 3
75% of journey rate
Reactive work orders on Tier 2 assets, controls fundamentals, journeyman shadowing
2,000 OJT + 144 RTI hours
Year 4
85% of journey rate
Tier 1 critical asset work, licensure exam preparation, lead-track readiness
2,000 OJT + 144 RTI hours
Journey-Out
100% + $2,500 retention bonus
Licensed journeyman, full asset autonomy, mentor for next apprentice cohort
Annual retention bonus through Year 5
CMMS Productivity Levers
How Oxmaint Recovers Lost Shop Capacity Without New Hires
Hiring and apprenticeships solve the workforce shortage over a 3-to-5-year horizon. CMMS productivity levers solve a meaningful portion of it inside 90 days. The data is consistent across higher education facility studies: campus tradespeople spend only 38–45% of a working day on wrench-on-asset time. The remaining 55–62% goes to travel, parts retrieval, paperwork, looking for work order details, calling supervisors, and re-entering information. A modern campus-configured CMMS reclaims 15–25% of that lost time and converts it directly into completed work orders — the equivalent of adding 2–4 technicians per 25-person shop without a single new hire. To model the recovery on your own backlog, you can start a free trial or book a demo.
01
Mobile Work Order Execution Eliminates the Truck-to-Desk Cycle
Technicians receive, update, document, and close work orders from their phone at the asset. No return trip to the shop for paperwork. Average recovery: 42 minutes per technician per day.
02
Asset Hierarchy Cuts Search Time on Every Work Order
Portfolio > Building > System > Asset > Component structure means a technician dispatched to a building gets the right equipment, manual, history, and parts list on first tap — not after three calls to the foreman.
03
PM Scheduling Tied to Asset Condition, Not Calendar Alone
Condition-based PM triggers reduce the volume of unnecessary calendar-driven inspections by 18–30%, freeing skilled hours for backlog reduction without sacrificing reliability or compliance posture.
04
Spare Parts Visibility Prevents Multi-Trip Work Orders
Real-time MRO inventory linked to assets means a technician knows the part is in stock before traveling. Reduces incomplete work orders by 31% and the resulting return visits.
05
Digital Inspections Replace Clipboard Rounds
Tier 1 building rounds completed on mobile with photo capture, signature, and immediate work order generation. Round times drop 22–28% and findings convert to work orders in real time.
06
Apprentice Tracking Inside the Work Order System
Each apprentice's competency milestones, hours, and supervised completions logged inside the CMMS itself — no separate spreadsheet, audit-ready for registered apprenticeship reporting.
07
Workload Analytics Surface Hidden Capacity Gaps
Shop-level dashboards show backlog trend, PM compliance, MTTR, and technician utilization side by side. Facility directors stop guessing where the bottleneck is and start fixing it weekly.
08
CapEx Forecasting Justifies the Headcount Request
5–10 year rolling forecasts on asset replacement tie directly to the staffing model. CFO conversations move from "we need more techs" to "deferred maintenance compounds $1.4M annually without 3 added FTEs."
Before vs After
What Changes When CMMS Productivity Levers Are Deployed
The clearest way to communicate the recovery to a provost, CFO, or board is a direct before-and-after comparison using the same crew, the same buildings, and the same backlog. Below is a representative comparison drawn from campuses that implemented a modern CMMS over a 12-month period without adding headcount.
| Operational Metric | Before CMMS Optimization | After CMMS Optimization |
| Wrench-on-asset time per technician | 41% of working day | 58% of working day |
| Average work order completion time | 6.8 days | 2.9 days |
| PM compliance rate | 64% | 91% |
| Open backlog (work orders) | 3,400 tickets | 1,950 tickets |
| Reactive vs planned work ratio | 72 / 28 | 38 / 62 |
| Apprentice retention at 24 months | 54% | 81% |
| Average return trips per work order | 1.6 | 0.4 |
| Effective capacity gain (FTE equivalent) | Baseline | +3.2 FTE per 25-tech shop |
Retention Engineering
Why Retention Beats Recruitment Every Time
Hiring a replacement journeyman costs a public university an average of $38,000 in recruitment, onboarding, productivity ramp, and lost institutional knowledge. Keeping that same journeyman through one additional year through targeted retention investment costs less than $8,000 in most cases. The math favors retention by 4.8x, yet most campus facilities departments allocate over 80% of their workforce budget to recruitment activities. The campuses that have stabilized their trades workforce shifted that ratio — and the changes that drove retention are not always the obvious ones.
+34%
Tool and System Investment
Modern CMMS, mobile devices, and updated diagnostic equipment increase retention by 34% among technicians under age 40 — they evaluate jobs partly by the technology they use daily.
+28%
Predictable Schedules
Reducing on-call frequency from weekly to monthly cycles increases retention 28%. Campus advantage over private sector is schedule stability — protect it deliberately.
+22%
Continuing Education Funding
$2,500 annual training stipend for trade certifications, controls courses, or licensure renewal drives 22% retention lift and builds skill inventory campus needs anyway.
+19%
Named Career Pathway
Documented progression from apprentice to lead to supervisor with skill milestones in the CMMS raises retention 19% — uncertainty about future role is a top exit reason.
Recover 15-25% of Lost Trades Capacity in Your Next Operating Cycle
The trades workforce shortage will not resolve through hiring alone. Oxmaint gives your campus facilities team the mobile work order execution, asset hierarchy, condition-based PM, and apprentice tracking that recovers the equivalent of 2–4 technicians per 25-person shop — without adding a single headcount. Evaluate the workflow on a campus configuration and see the productivity numbers your own backlog can support.
FAQ
Frequently Asked Questions
How quickly can a campus expect productivity gains after deploying a modern CMMS?
Most campuses see measurable productivity gains within 60–90 days of go-live, driven first by mobile work order execution and asset hierarchy improvements. Full capacity recovery of 15–25% typically materializes inside 12 months as PM compliance climbs, reactive backlog drops, and the reactive-to-planned ratio inverts. The earliest wins are reduction in return trips and faster work order close-out times.
Does running a registered apprenticeship program actually improve retention?
Registered apprenticeship graduates retained at the sponsoring campus at 81% over 24 months in recent data, versus 54% for unregistered programs. The portable credential, structured wage progression, and documented competency milestones give apprentices a clear pathway, and the journey-out plus 5-year retention bonus structure converts that pathway into long-term loyalty.
Can Oxmaint track apprenticeship hours and competencies for Department of Labor reporting?
Yes. Apprentice hours, work order assignments, supervised completions, and competency milestones are tracked inside the CMMS at the work order level. Reports can be generated directly for state apprenticeship office submissions, DOL reporting, and internal audit — eliminating the spreadsheet shadow systems most apprenticeship coordinators currently maintain.
How does the CMMS support the CFO conversation about staffing requests?
Oxmaint produces backlog trend, PM compliance, MTTR, and capacity utilization reports that quantify the cost of unfilled positions in dollar terms — deferred maintenance growth, emergency repair multipliers, and CapEx acceleration. The rolling 5–10 year CapEx forecast converts a staffing request from "we need more techs" into a fully-modeled financial case the CFO can present to the board.