Power plant outage performance analytics turns the chaos of a planned shutdown into measurable, repeatable success — tracking planned vs actual duration, cost variance, scope changes, contractor productivity, and critical-path slippage in one CMMS-based dashboard. A typical fossil plant outage costs $1M–$5M per day in lost generation, so even a 5% schedule overrun can erase a year of maintenance budget. OxMaint consolidates every work order, timesheet, spare-parts issue, and contractor invoice into real-time outage reporting — giving reliability managers the data they need to stop overruns before they escalate. Ready to see it on your assets? Start Free Trial or read on for the full outage analytics framework.
Stop guessing why your outage overran budget by 18% — see it live, fix it mid-execution
The average power plant outage runs 12–20% over planned duration and 15–25% over budget. OxMaint's CMMS outage analytics surface variance in real time — not in a six-week post-outage report — so you can course-correct while $40K/hour is still on the clock.
What should a power plant outage report track?
A defensible outage performance report goes beyond "did we finish on time." It captures six dimensional KPIs that reveal whether your outage was genuinely efficient or just lucky. Industry benchmarks from INPO and EPRI show plants tracking all six consistently outperform peers by 20–30% on both cost and duration.
Schedule Performance Index (SPI)
SPI = Earned Hours ÷ Planned Hours
Measures whether work is progressing at the planned rate. An SPI below 0.90 by day 3 of an outage signals a critical-path delay that will compound daily. Target: ≥ 0.95.
Cost Performance Index (CPI)
CPI = Earned Value ÷ Actual Cost
Tracks real-time spend against earned value. A CPI trending below 0.85 means you are paying more for less completed work — typically driven by contractor overtime or rework.
Scope Change Count
Emergent WOs ÷ Baseline WOs
Measures how much unplanned work emerged during execution. A ratio above 15% indicates weak preventive planning or poor condition assessment prior to the outage window.
Contractor Productivity
Completed WOs ÷ Contractor Hours
Normalises output across vendors so you can compare a 50-person turbine team against a 12-person valve crew. Low productivity contractors inflate outage cost by 10–18%.
Outage cost analysis: where the money actually leaks
A 600 MW coal plant spending $4.2M on a planned 21-day outage typically sees cost overruns of $630K–$1.05M. Post-mortem reports attribute 70%+ of that variance to four recurring categories — all of which are trackable in real time with a CMMS rather than discovered weeks later in a spreadsheet.
Total Outage Cost = (Planned Labor + Contractor Labor + Materials + Spare Parts + Tooling & Rentals) + (Lost Generation Revenue × Duration Overrun Days) + (Rework & Emergent Work)
The first bracket is your baseline budget. The second and third brackets are where variance lives — and where live CMMS outage analytics pays for itself by catching overruns on day 2, not day 30.
| Cost Category | Typical % of Outage Budget | Common Variance Driver | CMMS Visibility |
|---|---|---|---|
| Contractor Labor | 35–45% | Overtime, low productivity, standby | Live timesheet vs WO completion |
| Spare Parts & Materials | 20–28% | Expediting, wrong parts, overstock | Inventory issue tracking & reservation |
| Lost Generation Revenue | 15–25% (variance only) | Critical-path slippage, rework | SPI/CPI dashboard, critical-path WO alerts |
| Tooling & Equipment Rentals | 8–12% | Extended rental due to delays | Asset reservation & return date tracking |
| Rework & Emergent Work | 5–15% | Poor QA, incomplete scope, missed inspections | Emergent WO tagging & root-cause analytics |
A 180-asset steam plant: $420K recovered in one outage cycle
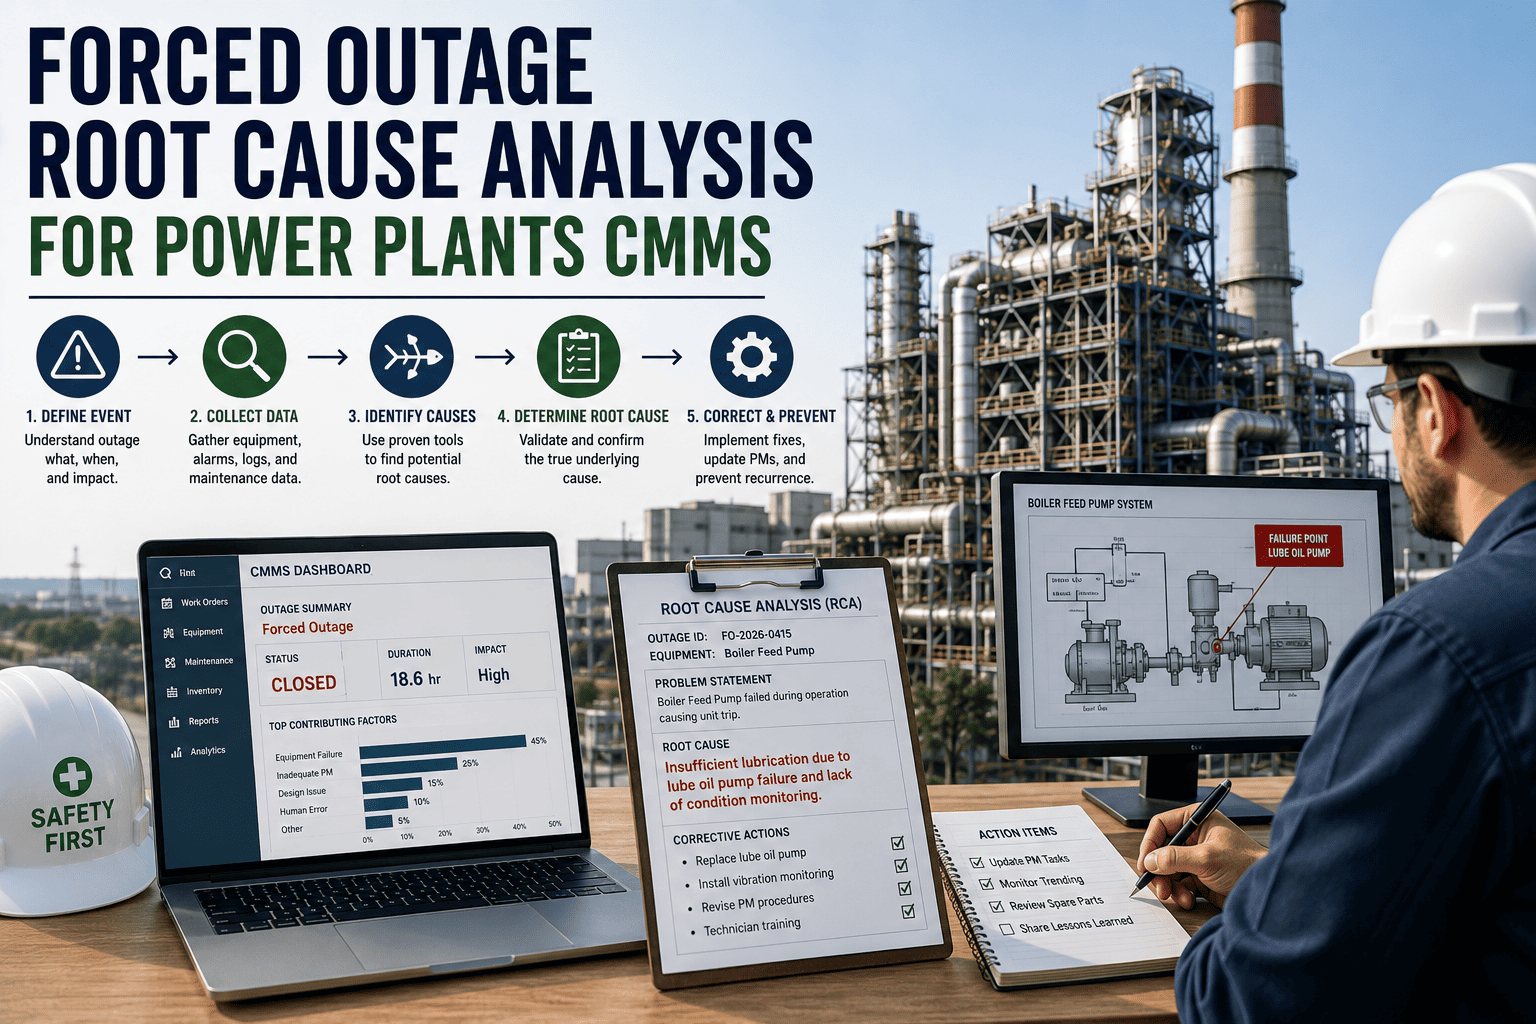
A 180-asset steam plant spending $2.8M annually on outage work deployed OxMaint's CMMS outage analytics mid-cycle. By day 5 of their spring outage, the SPI dashboard flagged turbine casing bolt removal running at 0.78 SPI — three days behind plan. The reliability lead reallocated two contractor crews from non-critical-path work, recovered 1.5 days, and avoided $420K in lost-generation revenue and expedited parts costs. Without live analytics, that variance would have appeared in a post-outage report six weeks later — too late to act.
How CMMS outage analytics transforms reporting from reactive to predictive
Traditional outage reporting is a post-mortem: a 40-page PDF assembled 4–6 weeks after the outage ends, when every dollar has already been spent. CMMS-based outage analytics flips that model — every work order, timesheet, parts issue, and QA checkpoint feeds a live dashboard so managers see variance the moment it happens and can intervene before it compounds.
- Post-outage report delivered 4–6 weeks late
- Duration variance discovered after unit returns to service
- Contractor productivity buried in paper timesheets
- Scope changes tracked manually in Excel
- No baseline to compare outage-to-outage
- Cost overruns attributed to "unknown emergent work"
- Live outage dashboard from day 0, mobile-accessible
- SPI/CPI alerts trigger at 0.90 threshold — same shift
- Contractor productivity scored per crew, per WO, in real time
- Emergent WOs auto-tagged with reason codes & cost impact
- Outage-to-outage benchmarking across 40+ KPIs
- Variance attributed to specific assets, vendors, and work types
How OxMaint helps: 4 capabilities that close the outage variance gap
OxMaint was built for maintenance and reliability teams who can't afford to wait six weeks for a post-outage report. These four capabilities map directly to the cost and schedule variance drivers that derail power plant outages.
Live Outage Dashboard
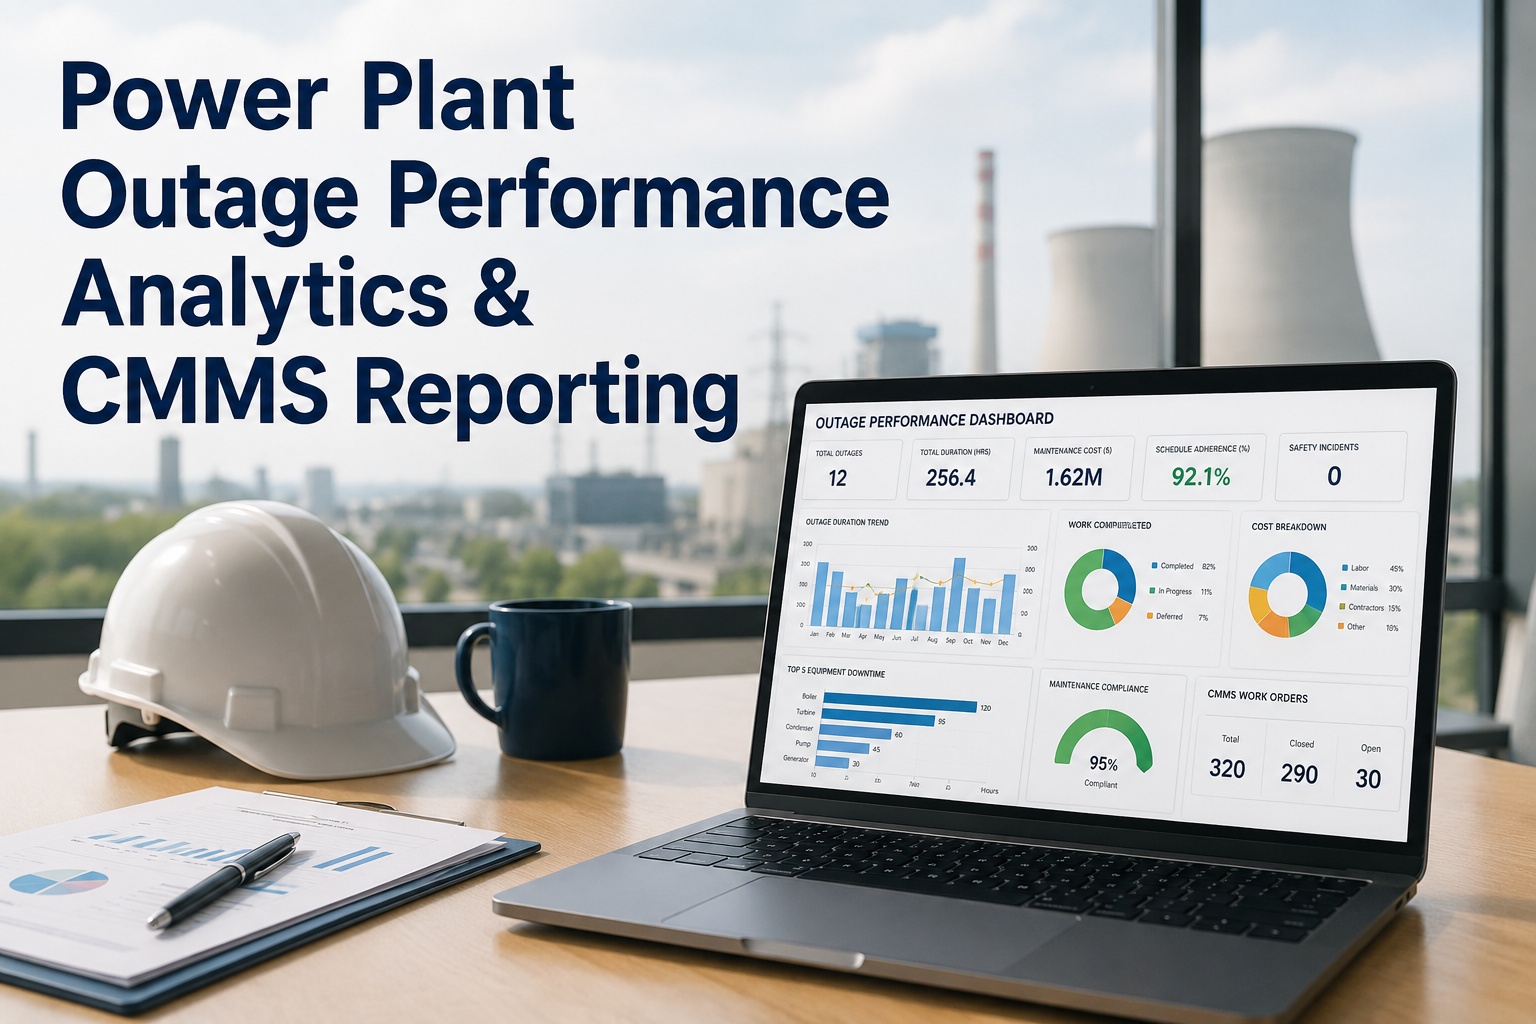
Real-time SPI, CPI, scope-change ratio, and critical-path WO completion — updated every time a technician closes a work order from the field. Replaces the daily 7 AM status meeting with a single screen.
Outcome: Cut variance detection from 6 weeks to same-shift.
Contractor Performance Tracking
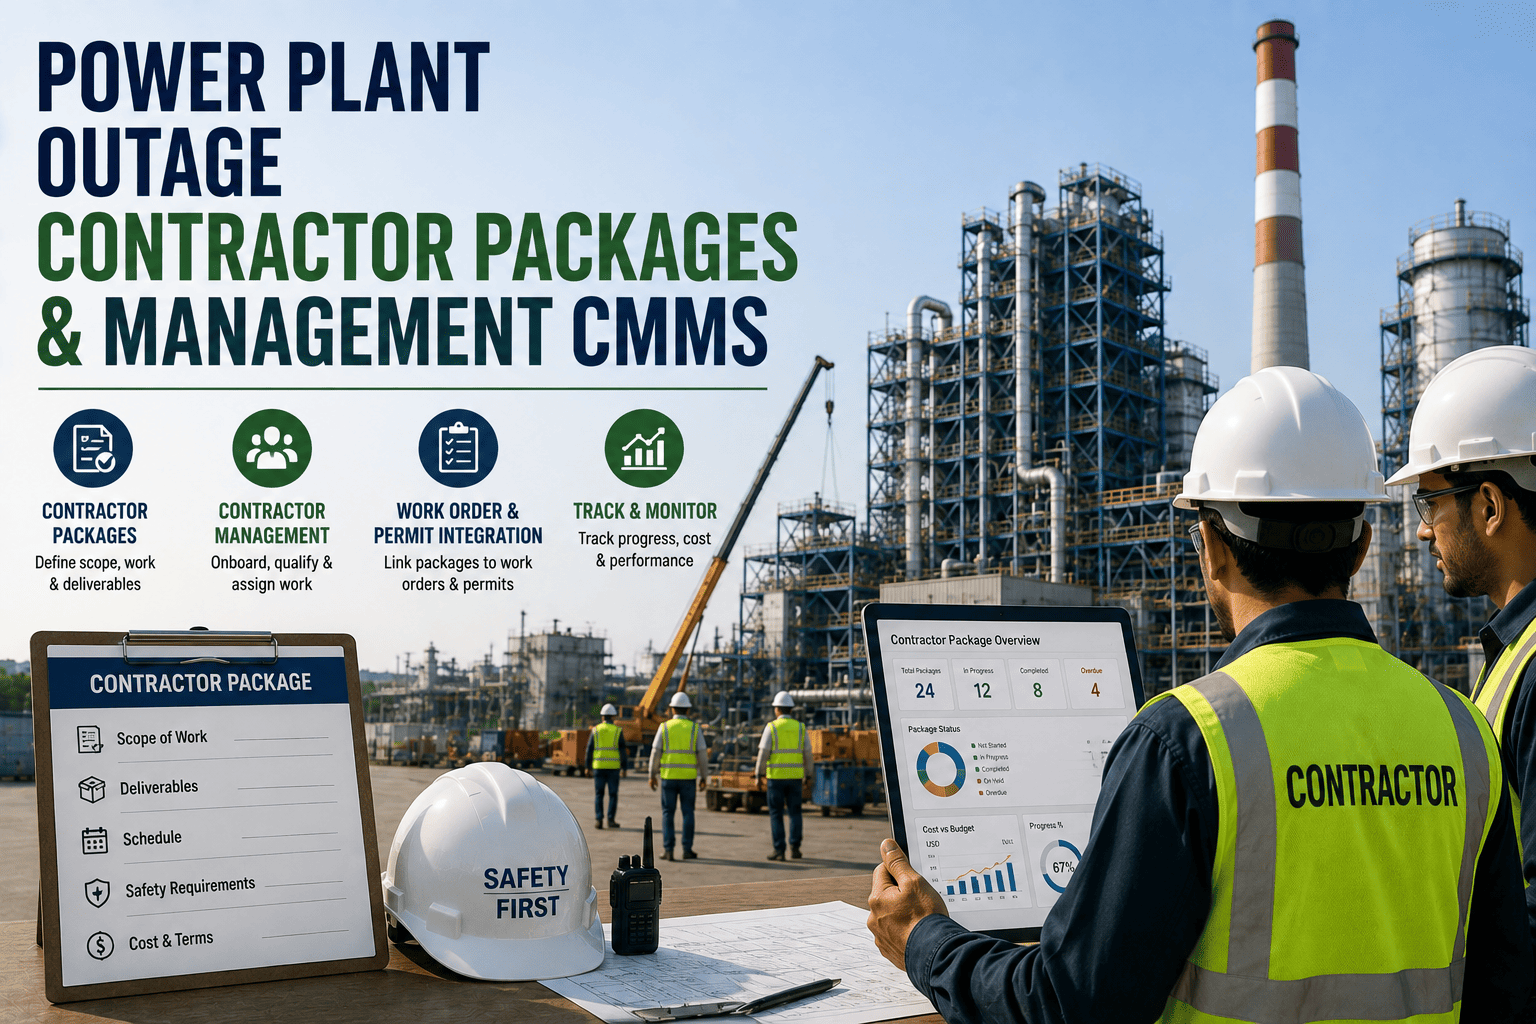
Score every vendor by completed WOs per hour, rework rate, and safety incidents — normalised across crews of different sizes. Feed results directly into your next outage contract negotiations.
Outcome: 10–18% contractor cost reduction by outage 2.
Spare Parts Reservation & Cost Tracking
Reserve critical spares against outage WOs before execution begins. Track actual issue cost vs budgeted cost in real time, with auto-alerts when expediting spend exceeds 5% of plan.
Outcome: Eliminate 90% of mid-outage parts expediting.
Outage-to-Outage Benchmarking
Automatically archive every outage's KPIs — duration, cost per MW, emergent work ratio, contractor scores — and benchmark the next outage against the last five. Spot whether your outage performance is improving or quietly degrading.
Outcome: 8–12% year-over-year outage cost reduction.
Building your plant outage dashboard: 7 tiles every manager needs
A well-designed outage dashboard answers one question in under five seconds: "Are we on plan, over budget, or behind schedule — and where exactly?" These seven tiles, drawn from best practices across 200+ power generation outages, form the minimum viable dashboard for outage performance reporting.
Schedule Performance
Earned vs planned hours, with red/amber/green thresholding at 0.85 / 0.90 / 0.95.
Cost Performance
Earned value vs actual spend, with daily burn-rate trend line and forecast-to-complete.
Work Order Completion
Completed vs total scoped WOs, segmented by critical path vs non-critical.
Scope Change Ratio
Emergent WOs as % of baseline, with reason-code breakdown (QA finding, inspection result, etc.).
Cost Variance ($)
Budgeted vs actual dollars, with top-5 variance-driving WOs listed by dollar impact.
Critical Path Status
Remaining duration on every critical-path WO, with float/slack consumed indicator.
QA & Safety
Open QA holds, completed inspections, and safety observations — zero-tolerance items flagged.
See OxMaint's outage dashboard on your plant's assets
Book a 30-minute demo and we'll configure a live outage dashboard using your work order data, KPI targets, and contractor list — before you commit to anything.
Power plant outage analytics & CMMS reporting: frequently asked questions
What is power plant outage performance analytics?
Outage performance analytics is the systematic measurement of a planned power plant shutdown against its baseline plan — tracking schedule performance (SPI), cost performance (CPI), scope changes, contractor productivity, and critical-path slippage in real time. When powered by a CMMS like OxMaint, these metrics update live from field work orders rather than being assembled weeks later in a post-outage report. Start Free Trial to see it in action.
How do you calculate outage cost variance?
Outage cost variance = Actual Cost − Budgeted Cost (or, in earned-value terms, CV = Earned Value − Actual Cost). A negative CV means you are over budget. The deeper value comes from decomposing variance by category — contractor labor, spare parts, tooling rentals, and emergent work — so you know exactly where the money leaked and can prevent a repeat in the next outage cycle.
What metrics should a plant outage dashboard include?
A minimum viable outage dashboard should include Schedule Performance Index (SPI), Cost Performance Index (CPI), work order completion percentage (critical path vs non-critical), scope change ratio, dollar cost variance, critical-path remaining duration, and QA/safety holds. Together these seven tiles let a manager answer "are we on plan?" in under five seconds without paging through a 40-page report.
How does a CMMS improve outage reporting compared to spreadsheets?
A CMMS replaces the manual post-outage report with a live dashboard fed by every work order, timesheet, and parts issue entered in the field. Variance is detected on day 2 instead of week 6, contractor productivity is scored objectively rather than by gut feel, and outage-to-outage benchmarking becomes automatic. Plants switching from Excel to a CMMS typically cut reporting time by 60–70% and reduce outage cost variance by 8–15% within two cycles.
Can OxMaint track contractor performance during an outage?
Yes. OxMaint scores every contractor by completed work orders per hour, rework rate, and safety incidents — normalised across crews of different sizes. Scores update live during execution and are archived for outage-to-outage benchmarking, so you can negotiate your next outage contract with objective productivity data. Book a demo to see contractor scoring configured for your vendor list.
Your next outage doesn't need to overrun by 18%
Join the reliability teams using OxMaint to detect schedule and cost variance on day 2 — not week 6. Configure your live outage dashboard in under 48 hours and benchmark your next shutdown against your last five.
Free 14-day trial · No credit card required