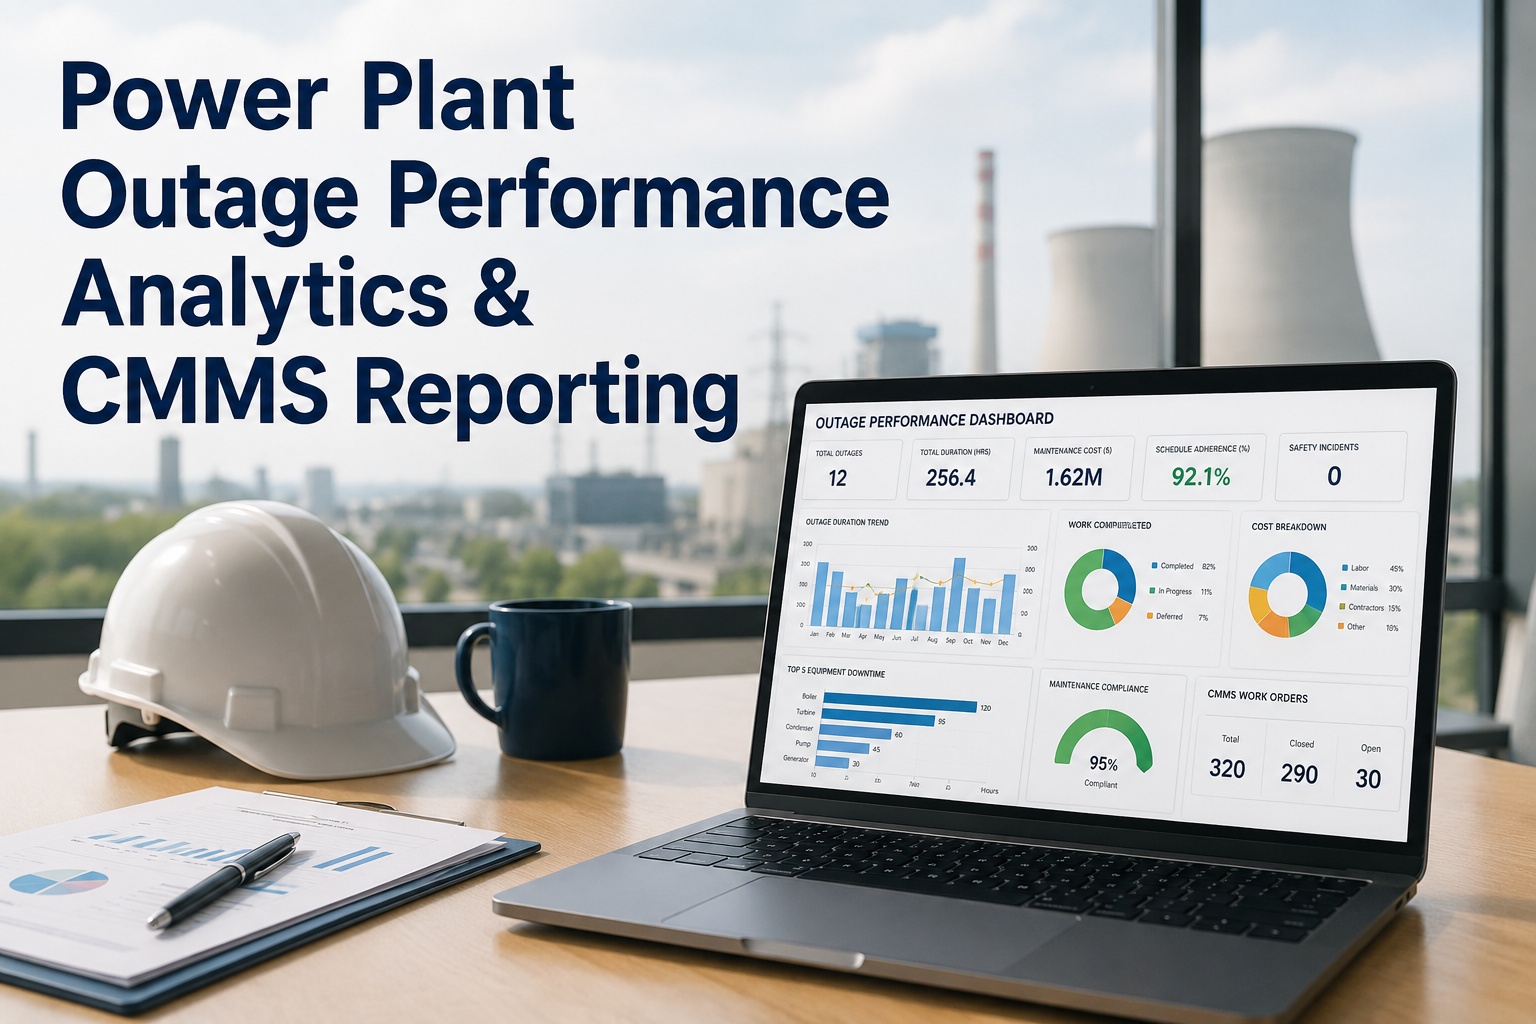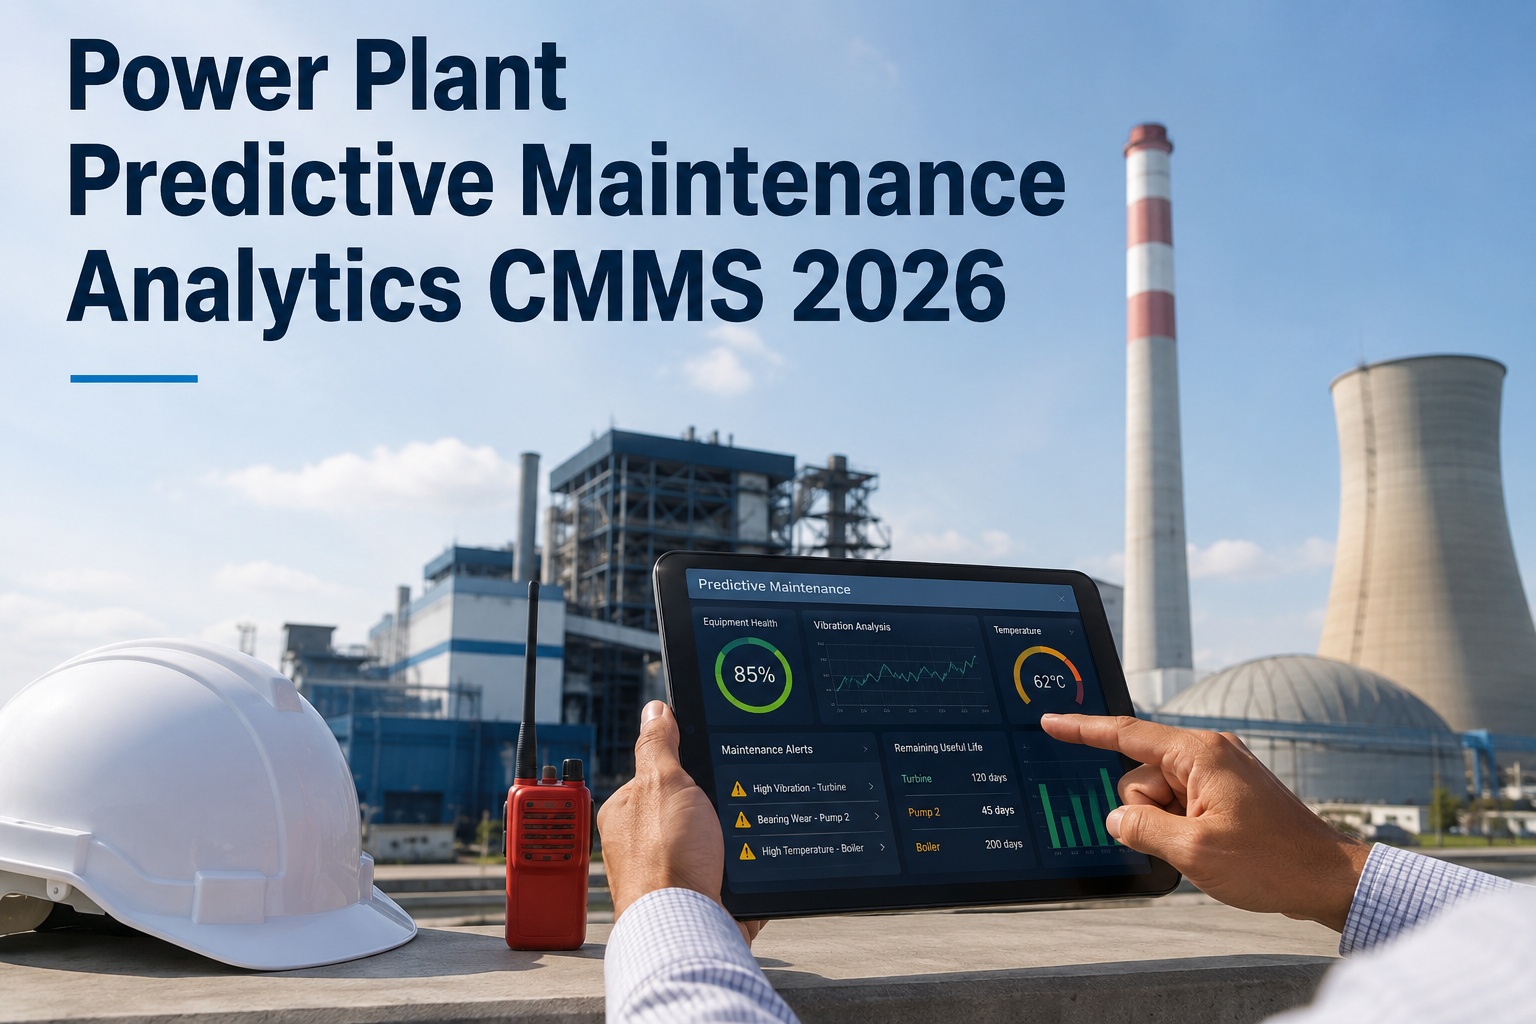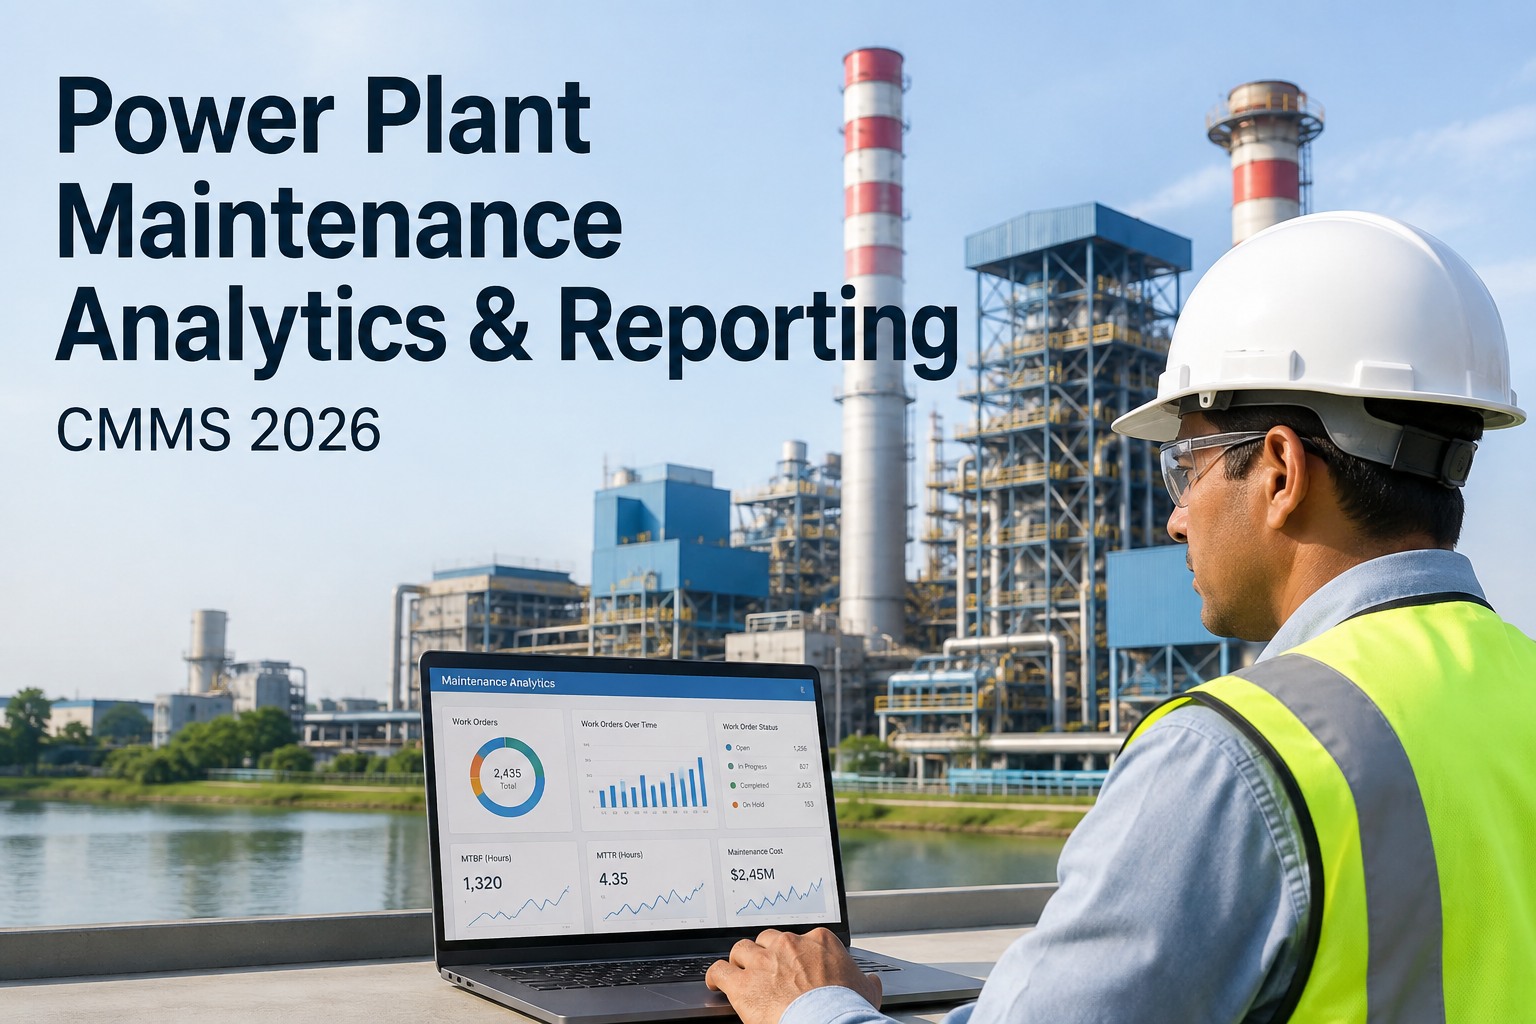
Power plant maintenance analytics and reporting in 2026 is the difference between a plant that runs at 95%+ availability and one that bleeds millions in forced outages — and a modern CMMS like OxMaint turns raw work-order data into the dashboards, KPI trends and heat-rate correlations that reliability teams actually need. With the right maintenance reporting, power generation operators can cut unplanned downtime 20–40%, track MTBF across critical assets, and prove compliance with NERC and ISO 55000 standards without scrambling through spreadsheets. This guide breaks down the metrics, formulas and reporting structures that move a power plant from reactive firefighting to predictive, data-driven maintenance. If you want to see it on your own assets first, Start Free Trial or read on.
Power Plant Maintenance Analytics & Reporting for 2026
Transform work orders, asset histories and inspection data into real-time dashboards that track forced outage rate, MTBF, maintenance cost per MWh and heat-rate correlation — so your reliability team can predict failures before they cost you a unit trip.
Why Power Plant Maintenance Analytics Can No Longer Be an Afterthought
The average forced outage in a 500 MW thermal unit costs $600K–$1.2M per day in lost revenue, replacement power and ramp-rate penalties. Yet most plants still rely on spreadsheet-based monthly reports that arrive two weeks after the failure already happened.
A 2023 EPRI study found that 25–30% of forced outages in fossil and nuclear plants are directly attributable to preventable equipment degradation — bearing wear, tube leaks, valve seat erosion — that proper maintenance data analytics would have flagged weeks ahead. Power plant reporting built inside a CMMS changes the equation: every work order, inspection reading and sensor trend becomes a structured data point that feeds live KPI dashboards instead of a dead-end spreadsheet.
The 5 KPIs Every Power Plant Maintenance Report Must Track in 2026
If your CMMS reporting does not surface these five metrics automatically, your team is flying blind between outages. Each one ties directly to plant availability, heat rate or maintenance budget.
Forced Outage Rate (FOR)
Target: under 2% for top-quartile plants. OxMaint tracks this per asset and rolls it up to unit and plant level on a live dashboard.
Mean Time Between Failures
A rising MTBF trend on BFPs, ID fans and condensate pumps indicates your preventive strategy is working. OxMaint calculates MTBF automatically per asset class.
Maintenance Cost per MWh
Benchmark: $4–$8/MWh for coal, $2–$5/MWh for CCGT. OxMaint ties every work-order cost to the generating asset for real-time cost-per-MWh reporting.
Heat Rate Deviation Correlation
Every 1% heat rate degradation can cost a 500 MW unit $1.5M+/year in extra fuel. OxMaint correlates maintenance events with heat-rate trends to pinpoint which degradations are maintenance-driven.
Schedule Compliance Rate
Below 85% schedule compliance is a red flag that your PM program is slipping — the leading indicator of future forced outages. OxMaint flags overdue PMs in real time.
Real-World Scenario: A 180-Asset Combined-Cycle Plant Cuts Forced Outages 32%
Consider a 420 MW combined-cycle plant spending $7.6M/year on maintenance across 180 tagged assets — gas turbine, HRSG, steam turbine, BOP — still running on Excel logs and a legacy CMMS with no analytics module.
Baseline & Data Migration
Asset hierarchy imported into OxMaint, 3 years of historical work orders cleaned and tagged. Baseline FOR measured at 5.4%, schedule compliance at 71%, MTBF on critical pumps at 890 hours.
Predictive Analytics Activation
Vibration and oil-analysis sensors integrated. OxMaint's AI models identify 14 assets with degradation signatures — including two boiler feed pumps flagged 22 days before projected failure.
PM Optimization & Reporting Rollout
PM intervals optimized based on failure data. Live dashboards deployed to control room and reliability team. Schedule compliance rises to 93%, MTBF on BFPs improves to 1,540 hours.
Measured Results
Forced outage rate drops from 5.4% to 3.7% (32% reduction). Avoided downtime value: $2.1M. Maintenance cost per MWh drops from $6.10 to $4.85. Payback on OxMaint subscription: under 4 months.
How OxMaint Delivers Power Plant Maintenance Analytics That Actually Drive Action
OxMaint was built for maintenance and reliability teams in power generation who need more than a digital filing cabinet — they need analytics that predict failures, justify budgets and prove compliance.
Live KPI Dashboards
Real-time FOR, MTBF, schedule compliance and cost-per-MWh dashboards that refresh as work orders close — no more waiting for end-of-month spreadsheet reports. Outcome: cut reporting lag from 14 days to zero.
AI-Driven Predictive Alerts
Machine-learning models analyze vibration, temperature and oil-analysis trends alongside work-order history to flag degradation signatures before failure. Outcome: predict 70%+ of critical failures 10–30 days ahead.
Automated Compliance Reporting
NERC PRC-005, ISO 55000 and internal audit reports generated automatically from work-order and inspection data — ready for review in one click. Outcome: cut audit prep time by 80%, eliminate findings gaps.
Spare-Parts & Inventory Analytics
Correlate parts usage with asset failure patterns to optimize stock levels, reduce carrying costs and eliminate stockouts on critical spares. Outcome: 25–35% reduction in inventory holding costs.
CMMS Analytics Power Plant: What Good Looks Like vs. Status Quo
Most plants know their reporting is broken but do not have a clear picture of what a modern CMMS analytics capability looks like side by side. Here is the gap.
| Capability | Spreadsheets / Legacy CMMS | OxMaint Analytics |
|---|---|---|
| Reporting cadence | Monthly, manual, 2-week lag | Real-time, auto-refreshed dashboards |
| Forced outage tracking | Calculated manually after the fact | Live FOR per asset, unit and plant |
| Predictive capability | None — reactive only | AI models flag 70%+ of failures 10–30 days ahead |
| Heat-rate correlation | Not connected to maintenance data | Maintenance events overlaid on heat-rate trends |
| Compliance reporting | Days of manual compilation | One-click NERC / ISO 55000 audit reports |
| MTBF / MTTR tracking | Estimated, inconsistent | Auto-calculated per asset class with trend lines |
| Cost-per-MWh visibility | Quarterly, approximate | Real-time, tied to every work-order cost |
See OxMaint Analytics on Your Plant's Own Assets
Book a 30-minute demo and we'll connect your sample data to show you live forced-outage tracking, MTBF trends and predictive alerts — before you commit to anything.
Power Plant Maintenance Analytics & Reporting: Frequently Asked Questions
What is power plant maintenance analytics and why does it matter in 2026?
Power plant maintenance analytics is the practice of using CMMS data — work orders, asset histories, sensor readings and inspection results — to track KPIs like forced outage rate, MTBF and maintenance cost per MWh in real time. In 2026 it matters because grid margins are tightening, renewable penetration is raising ramp-cycle stress on thermal units, and regulators expect audit-ready documentation. Plants without analytics are operating blind between outages and typically spend 20–40% more on unplanned repairs than those with predictive CMMS reporting.
Which CMMS reporting metrics are most important for a power plant?
The five most critical metrics are Forced Outage Rate (target under 2%), MTBF (trending up), Maintenance Cost per MWh ($2–$8 depending on generation type), Schedule Compliance Rate (above 90%) and Heat Rate Deviation correlated with maintenance events. OxMaint tracks all five automatically and surfaces them on role-based dashboards for plant managers, reliability engineers and maintenance planners. You can see these dashboards live by booking a demo at calendly.com/oxmaintapp/30min.
How does predictive maintenance analytics reduce forced outages in power plants?
Predictive analytics uses machine-learning models to analyze vibration, temperature, oil-analysis and work-order history trends, identifying degradation signatures 10–30 days before a failure would normally occur. This allows maintenance to be scheduled during planned outages or low-demand periods instead of triggering a forced outage. Plants using OxMaint's predictive analytics typically see a 25–40% reduction in unplanned downtime within the first 12 months.
How long does it take to implement CMMS analytics in a power plant?
A typical 200-asset power plant can be fully live on OxMaint in 4–8 weeks, including asset hierarchy import, historical work-order migration, sensor integration and dashboard configuration. The fastest deployments take 2–3 weeks when asset data is already structured. ROI is typically realized within 3–6 months as forced outage reductions and PM optimization compound. You can start a free 14-day trial at app.oxmaint.ai to test the platform with your own data.
Can OxMaint generate NERC and ISO 55000 compliance reports automatically?
Yes. OxMaint tags every work order, inspection and test record with the relevant compliance standard — NERC PRC-005 for protection system maintenance, ISO 55000 for asset management, and plant-specific internal audit codes. Audit-ready reports are generated in one click, pulling from the same structured data that feeds your operational dashboards. This typically cuts compliance report preparation time by 80% and eliminates the documentation gaps that lead to audit findings.
Stop Reporting on Failures. Start Preventing Them.
Join the power generation teams using OxMaint to cut forced outages 25–40%, prove compliance in one click and move from reactive firefighting to predictive reliability.
Free 14-day trial · No credit card