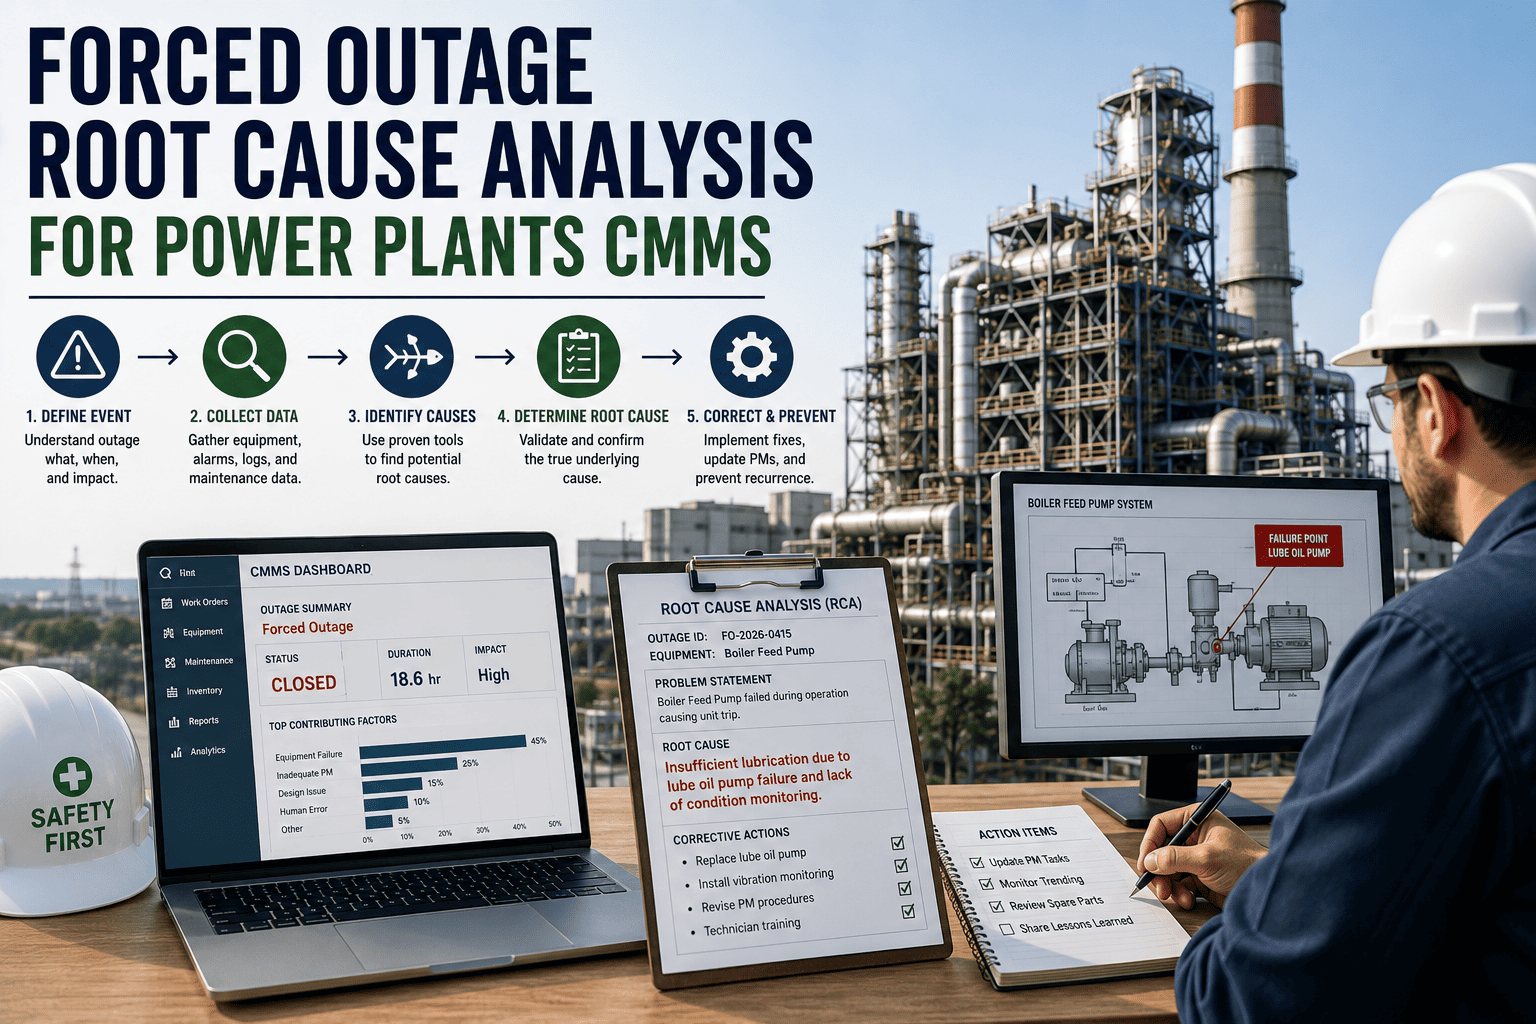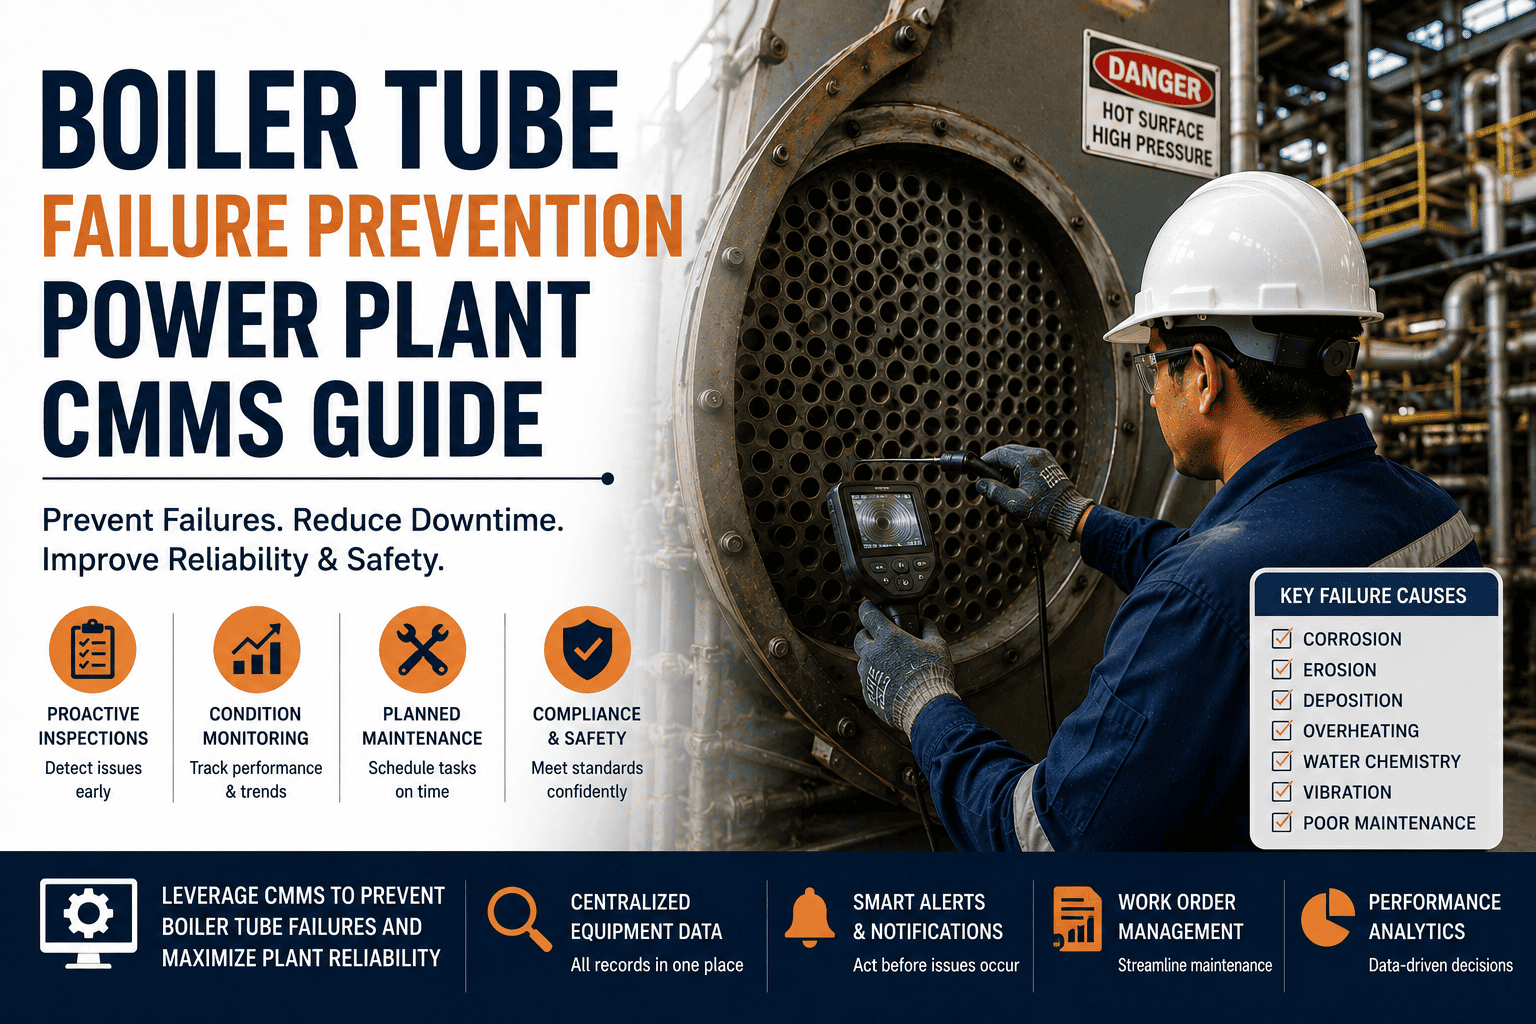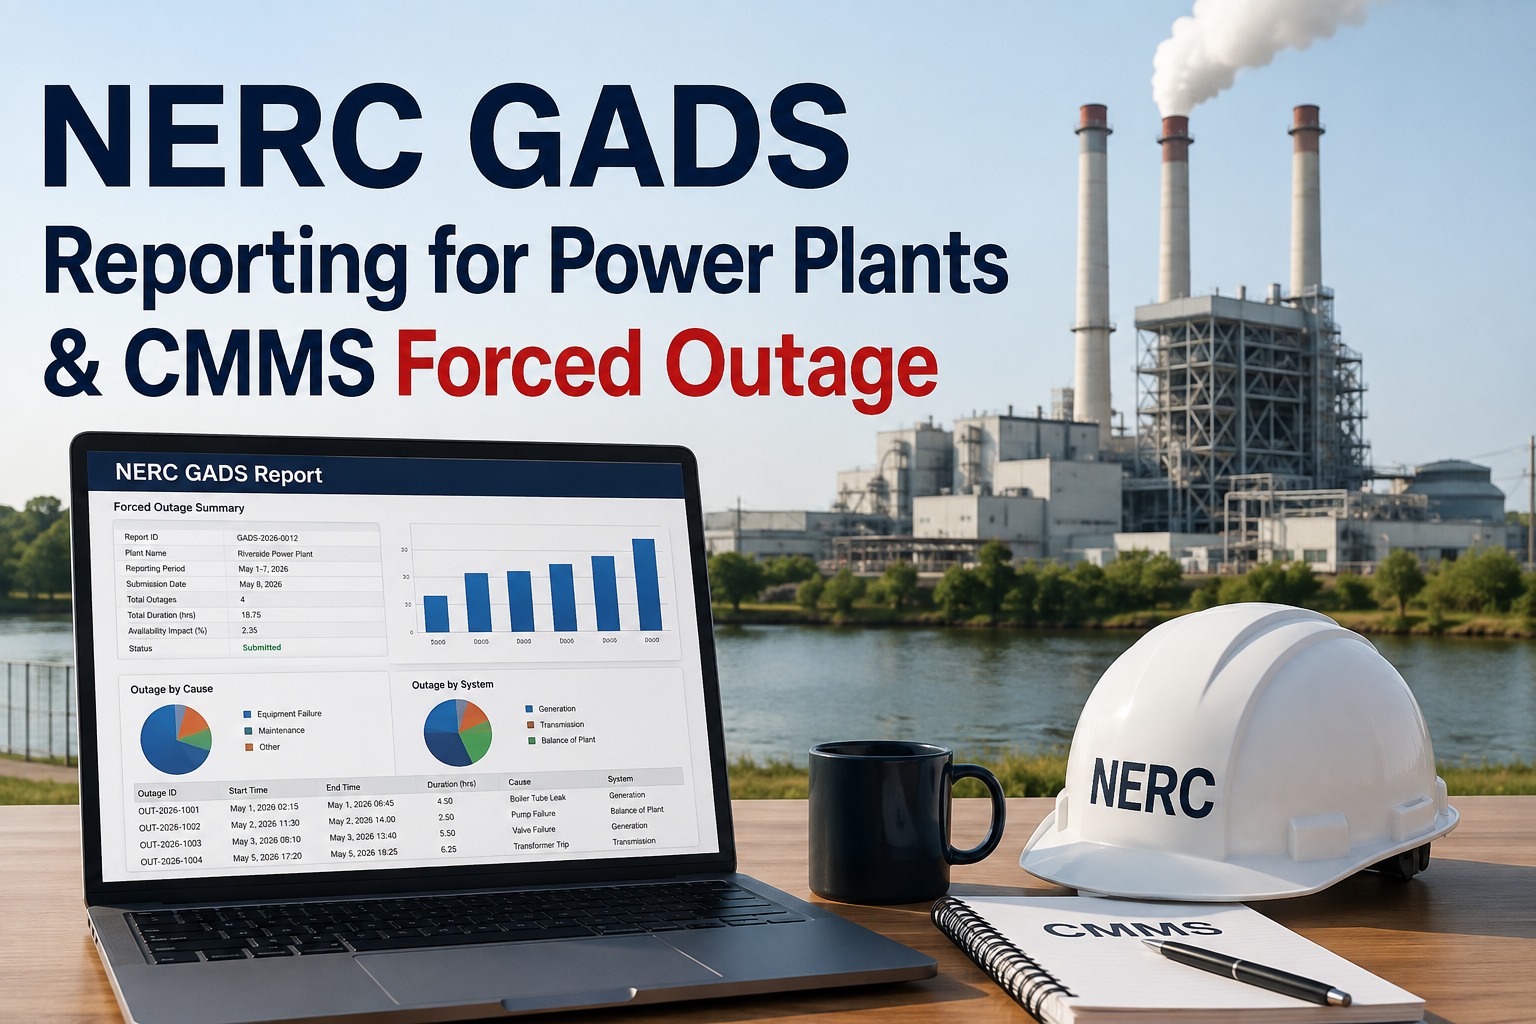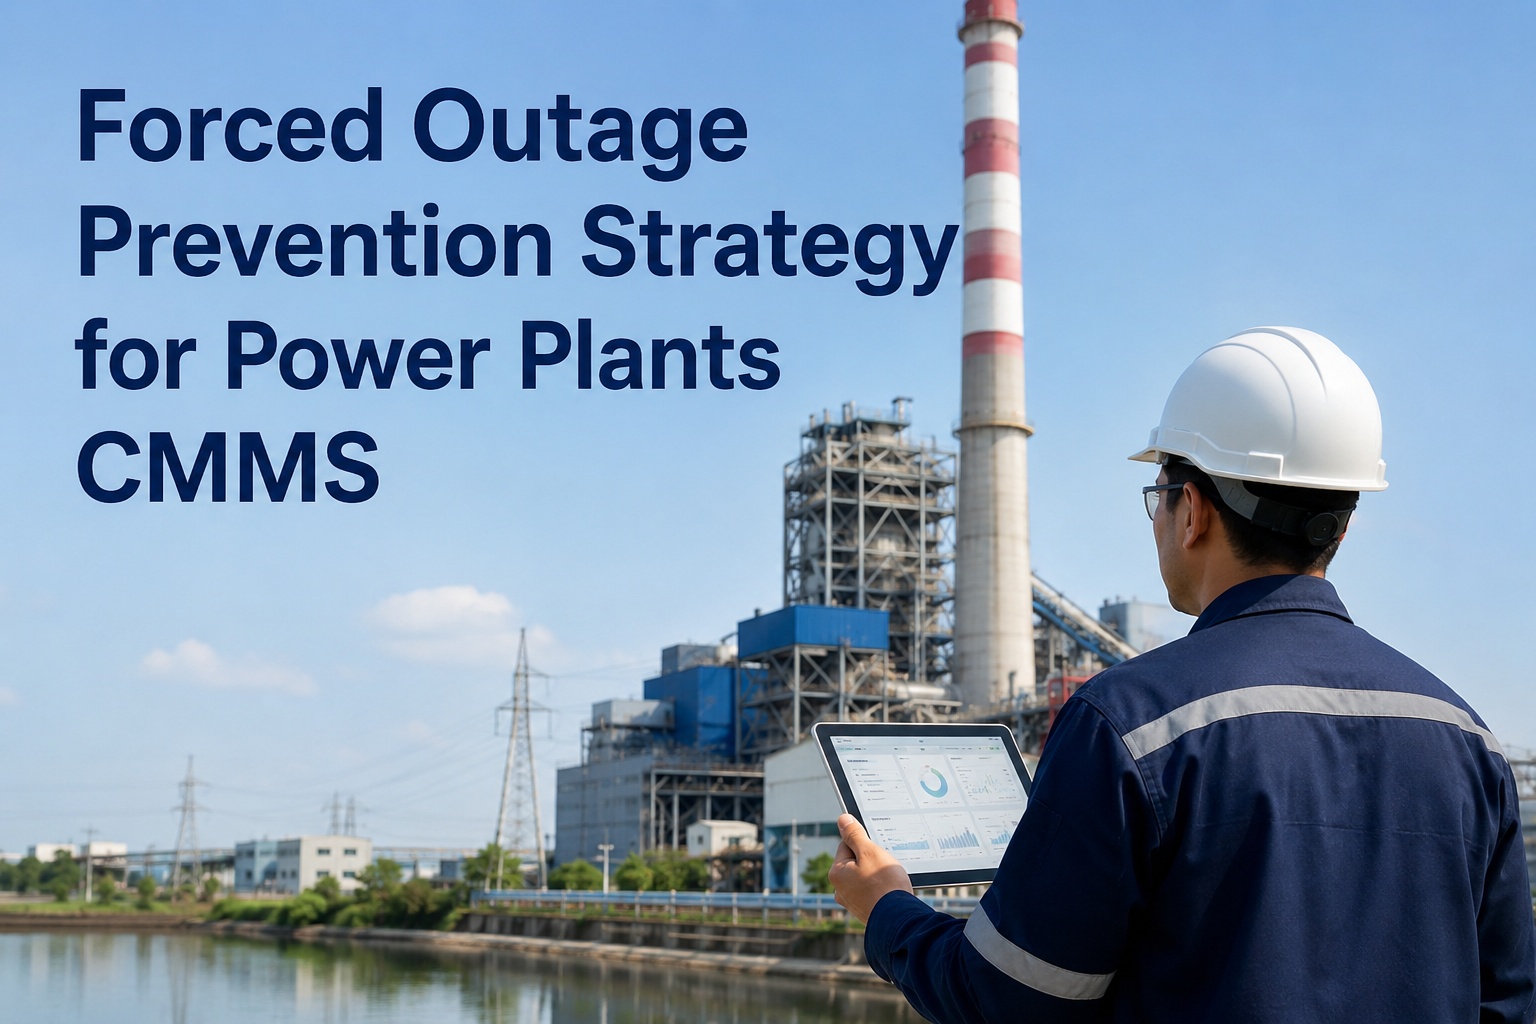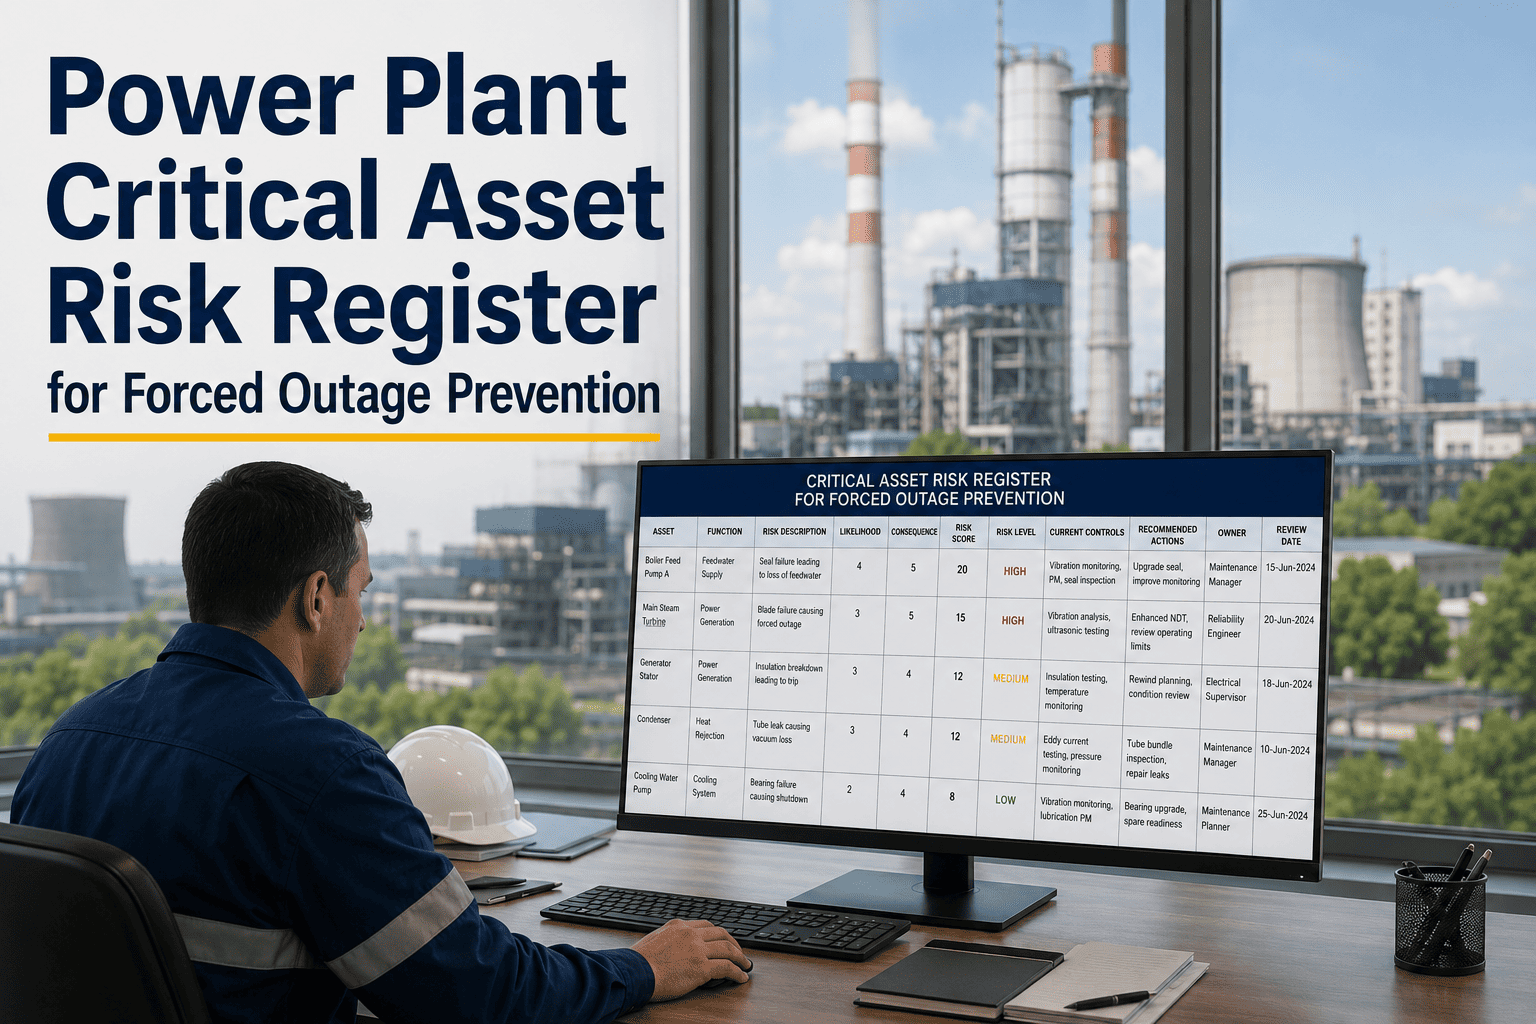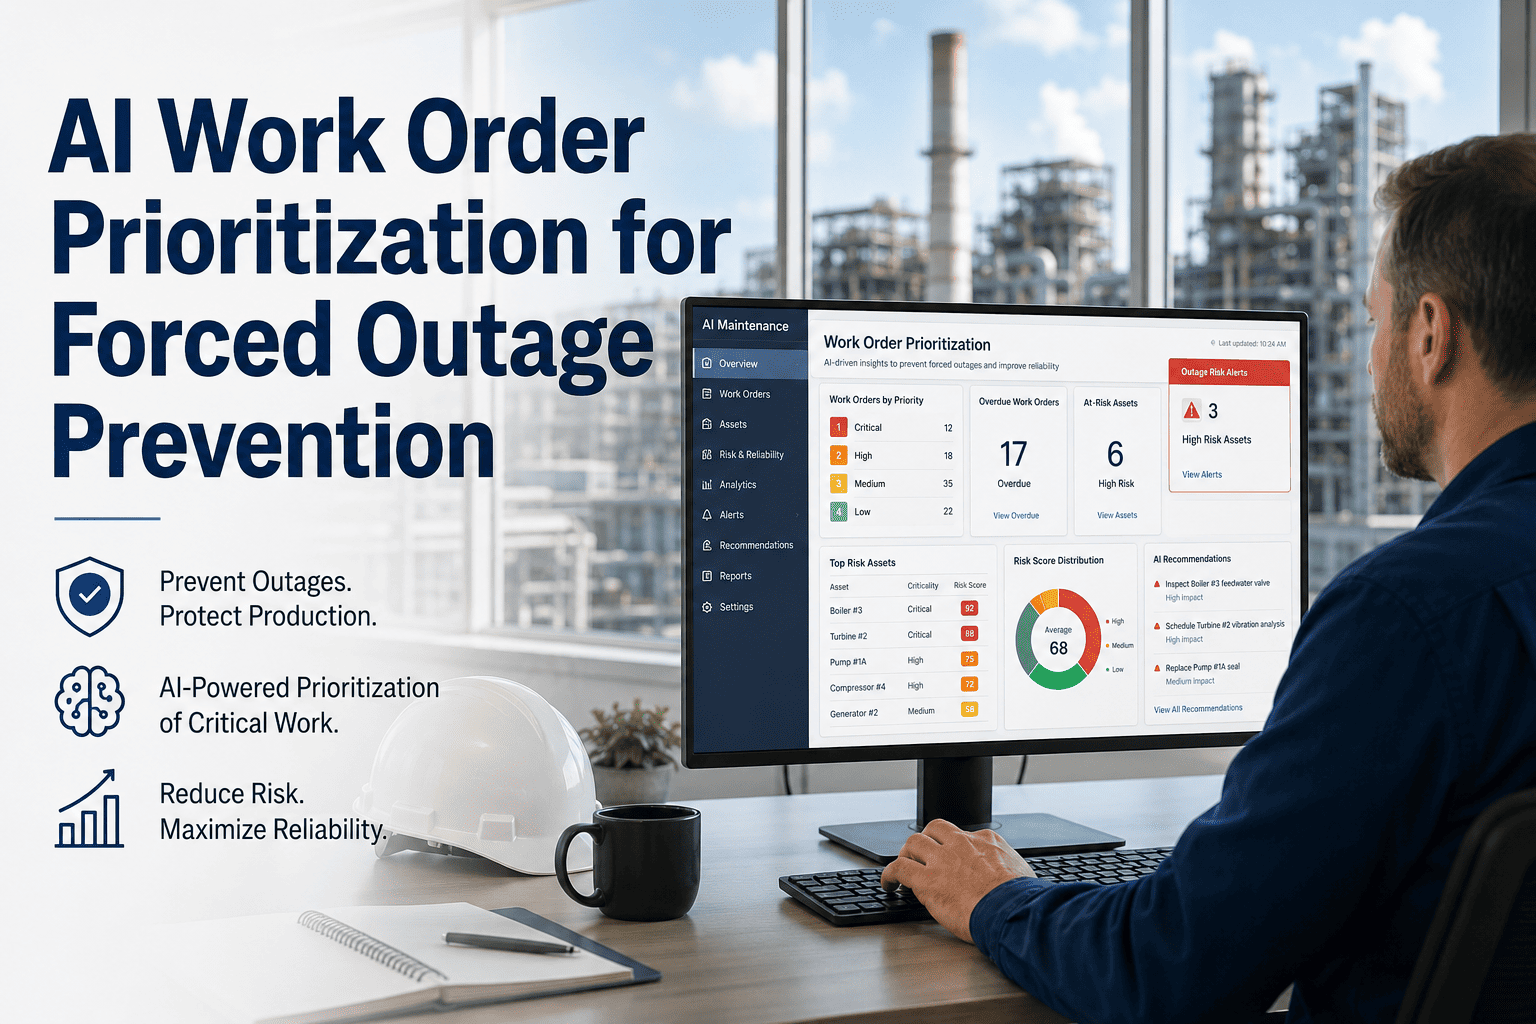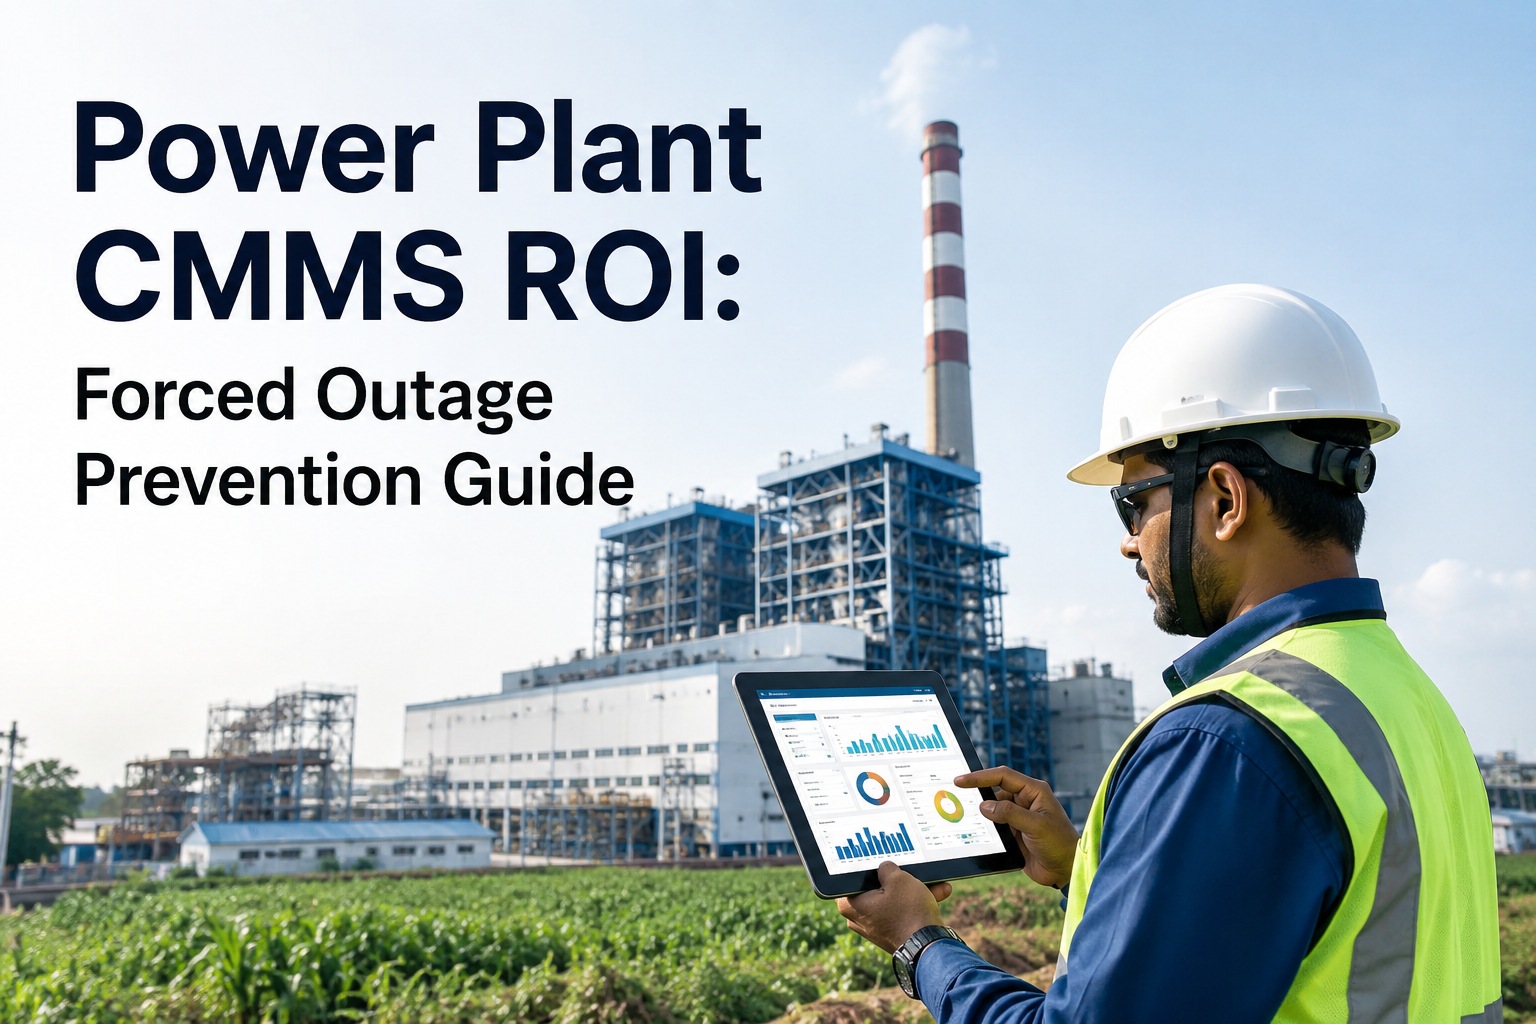
Forced outages at a 500 MW thermal unit can burn $1–3 million per day in lost gross margin, replacement power, and contractual penalties — yet most maintenance managers are still asked to justify CMMS spend with soft productivity claims. This page builds a hard-number ROI model around forced outage prevention: avoided-outage value, insurance premium reduction, outage-duration compression, and labor efficiency, combined into a single payback figure finance will approve. Model your own plant's numbers with a free OxMaint trial, or book a demo and we'll build the business case alongside you.
Power Plant CMMS ROI: Forced Outage Prevention Guide 2026
Translate predictive maintenance and outage-prevention capability into a defensible capital business case — avoided forced-outage cost, insurance premium reduction, outage-duration compression, and labor efficiency, rolled into one payback figure your CFO will sign.
Calculate the avoided-cost value of each prevented forced outage
Finance accepts avoided cost far more readily than "improved uptime." The model below isolates the value of a single forced outage that a predictive program catches before failure — the core of any power plant CMMS ROI calculation.
| Failure mode (example) | Typical forced duration | Lost margin (500 MW CC) | Replacement power | Penalty + startup | Avoided value |
|---|---|---|---|---|---|
| GT compressor fouling → tripping blade failure | 4 days | $4.8M | $1.1M | $0.6M | $6.5M |
| ST turbine bearing seizure (oil degradation) | 7 days | $8.4M | $2.0M | $0.9M | $11.3M |
| Boiler feed-pump seal failure → derate | 2 days | $2.4M | $0.5M | $0.3M | $3.2M |
| Condenser tube leak (chloride ingress) | 3 days | $3.6M | $0.8M | $0.4M | $4.8M |
Turn documented predictive maintenance into a negotiable premium credit
Property and machinery-breakdown underwriters price the risk of large unanticipated losses. A CMMS that produces auditable PdM records — vibration trends, oil analysis, thermography, OEM interval compliance — is exactly the evidence they discount for.
Produce the evidence underwriters want
Export 12-month trend histories for rotating equipment, oil-sample chains of custody, thermography reports, and completed work-order logs tied to OEM intervals. OxMaint's audit-ready exports are formatted for underwriter submission.
Quantify the risk reduction
Show year-over-year reduction in unplanned downtime hours and corrective work orders. A 30% drop in unplanned events is a credible basis for an 8–15% premium credit on machinery-breakdown and business-interruption lines.
Bring the number into the ROI model
Annual premium × credit % = year-1 cash saving. Renewal cycles vary, so phase it: 50% credit in year 1, full credit from year 2 onward once the underwriter has a full policy year of evidence.
| Coverage line | Typical annual premium (500 MW CC) | Credit range with documented PdM | Year-1 cash saving (mid-credit) |
|---|---|---|---|
| Machinery breakdown (MB) | $1.8M | 8–15% | $207K |
| Business interruption (BI) | $2.4M | 5–10% | $180K |
| Property all-risk | $1.1M | 3–6% | $49K |
| Total insurance-based cash saving (year 1, mid-credit) | $436K | ||
Shorter outages compound the savings — even when you can't prevent them
Not every outage is preventable. But planned-outage duration is directly controllable through parts readiness, contractor scheduling, and procedure compliance — and every day shaved off drops straight to the bottom line.
Parts & spares readiness
CMMS-tracked min/max and kitted work orders cut average wait-for-parts time from 1.8 days to under 0.4 days. Critical spares (turbine seals, pump impellers, valve internals) are pre-staged against scheduled work.
Contractor scheduling
Lock OEM field-service and specialty contractor windows 90 days out against the CMMS schedule. Eliminates the 2–4 day mobilization lag that typically extends a turbine major into a second week.
Procedure & safety compliance
Digitized JSAs, LOTO plans, and OEM procedures attached to every work order reduce rework and safety holds. Plants with fully digitized procedures report 12–18% duration compression on major overhauls.
Duration-to-completion tracking
Real-time dashboards flag slipping tasks before they extend the critical path. A 6-hour early warning on a condenser re-tubing task can save a full day of margin at the back end.
Combine avoided outages, insurance, and labor efficiency into one payback figure
Finance doesn't buy four separate arguments — they buy one number. The model below rolls every saving stream into a single year-1 ROI and payback month you can defend in a capital committee.
| ROI component | How it's calculated | Year-1 value (500 MW CC, illustrative) |
|---|---|---|
| Avoided forced outages | Prevented events/yr × AVO per event | $6.5M (1 event) – $19.5M (3 events) |
| Insurance premium reduction | Annual premium × negotiated credit % | $436K |
| Planned-outage duration compression | Days saved × daily margin + avoided contractor day-rate | $3.6M (1 major overhaul) |
| Labor efficiency | Reduced overtime + wrench-time improvement (15–22%) | $420K |
| Spares inventory optimization | Carrying-cost reduction on right-sized min/max | $180K |
| Total year-1 benefit (conservative — 1 prevented event) | $11.1M | |
| CMMS platform + implementation + first-year support | Software, integration, training, migration | $285K – $640K |
| Year-1 ROI (conservative) | 1,635% – 3,790% | |
| Payback period | ~11 months (often under 6 weeks after first prevented event) | |
Illustrative figures based on a 500 MW combined-cycle unit at $35/MWh spark spread and 90% availability. Replace every input with your plant's actuals — the model structure holds across thermal, hydro, and wind generation portfolios.
How to frame the ROI model so plant leadership and finance approve it
A defensible number is only half the battle. The way you package and present it determines whether the capital request clears committee or gets deferred to the next fiscal year.
Lead with avoided cost
- Open with the single largest prevented event in dollars — not with platform features.
- Anchor every number to a named failure mode (turbine bearing, feed-pump seal, condenser tube) so finance can stress-test it.
- Show the downside case: what happens to the P&L if the outage isn't prevented.
Lead with software features
- Don't open with dashboards, mobile apps, or AI — finance doesn't buy features, they buy risk reduction.
- Don't use industry-average uptime percentages; use your plant's actual rolling 3-year forced-outage rate.
- Don't hide the implementation cost; surface it early and pair it with the payback month.
Build the baseline
Pull 3 years of forced-outage hours, corrective work orders, insurance premiums, and contractor spend. This is your "do-nothing" case.
Identify preventable events
Tag each historical outage as preventable, partially preventable, or non-preventable. Focus the ROI model on the first two categories only — credibility depends on not overclaiming.
Quantify each saving stream
Run the AVO formula, the insurance credit, the duration compression, and the labor efficiency separately. Document the source for every input.
Stress-test the totals
Present a conservative, base, and optimistic case. Finance will trust the base case more if they can see the assumptions that move it up or down.
Close with payback and risk
End on payback period and the cost of inaction. "11-month payback, $6.5M downside exposure per unprevented turbine event" is a sentence that clears committee.
Power plant CMMS ROI — questions finance committees ask
How do we defend the "prevented outages" number if finance calls it speculative?
Anchor it to historical failure modes your plant has actually experienced, not industry averages. For each preventable event, cite the specific predictive technology (vibration trend, oil analysis, thermography) that would have caught it, and reference the EPRI 27% preventability benchmark as an upper bound. Present a conservative case (1 prevented event/year) alongside the base case so finance can choose their comfort level.
Can we really negotiate an insurance premium reduction just for having a CMMS?
Not for the software alone — for the documented predictive maintenance program it enables. Underwriters discount for auditable evidence: 12 months of trend data, completed OEM-interval work orders, and a measurable reduction in unplanned events. Plants typically see 8–15% credits on machinery-breakdown and 5–10% on business-interruption lines once a full policy year of PdM evidence is on file.
What's a realistic payback period for a power plant CMMS deployment?
For a mid-size thermal plant deploying around forced-outage prevention, 11 months is typical — and often under 6 weeks if the first prevented event occurs soon after go-live. The payback is dominated by avoided outage cost, not by labor efficiency, so the faster your predictive program matures, the faster the payback.
How does OxMaint specifically support the ROI model on this page?
OxMaint provides the predictive maintenance workflows (vibration, oil, thermography integration), OEM-interval compliance tracking, audit-ready exports for underwriter submission, contractor and parts scheduling for outage compression, and the dashboards that document year-over-year risk reduction. The platform is built to produce the evidence each ROI component requires — not just to manage work orders.
Should we include hydro and wind assets in the same ROI model, or model them separately?
Model them separately by failure-mode family, then roll up to a portfolio total. Hydro forced-outage economics differ from thermal (lower margin per MWh but very high remediation cost on runner/penstock failures), and wind ROI is driven by gearbox and blade-event avoidance across a distributed fleet. The AVO formula structure is identical; the inputs change.
Model your plant's forced-outage ROI in OxMaint
Load your last 3 years of outage data, tag the preventable events, and the platform will produce the avoided-cost, insurance, and payback figures your finance committee is asking for — in hours, not weeks.