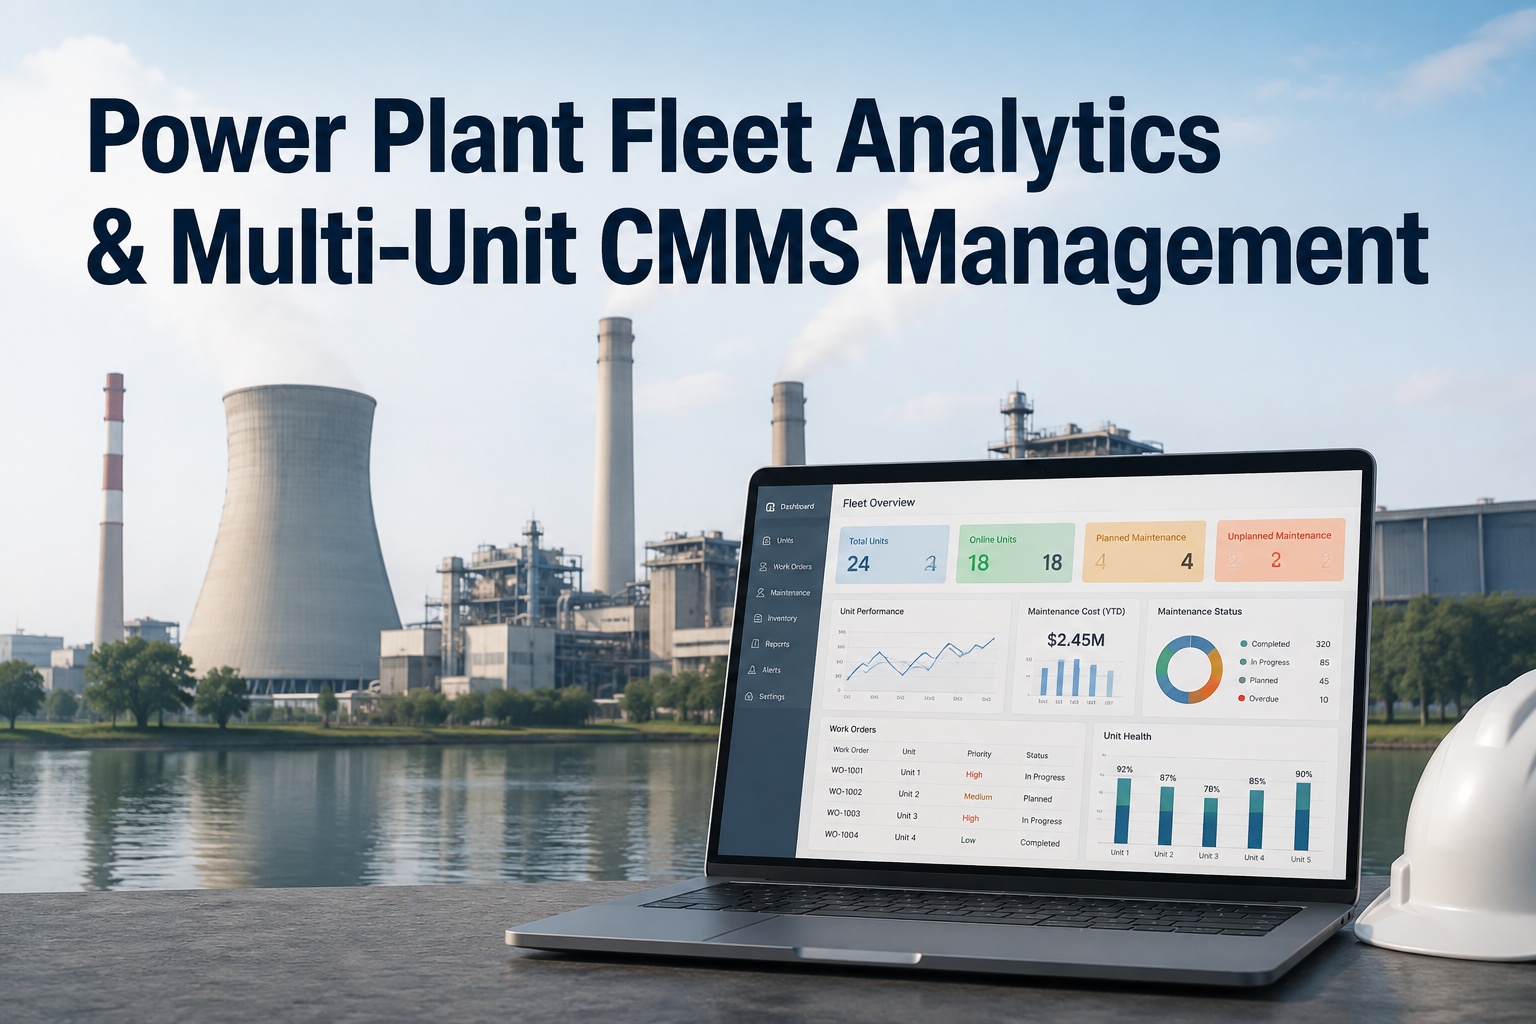
Power plant fleet analytics transforms how multi-unit operators manage maintenance across geographically dispersed generation assets — turning siloed plant-level data into cross-plant benchmarking, fleet health scores, and comparative outage analysis that drive measurable availability gains. A multi-unit CMMS built for power plants consolidates work orders, preventive and predictive maintenance, spare-parts inventory, and equipment tracking into a single pane of glass, so reliability teams can spot underperforming units in days rather than quarters. Whether you operate two gas peakers or a dozen combined-cycle blocks, fleet-level visibility is the difference between reacting to failures and preventing them. Explore OxMaint's multi-plant capabilities when you Start Free Trial or book a personalized walkthrough with our team.
Power Plant Fleet Analytics Guide
Are you managing your power plant fleet — or just counting the outages as they happen?
Operators running 5+ generation units without a unified CMMS lose 8–12% in equivalent availability every year to reactive maintenance, duplicated effort, and blind spots between plants. Fleet analytics closes that gap with cross-plant benchmarking, predictive failure flags, and a single live fleet health score.
The Fleet Analytics Imperative
Why power plant fleet analytics beats plant-by-plant CMMS management
A 2023 industry benchmark found that multi-unit power operators using isolated CMMS instances per plant spend 40% more on unplanned repairs and experience 2.3x longer mean-time-to-repair than peers with centralized fleet analytics. The reason is structural: when each plant is a data island, best practices stay local, critical spare parts are duplicated or unavailable, and comparative performance is invisible until quarterly reviews — long after a preventable outage has already cost millions in lost generation revenue.
Power plant fleet management consolidates asset hierarchies, work-order histories, condition-monitoring feeds, and inventory levels across every unit in your fleet. With that unified dataset, reliability engineers can calculate a normalized fleet health score, rank units by risk, and dispatch preventive work orders to the assets that need them most — before a forced outage removes megawatts from the grid. The result is a measurable shift from fire-fighting to planned, optimized maintenance execution.
Multi-Unit CMMS Architecture
How multi-unit power plant CMMS architecture scales across your fleet
The transition from single-plant CMMS to a true multi-plant CMMS is not just a licensing change — it requires a hierarchical asset model, role-based access by site, and centralized reporting with drill-down to individual work orders. Below is the standard architecture that high-performing fleets adopt when implementing CMMS multi-unit deployment for power generation.
Unify Asset Hierarchies
Standardize systems, asset types, and failure codes across all units so that a boiler feed pump at Plant A can be benchmarked against its twin at Plant B. OxMaint's EAM model supports ISO 14224 failure coding for consistent cross-plant comparison.
Centralize Work Order Execution
Route preventive, corrective, and predictive work orders from a single platform while keeping site-level execution control. Mobile crews see only their assigned tasks, but fleet managers see the full backlog in real time.
Aggregate Condition Data
Feed SCADA alarms, vibration trends, oil analysis results, and IoT sensor data into one analytics layer. AI models then flag anomalies at the asset level and roll them up into a fleet health score updated every 15 minutes.
Benchmark & Optimize
Compare equivalent availability, forced outage rate, MTBF, and maintenance cost per MWh across units. Identify bottom-quartile performers and replicate top-quartile maintenance strategies fleet-wide in weeks, not years.
Cross-Plant Analytics & Benchmarking
Fleet health scores and cross-plant analytics: what to measure
A fleet health score is a composite index — typically 0 to 100 — that rolls up asset condition, backlog aging, PM compliance, and predictive risk flags into a single number per unit. Leading power plant operators refresh this score daily and set thresholds that trigger automatic review when any unit drops below 70. The table below maps the core KPIs every multi-unit CMMS for power plants should track.
| Fleet KPI | What It Measures | Target Benchmark | Cross-Plant Action |
|---|---|---|---|
| Fleet Health Score | Composite of condition, backlog, PM compliance, AI risk | > 80 / 100 | Auto-flag units below threshold for reliability review |
| Equivalent Availability Factor | Maximum possible generation vs actual, accounting for outages | > 92% | Compare top vs bottom quartile; replicate PM strategies |
| Forced Outage Rate | Unplanned outage hours as % of available hours | < 3% | Root-cause across fleet; target predictive intervention |
| PM Compliance Rate | Scheduled PMs completed on time vs scheduled | > 95% | Reallocate crew resources from overstaffed to understaffed units |
| Maintenance Cost / MWh | Total O&M maintenance spend per megawatt-hour generated | Bottom quartile of peer group | Identify cost outliers; audit spare-parts usage and labor allocation |
| MTBF (Critical Assets) | Mean time between failures for top 20 critical assets per unit | +15% YoY improvement | Standardize failure coding; share RCA learnings across fleet |
Comparative Outage Analysis
Comparative outage analysis: cutting forced-outage losses across units
Consider a real-world scenario: a regional generation owner operating six gas-fired combined-cycle blocks (total 3.2 GW) was experiencing forced outages on HRSG feedwater pumps at three different plants within a single quarter. Each outage averaged 19 hours and cost approximately $340,000 in lost generation and emergency repair. Because each plant maintained its own CMMS, nobody connected the failure pattern until a reliability engineer manually exported and compared work-order histories in a spreadsheet — three weeks after the third failure.
Cost of Delayed Cross-Plant Detection
3 forced outages × 19 hrs × $18,000/MWh lost margin + $48,000 emergency repairs = $1,026,000 in a single quarter — preventable with fleet-level anomaly detection
With a power plant fleet CMMS like OxMaint, the feedwater pump vibration trend from Plant A would have been automatically compared against the same asset class at Plants B through F. When the anomaly appeared at Plant C, the system would have flagged it as a repeat of the failure mode seen at Plant A three weeks earlier — generating a predictive work order to inspect and replace the bearing during the next planned ramp-down, before a forced outage removed 530 MW from the grid.
Early Anomaly Detection
AI models trained on fleet-wide data detect bearing, vibration, and temperature anomalies 10–21 days before failure, enabling planned intervention.
Shared Failure Libraries
A single failure-code library (ISO 14224) means a root-cause analysis at one unit instantly informs maintenance strategies at every comparable asset fleet-wide.
Pooled Spare-Parts Pool
Multi-plant inventory visibility eliminates duplicate stocking and reduces critical-spare lead times by 35–60% through cross-plant transfers instead of emergency procurement.
Live Outage Dashboards
Fleet outage boards show every active, planned, and at-risk outage across all units, with cost-impact estimates updated in real time for executive visibility.
How OxMaint Helps
How OxMaint powers multi-unit power plant fleet management
OxMaint is an AI-powered CMMS and EAM platform purpose-built for maintenance and reliability teams managing complex asset fleets. For power generators, it delivers the cross-plant analytics, predictive maintenance, and multi-unit work-order control that spreadsheet-based and single-plant systems simply cannot provide. Here is how OxMaint maps to the specific needs of power plant fleet operators:
Multi-Plant Asset Hierarchy
Model every unit, system, and component under a single fleet-wide hierarchy with site-level permissions. Benchmark identical assets across plants and roll up health scores from component to fleet level. Outcome: identify bottom-quartile units in minutes, not quarterly reviews.
AI-Powered Predictive Maintenance
Machine-learning models analyze vibration, temperature, oil quality, and SCADA trends across all units to predict failures 10–21 days in advance. Auto-generate work orders when risk thresholds are crossed. Outcome: cut unplanned downtime 30–50% by catching failures before they force outages.
Cross-Plant Inventory Pooling
See spare-parts stock levels across every plant warehouse in real time. Auto-suggest cross-plant transfers before emergency procurement, and set fleet-wide min/max levels by criticality. Outcome: reduce critical-spare inventory holding costs 20–35% while improving parts availability.
Fleet Analytics & NERC Compliance
Pre-built dashboards for equivalent availability, forced outage rate, PM compliance, and maintenance cost per MWh — with audit-ready work-order trails supporting NERC PRC-005 and ISO 55000 alignment. Outcome: pass compliance audits in hours, not weeks, with zero spreadsheet reconciliation.
Real-World Impact
What power plant operators achieve with fleet-level CMMS analytics
"We managed 4 combined-cycle blocks on four separate CMMS instances. Consolidating onto OxMaint's multi-unit platform gave us a live fleet health score and cut our forced outage rate from 4.1% to 1.8% in the first year. The predictive alerts on our BFB pumps alone paid for the platform."
"Cross-plant benchmarking was the game-changer. We discovered that Plant 3 was spending 40% more on boiler maintenance than Plant 1 for identical availability. Standardizing PM strategies across the fleet saved $2.8M in the first 18 months. Switching from spreadsheets took three weeks."
See OxMaint on your assets — book a 30-minute fleet demo
Walk through a live multi-unit power plant CMMS dashboard. See how cross-plant analytics, predictive work orders, and fleet health scoring work on assets like yours — no slides, just the platform.
Frequently Asked Questions
Power plant fleet analytics & multi-unit CMMS — your questions answered
What is a power plant fleet health score and how is it calculated?
A fleet health score is a composite index from 0 to 100 that combines asset condition data, PM compliance rates, backlog aging, and AI-predicted failure risk into a single number per generation unit. OxMaint calculates it by weighting real-time sensor anomalies (40%), overdue preventive maintenance (25%), work-order backlog age (20%), and historical failure patterns (15%), refreshing every 15 minutes. Units scoring below 70 trigger automatic reliability reviews.
How does a multi-unit CMMS differ from a standard CMMS for a single power plant?
A multi-unit CMMS supports a hierarchical asset model spanning multiple generation sites under one platform, with role-based access controls, centralized reporting, and cross-plant inventory visibility. Standard single-plant CMMS platforms cannot benchmark assets between sites, share failure-code libraries, or pool spare parts — capabilities that are essential for power fleet management. You can see the difference live by scheduling a demo at calendly.com/oxmaintapp/30min.
How long does it take to deploy a multi-plant CMMS across a power generation fleet?
For a fleet of 3–6 units, typical deployment takes 6–10 weeks: 2 weeks for asset hierarchy standardization, 3–4 weeks for data migration from existing CMMS or spreadsheets, and 2–4 weeks for crew training and PM schedule migration. OxMaint's AI-assisted onboarding accelerates this by auto-mapping existing asset data and suggesting failure codes, cutting migration time by up to 50%. Start your deployment with a free trial at app.oxmaint.ai.
Can fleet analytics integrate with our existing SCADA and condition-monitoring systems?
Yes. OxMaint connects to major SCADA platforms (OSIsoft PI, AVEVA, GE Mark VIe), vibration monitoring systems (SKF, Bently Nevada), and IoT sensor gateways via REST APIs, MQTT, or OPC-UA. Condition data flows into the analytics layer in near real time, feeding predictive models and the fleet health score without manual data entry or spreadsheet exports.
What ROI can a power plant expect from implementing cross-plant analytics and multi-unit CMMS?
Most multi-unit power operators achieve payback within 12–18 months. Typical gains include a 14% availability improvement, 30–50% reduction in unplanned downtime, 20–35% lower spare-parts holding costs, and 40% less overtime spend on emergency repairs. A 1 GW fleet saving just 1% in equivalent availability translates to approximately $2.5–4M annually in additional generation margin, depending on market pricing and dispatch frequency.
Stop managing your power plant fleet plant-by-plant
Deploy a multi-unit CMMS with fleet analytics, predictive maintenance, and cross-plant benchmarking. See your fleet health score on day one — and start cutting forced outages within the first quarter.
Free 14-day trial · No credit card