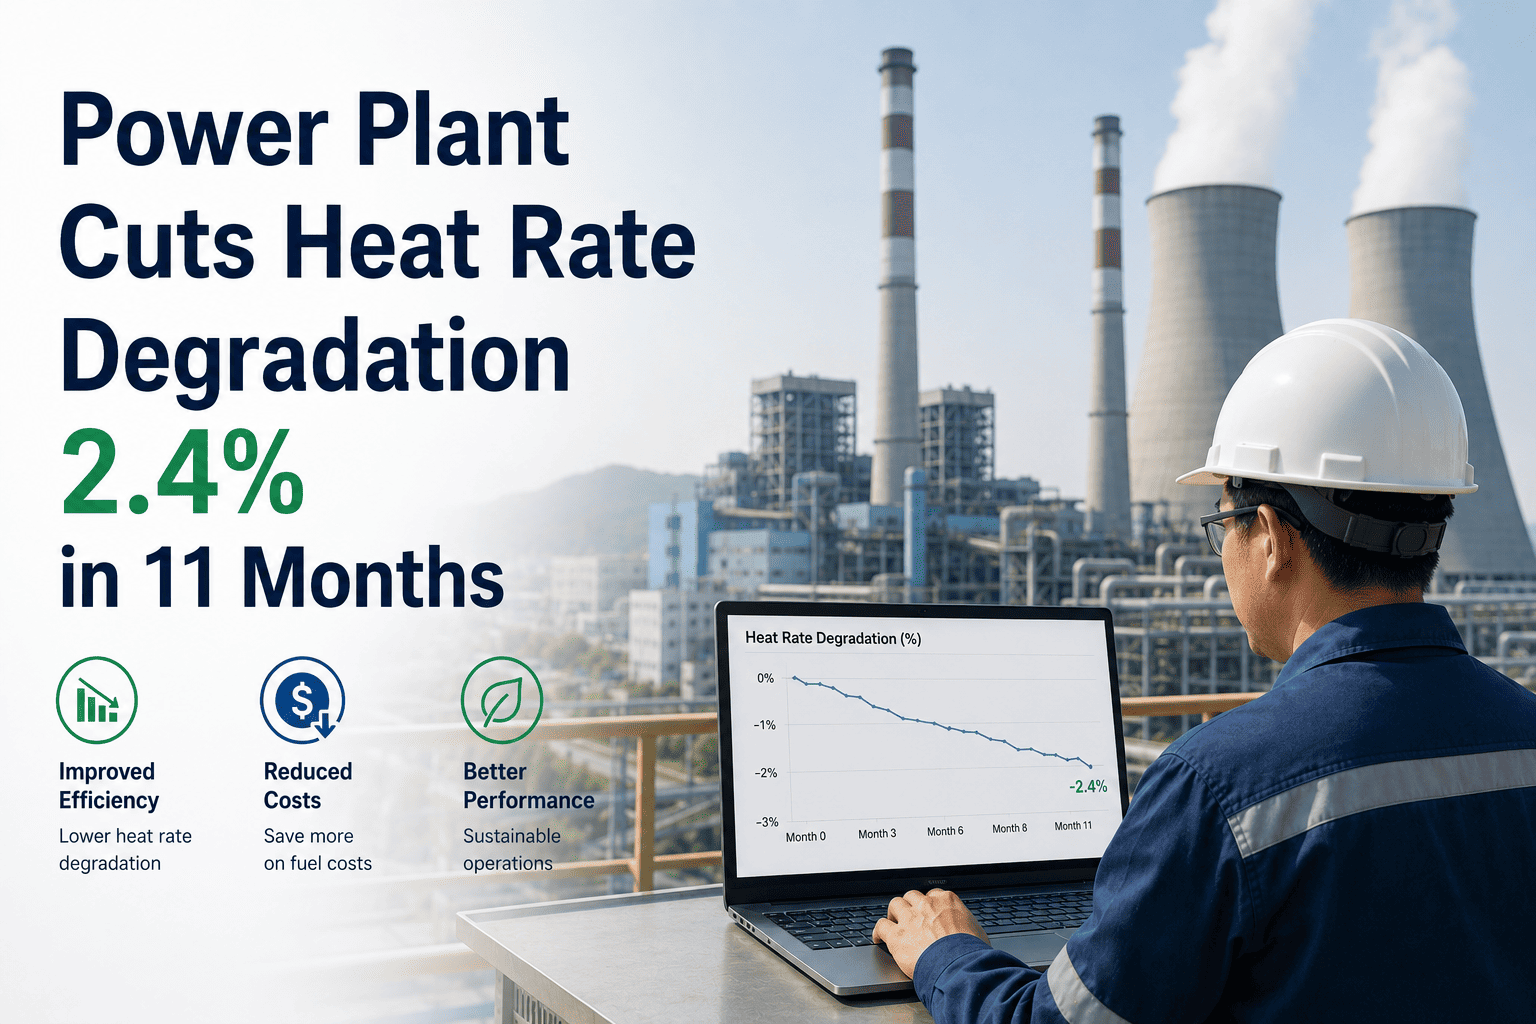
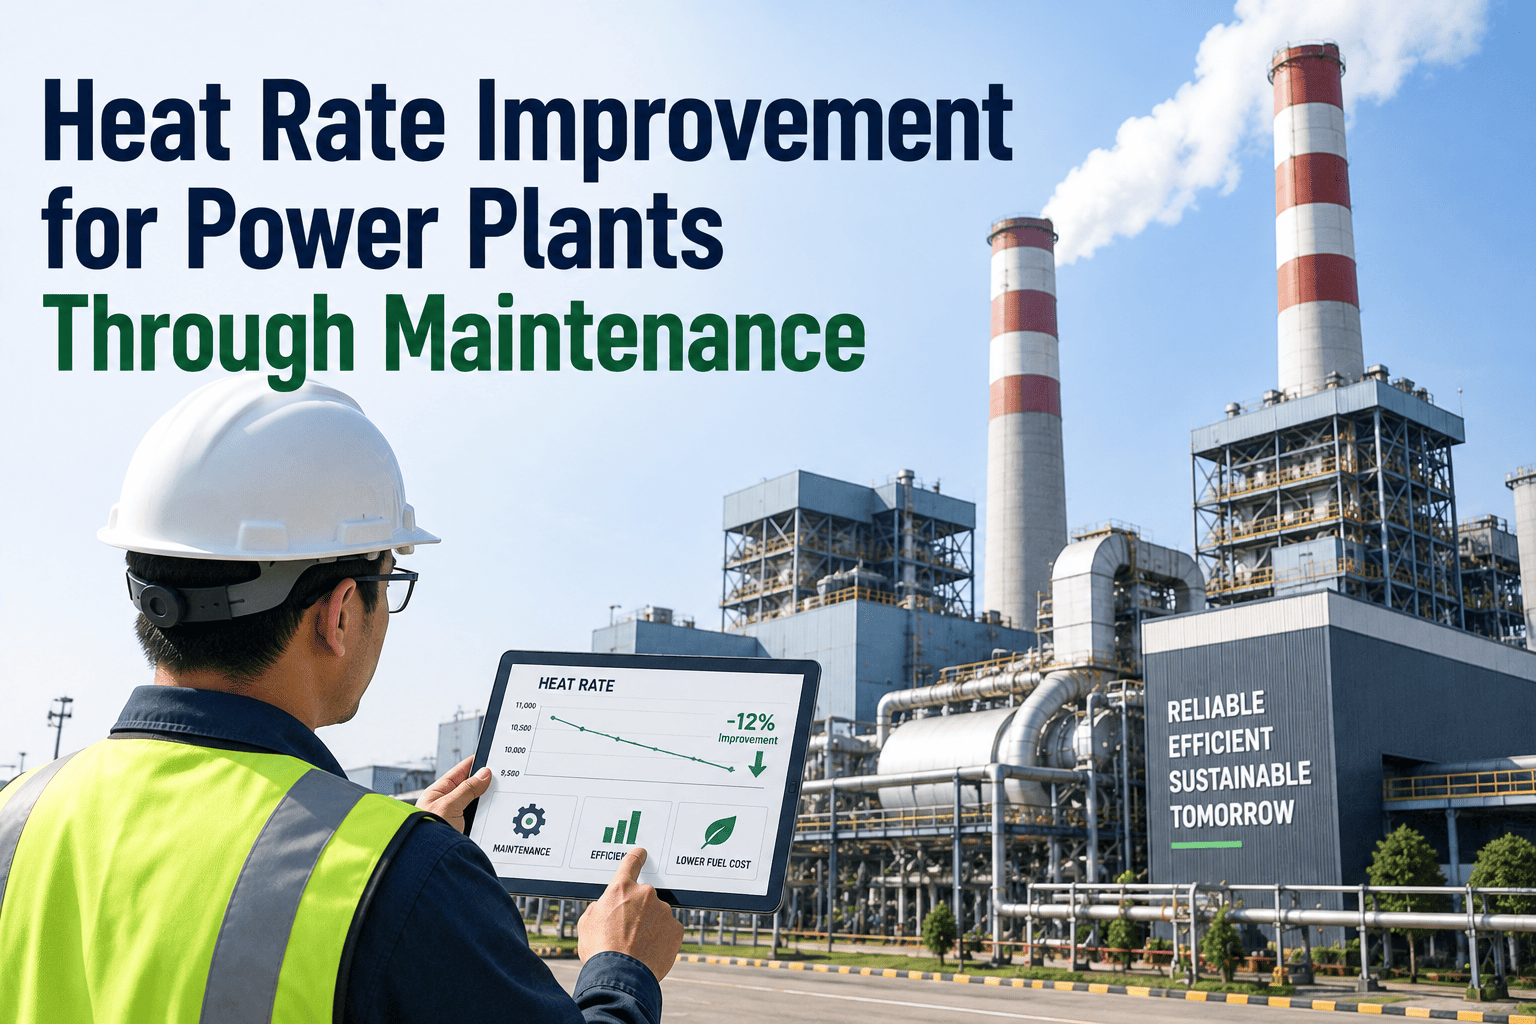
Heat rate is the single number that translates plant condition into dollars. Every Btu/kWh of degradation directly increases fuel cost or reduces dispatch competitiveness, and on a 480 MW combined-cycle unit, even a 2% drift can quietly burn $2M to $3M of fuel per year before anyone notices it on a monthly report. The plant in this case study had drifted 3.1% above its design heat rate over four years, blaming aging equipment when the actual cause was hidden in three places, leaking cycle isolation valves, fouled condenser tubes, and a partially bypassed BFW heater train. In 11 months of structured CMMS-driven recovery work, the plant pulled 2.4% of that degradation back, recovered roughly $2.6M in annual fuel cost, and built a maintenance record that turned heat rate into a managed KPI rather than a quarterly surprise. The full recovery roadmap is available when you start a free trial.
Design heat rate baseline
Design
2.4% recovered
0.7% residual
3.1%
Total degradation before
2.4%
Recovered in 11 months
$2.6M
Annual fuel cost recovered
The diagnosis
Three silent killers behind the 3.1% drift
Most plants treat heat rate degradation as a single number that rises slowly over time. That framing makes it almost impossible to act on. The plant in this case study broke the 3.1% gap into its physical components using a structured cycle-loss audit, and the answer was specific. Three asset categories were responsible for 87% of the total degradation, and none of them required capital replacement to recover. They required structured maintenance discipline, properly logged in a CMMS, with the right inspection cadences and trigger thresholds.
01
Leaking cycle isolation valves
1.1% loss
42 high-energy drain and bypass valves passing steam to the condenser, each one a small direct loss of generation. Cumulative effect compounded with every cycling event.
02
Fouled condenser tubes
0.9% loss
Tube fouling and air in-leakage pushed condenser backpressure 0.7 inHg above design, directly degrading turbine output. Every 0.4 inHg of backpressure cuts turbine efficiency by 0.5%.
03
Bypassed BFW heater train
0.4% loss
Two HP feedwater heaters had been operating with internal bypass leaks, reducing final feedwater temperature 11°F below design and forcing the boiler to compensate with more fuel.
The fuel arithmetic
Why a 2.4% heat rate recovery is worth $2.6M per year
Heat rate translation to dollars is the math that finance teams care about. Once a reliability engineer can put a defensible fuel-cost number on the table, heat rate stops being a thermodynamic abstraction and becomes a budget line. The arithmetic below is what the maintenance director used to justify the 11-month structured recovery program to the CFO in a single meeting.
Annual generation
2.85 million MWh
Design heat rate
7,150 Btu/kWh
Degraded heat rate baseline
7,371 Btu/kWh
Heat rate after recovery work
7,200 Btu/kWh
Fuel cost at $3.85 per MMBtu
Recovered $2.6M annually
Translate your heat rate gap into recoverable dollars
Bring your last 12 months of heat rate data and we will build the recovery math
A 30-minute session with the OxMaint reliability team uses your specific unit capacity, current heat rate, and fuel cost to quantify the dollar value of every 1% of recoverable degradation. No vendor-side assumptions, just defensible numbers you can take to your CFO.
Workstream 1, cycle isolation
How 42 leaking valves became a structured 11-month recovery program
Cycle isolation is the single highest-leverage heat rate workstream because the losses are direct, the inspection methods are well-documented, and the corrective actions are inexpensive relative to the recovery. The challenge has never been technical, it has been organizational. Most plants do not know which valves are leaking because nobody has been assigned to find out. Adding cycle isolation valves as a tracked asset class in OxMaint with quarterly thermography surveys closed that gap.
Step 1
Asset class created
42 high-energy isolation valves added to the CMMS as a distinct asset category with criticality A or B classification.
Step 2
Quarterly IR surveys
Infrared thermography PM cycle added, with temperature delta thresholds triggering automatic corrective work orders.
Step 3
Acoustic emission scans
Ultrasonic scanning of suspect valves to confirm internal pass-through, eliminating false positives from external heat signatures.
Step 4
Outage repair scheduling
Confirmed leakers grouped into outage scope, parts pre-staged, repair sequence planned by CMMS work order priority.
Workstream 2, condenser performance
From 0.7 inHg over design to within tolerance in 6 months
Condenser performance was the second-largest contributor to the gap and the most measurable. The plant had been running 0.7 inHg above design backpressure for over two years without recovering any of it, because nobody owned the metric weekly. OxMaint changed that by making condenser backpressure a tracked KPI with weekly review and trigger thresholds for tube cleaning, air leak surveys, and vacuum pump performance checks.
Y-axis
Condenser backpressure deviation from design, in inHg
Threshold
Tube cleaning trigger at 0.4 inHg above design
Workstream 3, BFW heaters
Recovering 11°F of final feedwater temperature with no capex
The BFW heater workstream is where most plants assume capital expenditure is required and walk away. The plant in this case study proved that assumption wrong. Both HP heaters were recoverable through structured maintenance work, drain valve replacements, internal partition plate inspection, and instrumentation calibration. No new tubes, no shell replacement, no capital project. Just a 90-day program of carefully scoped maintenance work logged against each heater as a discrete asset.
Before
Final feedwater temp, 472°F
11°F below design point
DCA at 18°F vs 10°F target
Internal bypass leaks both HP heaters
Drain valve passing on HP1
Level instrumentation drift
After
Final feedwater temp, 483°F
Within 0°F of design point
DCA restored to 9°F
Internal seals replaced on both HP heaters
HP1 drain valve overhauled
Level instruments recalibrated
The recovery timeline
How 2.4% came back across 11 months of structured work
The recovery did not happen in a single outage. It happened across three sequenced workstreams running in overlapping windows, each tracked in OxMaint with its own KPI dashboard. The compounding effect, where each workstream made the next one more measurable, is what kept the program funded after the first quarter. Once cycle isolation showed a 0.6% recovery in 90 days, the CFO signed off on the full 11-month plan without further debate.
Months 1-3
0.6% recovered
Cycle isolation phase 1, top 12 leakers repaired
Months 4-6
1.4% recovered
Condenser tube cleaning, air leak fixes, vacuum pump rebuild
Months 7-9
2.0% recovered
BFW heater train recovery, drain valves and seals replaced
Months 10-11
2.4% recovered
Cycle isolation phase 2, remaining 30 valves closed out
The CMMS structure that made it stick
What changed inside the CMMS to keep heat rate from drifting back
Heat rate recovery is meaningless if the gain is lost within 18 months as new degradation accumulates unnoticed. The plant treated the 11-month program as the first cycle of an ongoing discipline rather than a one-time intervention. Four structural CMMS changes ensure the recovery is durable, with heat rate now reviewed weekly in the leadership stand-up and degradation flagged within the same fiscal quarter rather than the next annual benchmark.
A
Cycle isolation as a tracked asset class
42 high-energy valves moved from generic valve population into a distinct asset class with quarterly IR survey PMs, severity-based corrective work orders, and a dashboard view by leak rate.
B
Condenser backpressure as a weekly KPI
Backpressure deviation logged weekly against a named owner, with 0.4 inHg as the trigger for tube cleaning work orders and 0.2 inHg as the trigger for air leak surveys.
C
BFW heaters with structured performance fields
DCA, TTD, and final feedwater temperature captured as structured fields on every PM completion, with trend lines built directly into the asset record for at-a-glance review.
D
Heat rate review cadence
Weekly heat rate review built into the leadership stand-up agenda. Deviation above 0.3% from rolling 90-day baseline triggers an immediate root cause investigation work order.
What the numbers look like now
The performance metrics tracked monthly post-program
A reliability program needs measurable artifacts that outlast the original team. The KPIs below are now part of the plant's monthly reliability report, presented to corporate engineering and to the asset owner. Each metric is owned by a named role, reviewed on a fixed cadence, and tied to a CMMS dashboard with drill-down to individual work order records.
Common questions
Frequently asked questions from reliability and operations teams
Is recovering 2.4% of heat rate degradation in 11 months realistic for older plants?
Yes for plants currently running 2% or more above design with cycle isolation, condenser, or BFW heater contributors. Plants already well-maintained typically see 0.5% to 1% recovery.
Book a scoping call for a unit-specific projection based on your current heat rate gap.
Does this recovery require capital expenditure or can it be done within the maintenance budget?
The 11-month program in this case study required zero new capex. All recovery came from structured maintenance work, valve repairs, tube cleaning, drain valve overhauls, and instrument calibration. Capital replacement was avoided entirely for the 480 MW unit covered here.
How do we measure heat rate accurately enough to track sub-1% improvements?
Daily corrected heat rate calculations using design correction curves for ambient temperature, fuel quality, and load. OxMaint accepts SCADA feeds for fuel flow, generation, and condenser parameters, calculating corrected heat rate automatically against the design curve.
Can OxMaint track cycle isolation valve thermography surveys against a tracked asset class?
Yes. Cycle isolation valves can be classified as a distinct asset category with custom PM frequencies, IR survey checklists, ΔT severity thresholds, and corrective work order auto-generation.
Start a free trial to see the asset class structure.
How do we keep the recovered heat rate from drifting back over the next two years?
Three controls keep the gain durable. Weekly heat rate review in the leadership stand-up. Cycle isolation IR surveys on a quarterly cadence. Condenser backpressure trigger thresholds for tube cleaning. Without these, recovered heat rate typically drifts back within 18 to 24 months.
Recover your heat rate, durably
Heat rate is the most expensive number nobody owns until it costs millions
If your plant has not formally audited cycle isolation, condenser, and BFW heater contributions to current heat rate in the last 12 months, the degradation is probably worse than the monthly report suggests. A 30-minute conversation with OxMaint will walk you through the same diagnostic framework used in this case study, against your specific unit, your current heat rate, and your fuel cost. Bring your last 12 months of heat rate data and we will quantify the recovery opportunity live.