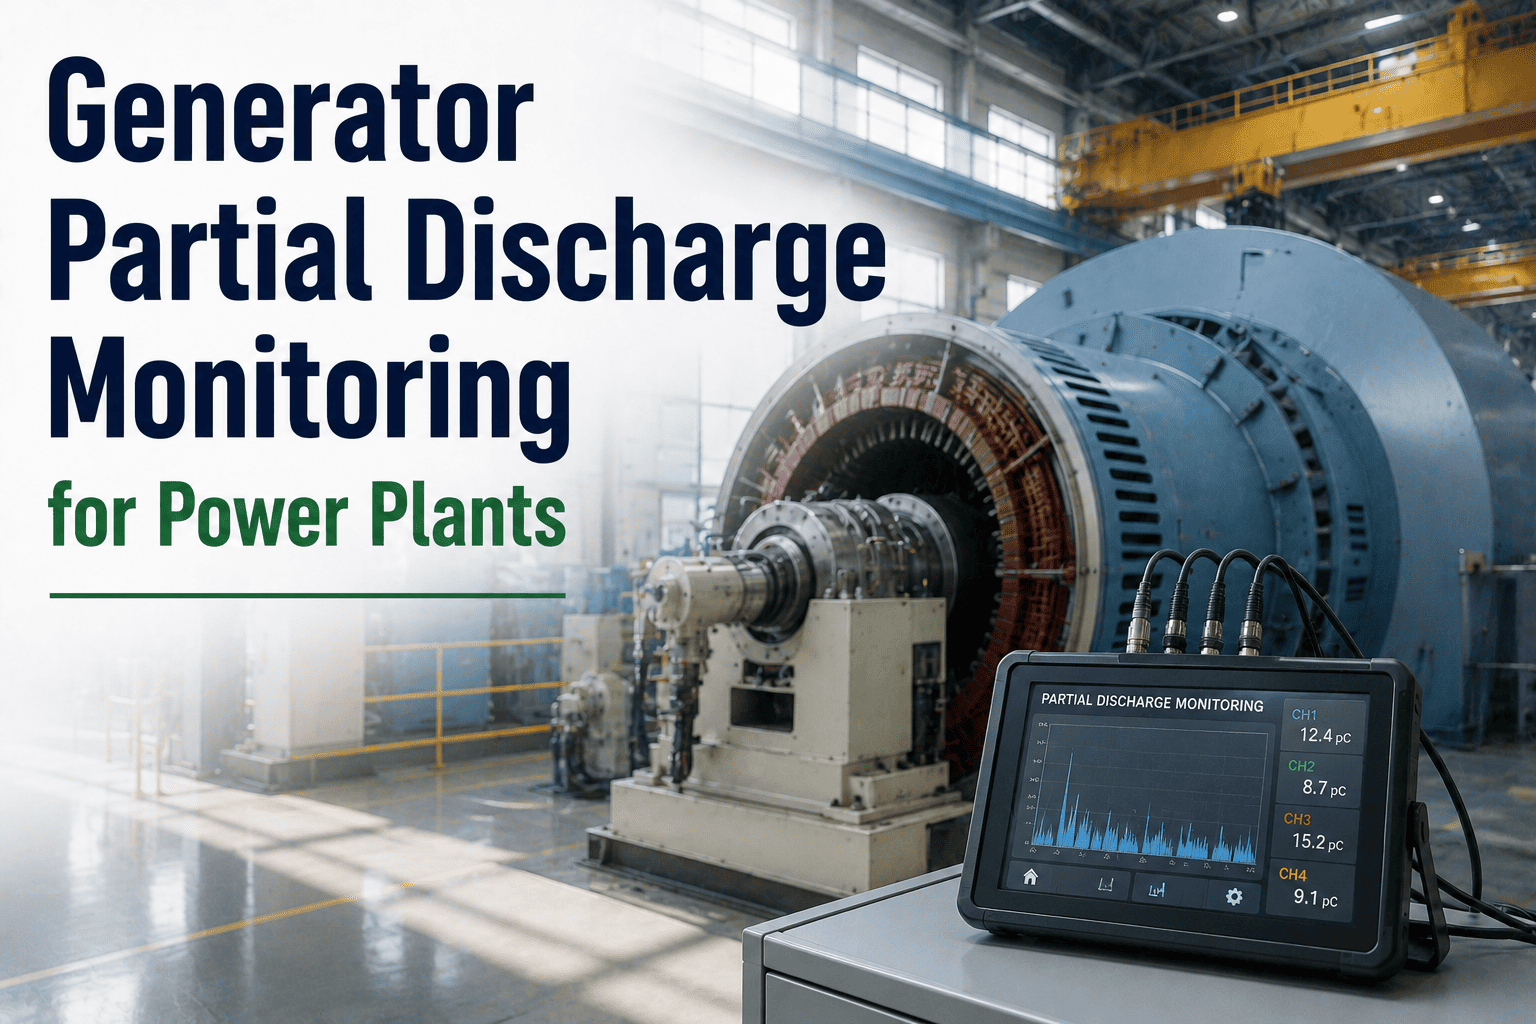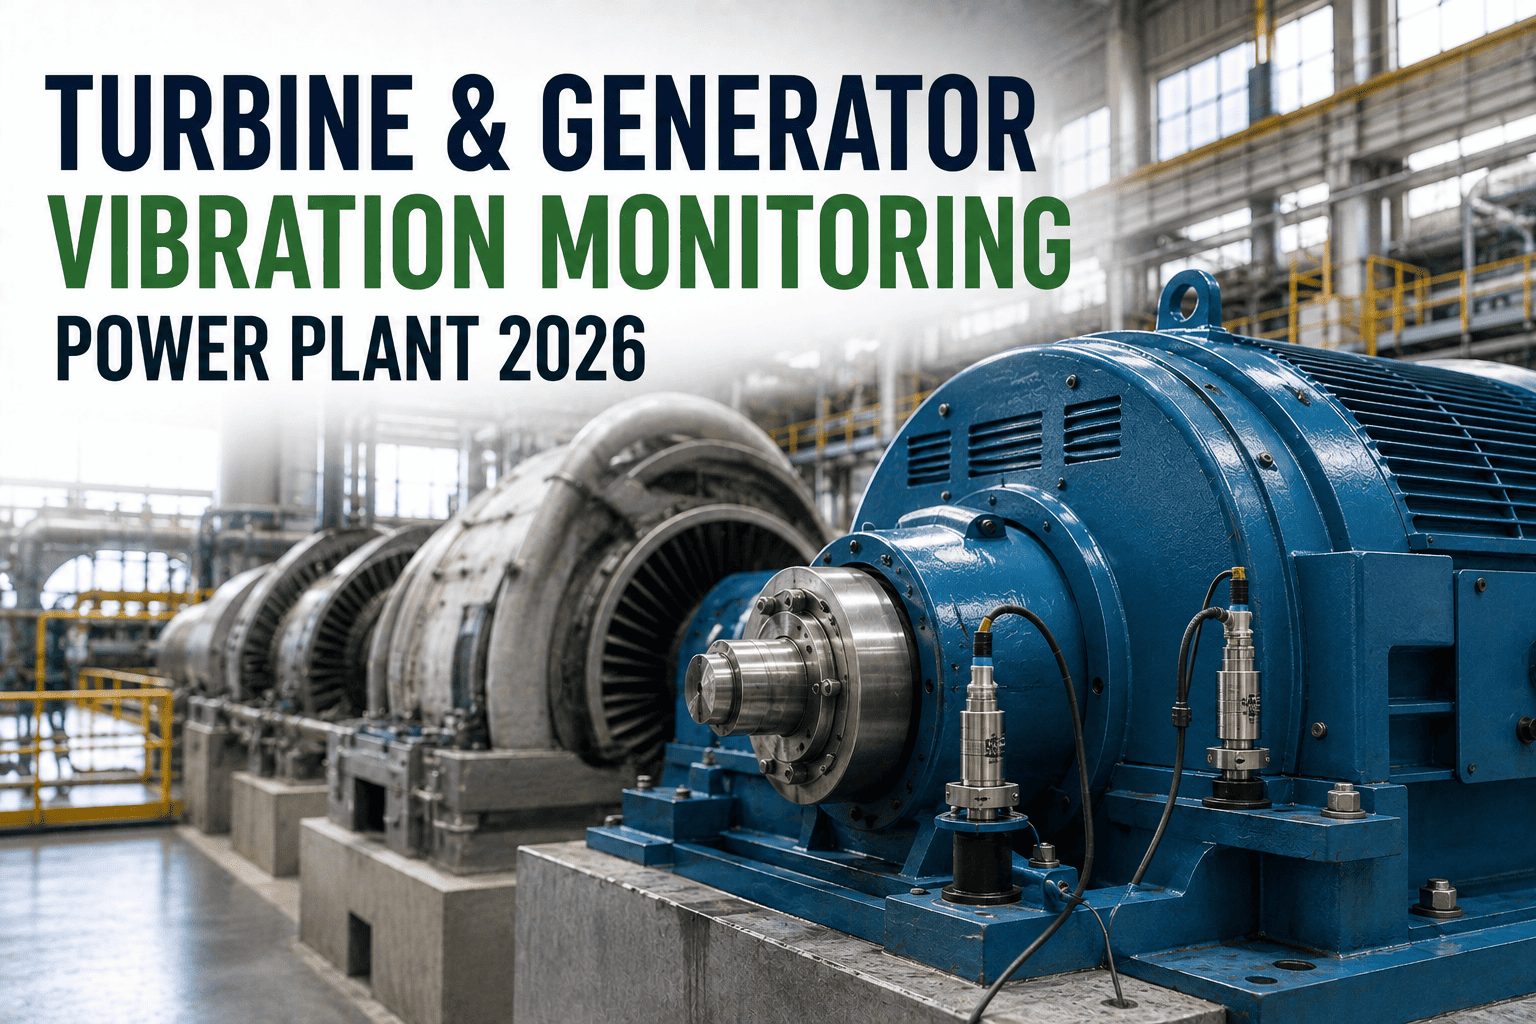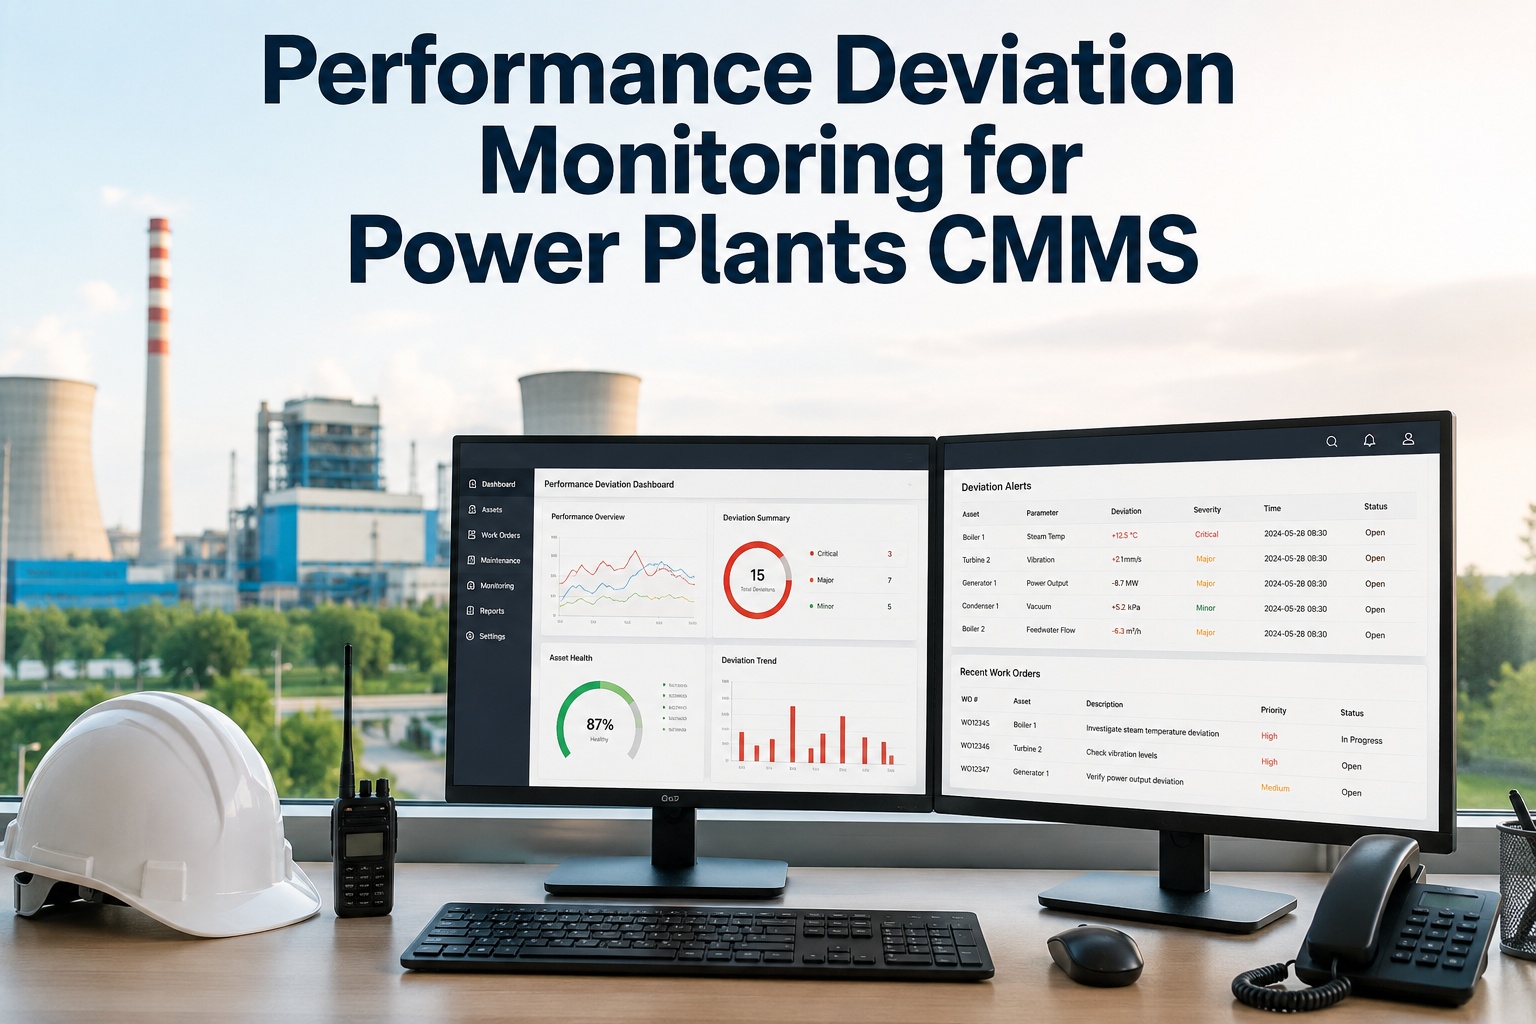
Performance deviation monitoring for power plants is the practice of continuously tracking heat rate, turbine output, and generator reactive power against design baselines so that reliability teams can detect degradation long before a failure triggers a forced outage. A modern CMMS like OxMaint turns raw sensor data into actionable work orders, cutting unplanned downtime by up to 50% and protecting the tight margins where a single 1% heat rate deviation can cost a 500 MW plant over $500,000 per year. By pairing real-time deviation alerts with automated preventive maintenance scheduling, maintenance managers shift from reactive firefighting to predictive asset management. See how OxMaint maps thermodynamic losses to maintenance triggers when you Start Free Trial today.
Catch a 1% Heat Rate Deviation Before It Costs You $500K a Year
Stop discovering turbine degradation during forced outages. OxMaint unifies real-time performance KPI monitoring with automated work order triggers — so your reliability team fixes developing faults during planned maintenance windows, not at 2 AM on a Sunday.
Why Power Plant Performance Monitoring Can't Wait for the Next Outage
A 2023 EPRI study found that 70% of forced gas turbine outages had detectable performance deviations in the 30 days prior — yet only 12% of plants act on that data early. The gap between detection and action is where margins evaporate.
Fouled compressor blades and degraded seals push heat rate up silently. At $4/MMBtu gas, a 500 MW combined-cycle unit loses $1.5M–$3.5M annually per percentage point of deviation.
A 2.4% drop in gross output on a 500 MW frame gas turbine equals 12 MW of unrealized capacity. At $35/MWh that is $3.6M in lost revenue across a single year of operation.
The average major forced outage on a large frame turbine costs $1.2M in parts, labor and contractual penalties — 80% of which predictive deviation monitoring could defer or prevent.
Heat Rate, Turbine & Generator Monitoring — The Three Streams That Matter
Effective power deviation monitoring isn't one dashboard — it's three parallel data streams, each with its own baseline, trigger threshold and CMMS workflow. Here's what reliability teams should track and the thresholds that should auto-generate work orders.
Heat Rate Deviation Monitoring
Compare corrected net heat rate (Btu/kWh) against the manufacturer's design curve corrected to ISO conditions. A sustained deviation greater than 1.0% over a rolling 72-hour window triggers a compressor wash work order in OxMaint; greater than 2.5% triggers a borescope inspection request.
Turbine Output & Degradation Monitoring
Track corrected gross MW output against the baseline performance curve. Degradation splits into recoverable loss (fouling — fixed by online washing) and non-recoverable loss (clearance opening, blade erosion — fixed at major inspection). OxMaint logs each wash cycle and trends recovery to predict the optimal wash interval.
Generator Performance & Reactive Power Trending
Monitor MVAR output, stator winding temperature deviation, hydrogen pressure and excitation current against nameplate limits. A 5°C rise in stator bar temperature above identical load baseline flags a cooling or insulation issue — OxMaint auto-creates a high-priority predictive work order before winding degradation accelerates.
Power Plant Performance KPIs That Should Auto-Trigger Maintenance
The table below maps the core performance analytics power teams must monitor to the specific CMMS action OxMaint fires when a threshold is breached — turning data into work without manual spreadsheet reviews.
| Performance KPI | Monitoring Target | Yellow Alert Threshold | CMMS Auto-Action in OxMaint |
|---|---|---|---|
| Corrected Heat Rate | Btu/kWh vs design curve | +1.0% over 72h rolling | Generate online compressor wash WO |
| Turbine Gross Output | Corrected MW vs baseline | -1.5% sustained | Schedule borescope inspection + turbine analysis |
| Generator MVAR | Reactive power vs excitation limit | 5% drift from baseline | Flag AVR / excitation system inspection |
| Stator Winding Temp | Highest bar temp vs load-normalized baseline | +5°C above identical load | Priority predictive WO for cooling / insulation |
| Condenser Vacuum | Backpressure vs design at CW temp | +0.5 inHg deviation | Trigger tube cleaning & leak detection WO |
| Vibration (Tier 1) | Overall amplitude vs ISO 10816 | Zone B → Zone C transition | Critical priority diagnostic WO + notify reliability eng. |
The Core Heat Rate & Degradation Formulas Your CMMS Should Calculate
Performance deviation monitoring only works when the CMMS can automatically normalize raw data to ISO conditions and compare it to a valid baseline. Here are the formulas OxMaint computes behind the scenes to generate deviation alerts.
If HRdev > 1.0% for 72 hours, OxMaint auto-fires a compressor wash work order. A 500 MW unit at 7,000 Btu/kWh design running at 1.5% deviation burns an extra 52,500 MMBtu/month — roughly $210K in excess fuel.
Measured immediately after a full compressor wash. When NRdeg exceeds 2.0%, OxMaint schedules the unit into the next planned major inspection window rather than waiting for the calendar-based interval.
How OxMaint Turns Performance Deviations Into Prevented Failures
OxMaint bridges the gap that sinks most power plant reliability programs — the handoff between the performance engineer who sees the deviation and the maintenance technician who needs to fix it. No spreadsheets, no late-night emails, no lost alerts.
Automated Deviation-to-Work-Order Engine
OxMaint ingests real-time PI, SCADA or historian data and auto-generates a fully populated work order — asset, priority, labor estimate, parts — the moment a performance KPI crosses your configured threshold. Outcome: eliminate the 4–48 hour lag between detecting a deviation and acting on it.
Predictive Degradation Trending
Machine-learning models trend recoverable vs non-recoverable loss separately, predicting the exact week output will fall below your minimum acceptable MW threshold. Outcome: plan major inspections on asset condition, not guesses — cutting unplanned downtime 30–50%.
Asset-Level Performance KPI Dashboards
Every turbine, generator and boiler has a live dashboard showing current heat rate, output deviation, MVAR trend and active work order status in one view — built for morning reliability meetings. Outcome: replace 6 hours of weekly spreadsheet reporting with a real-time single source of truth.
Audit-Ready Compliance & History
Every deviation alert, triggered work order, executed repair and post-maintenance performance test is timestamped and linked permanently to the asset record. Outcome: pass NERC and ISO 55000 audits in minutes, not weeks — with full traceable evidence.
A 180-Asset Combined-Cycle Plant Saves $2.1M in Year One
Consider a 1,200 MW combined-cycle plant with 180 tracked assets — two gas turbines, one steam turbine, six generators and associated BOP equipment. Before OxMaint, the team ran on a calendar-based PM schedule and discovered performance issues during outages or after trip events.
Baseline & Integration
OxMaint ingested 18 months of historian data, establishing corrected heat rate and output baselines for all major rotating equipment. Three hidden deviations were detected in the first week — including a 1.8% heat rate deviation on GT-2.
First Prevented Outage
Stator temperature deviation on ST-1 triggered a predictive work order. Inspection found early-stage winding insulation degradation. Repairs during a planned weekend window cost $85K — the avoided forced outage would have cost $620K plus contractual penalties.
Wash Interval Optimization
OxMaint's trending models recommended shifting GT-1 and GT-2 from calendar-based compressor washes to condition-based washes, saving $180K/year in unnecessary wash cycles while recovering an additional 0.6% in average output.
Year-One Verified Savings
Total documented savings: $2.1M — $1.3M in avoided forced outage costs, $620K in recovered heat rate / output, and $180K in optimized wash scheduling. The plant's unplanned downtime dropped 41% year-over-year.
See OxMaint Detect Your First Deviation in Under 14 Days
Book a 30-minute demo and we'll connect your historian sample data to show you exactly which assets are deviating right now — and the work orders OxMaint would auto-generate.
Power Plant Performance Deviation Monitoring FAQ
What is performance deviation monitoring in a power plant CMMS?
It is the continuous comparison of real-time asset performance metrics — heat rate, turbine output, generator MVAR, vibration — against design baselines or ISO-corrected curves, with automated triggers that generate maintenance work orders when a metric drifts beyond a configured threshold. OxMaint automates this end-to-end so deviations become actionable tasks, not just dashboard alerts.
How does heat rate deviation monitoring save money?
A 1% heat rate increase on a 500 MW combined-cycle unit typically costs $500,000–$750,000 per year in excess fuel. OxMaint detects sub-1% deviations within hours, auto-triggers corrective maintenance like compressor washes, and verifies recovery — often paying for the entire CMMS deployment in the first saved quarter. See it on your data when you Book a Demo.
Can OxMaint connect to our existing PI System or SCADA historian?
Yes. OxMaint integrates with OSIsoft PI, most major SCADA systems, and standard OPC-UA / MODBUS interfaces to ingest real-time performance data. The platform normalizes raw values to ISO conditions, compares them to stored design baselines, and fires work orders — no manual data export or spreadsheet uploads required.
What KPIs should a power plant track for turbine degradation monitoring?
At minimum, track corrected gross MW output, corrected heat rate, compressor discharge pressure and temperature, exhaust temperature spread, vibration amplitude per ISO 10816, and recoverable vs non-recoverable loss split. OxMaint pre-configures these KPI templates for Frame 6/7/9FA gas turbines, steam turbines and major generators out of the box.
How long does it take to deploy OxMaint for performance monitoring?
Most power plants are live in 2–4 weeks. OxMaint ingests 12–24 months of historian data to establish baselines, configures deviation thresholds against your operating profile, and connects work order routing to your existing maintenance team structure. You can Start Free Trial in minutes and begin onboarding assets immediately.
Stop Letting Silent Deviations Drain Your Margins
Every day without performance deviation monitoring is a day your turbines, generators and boilers could be losing output and burning excess fuel. OxMaint makes detection and response automatic.
Free 14-day trial · No credit card