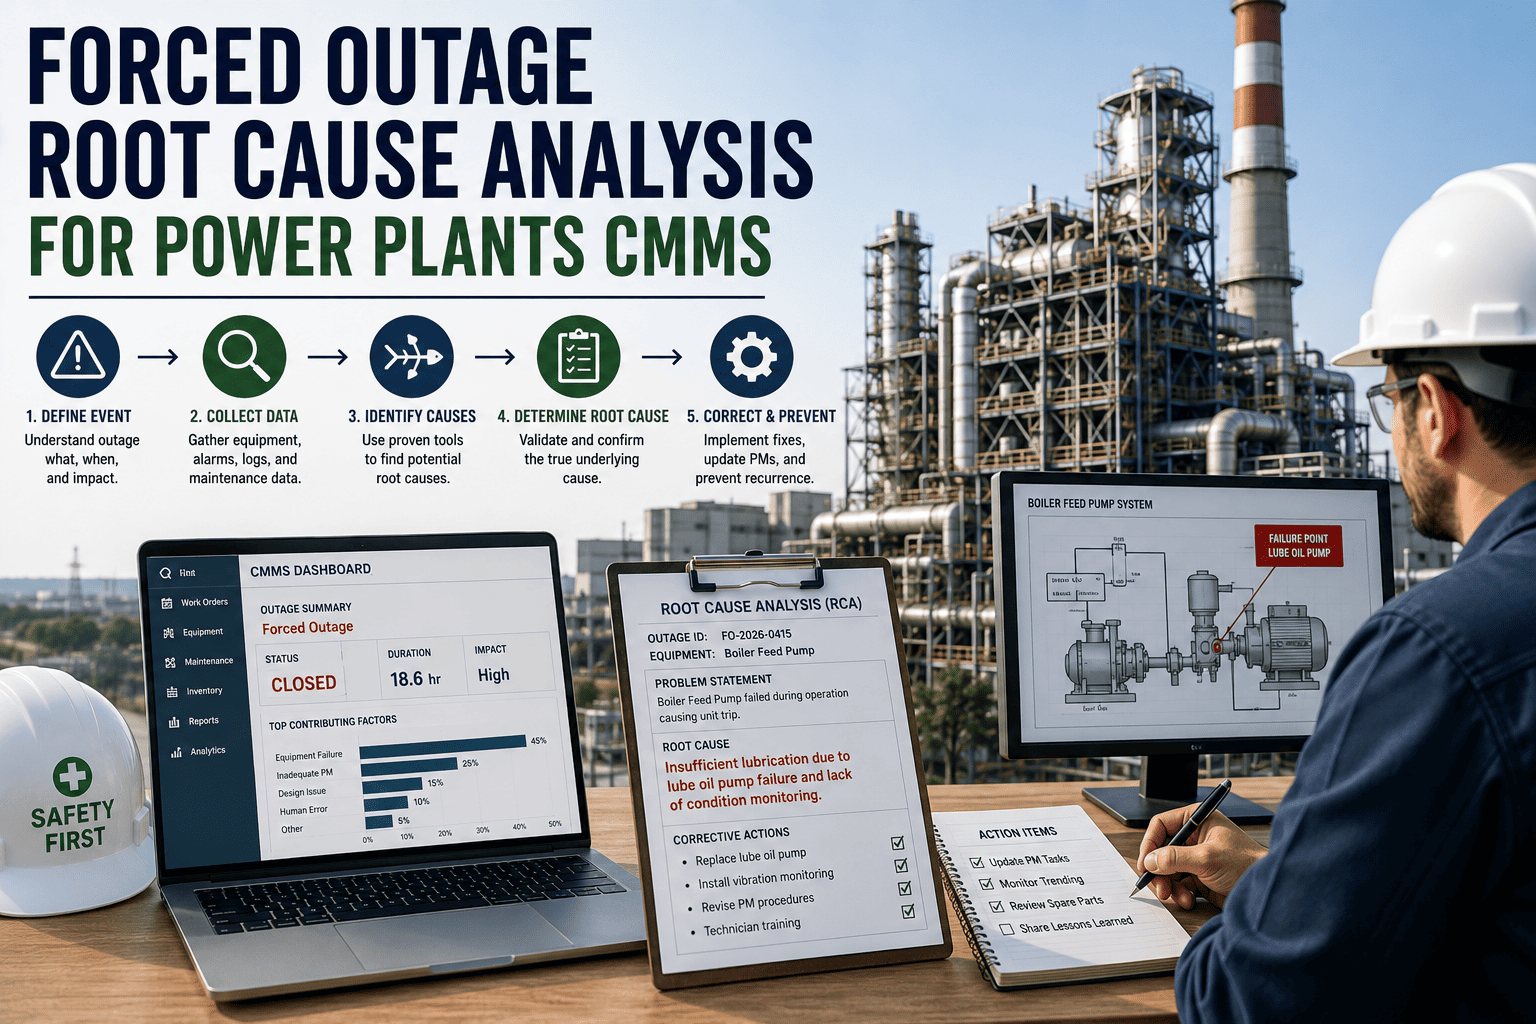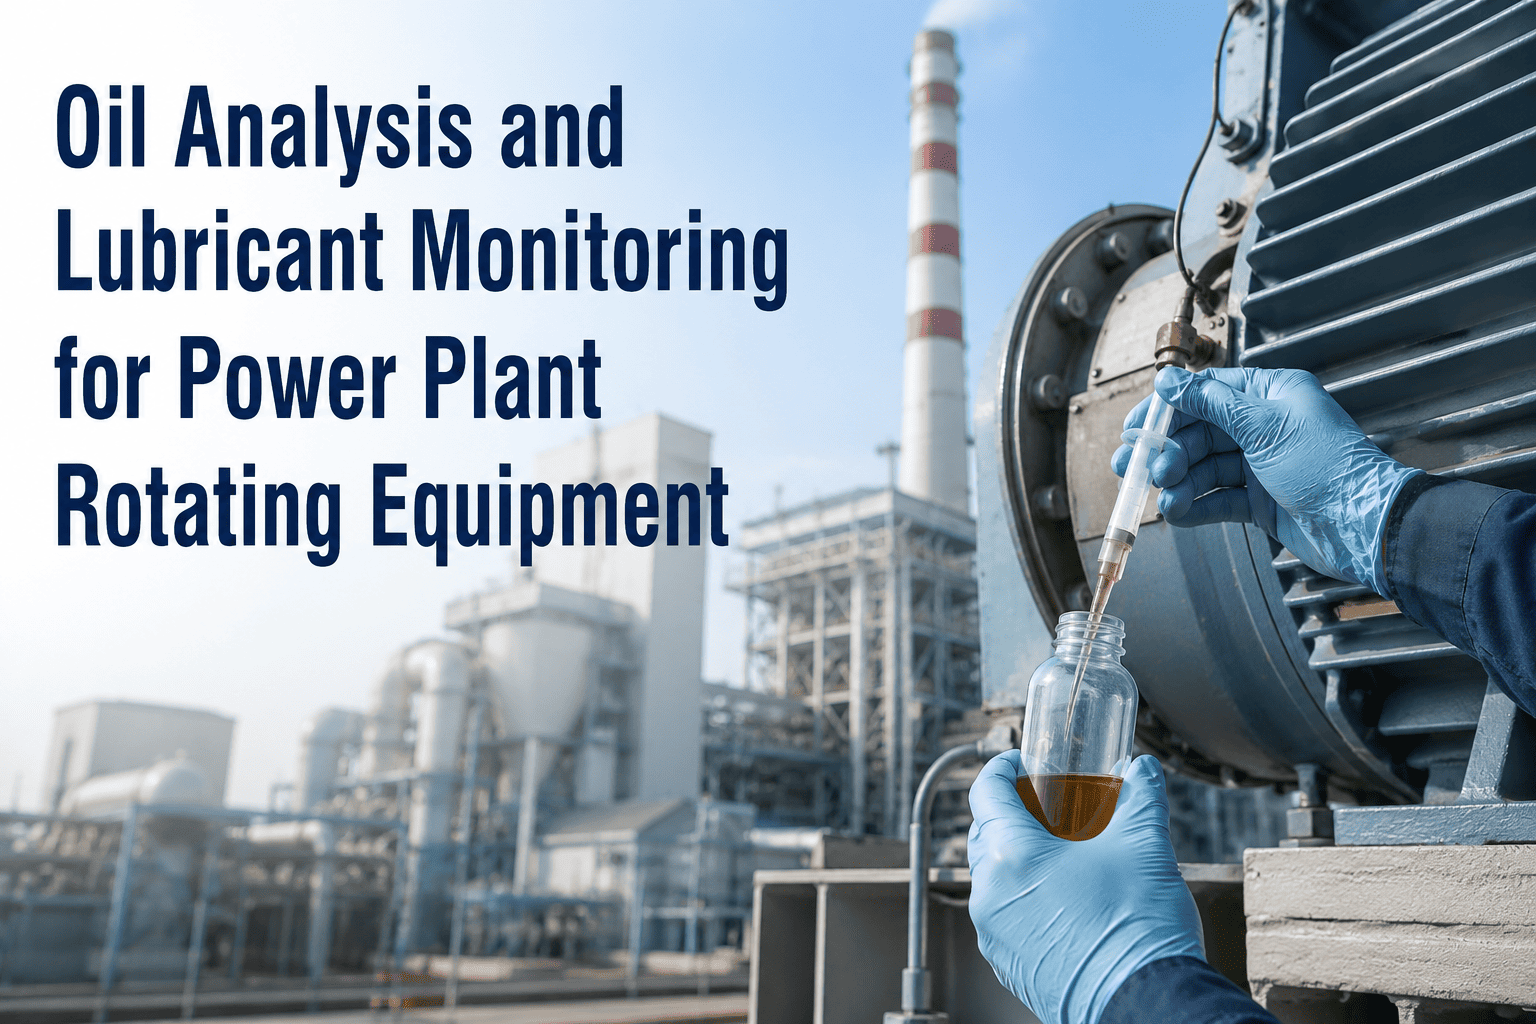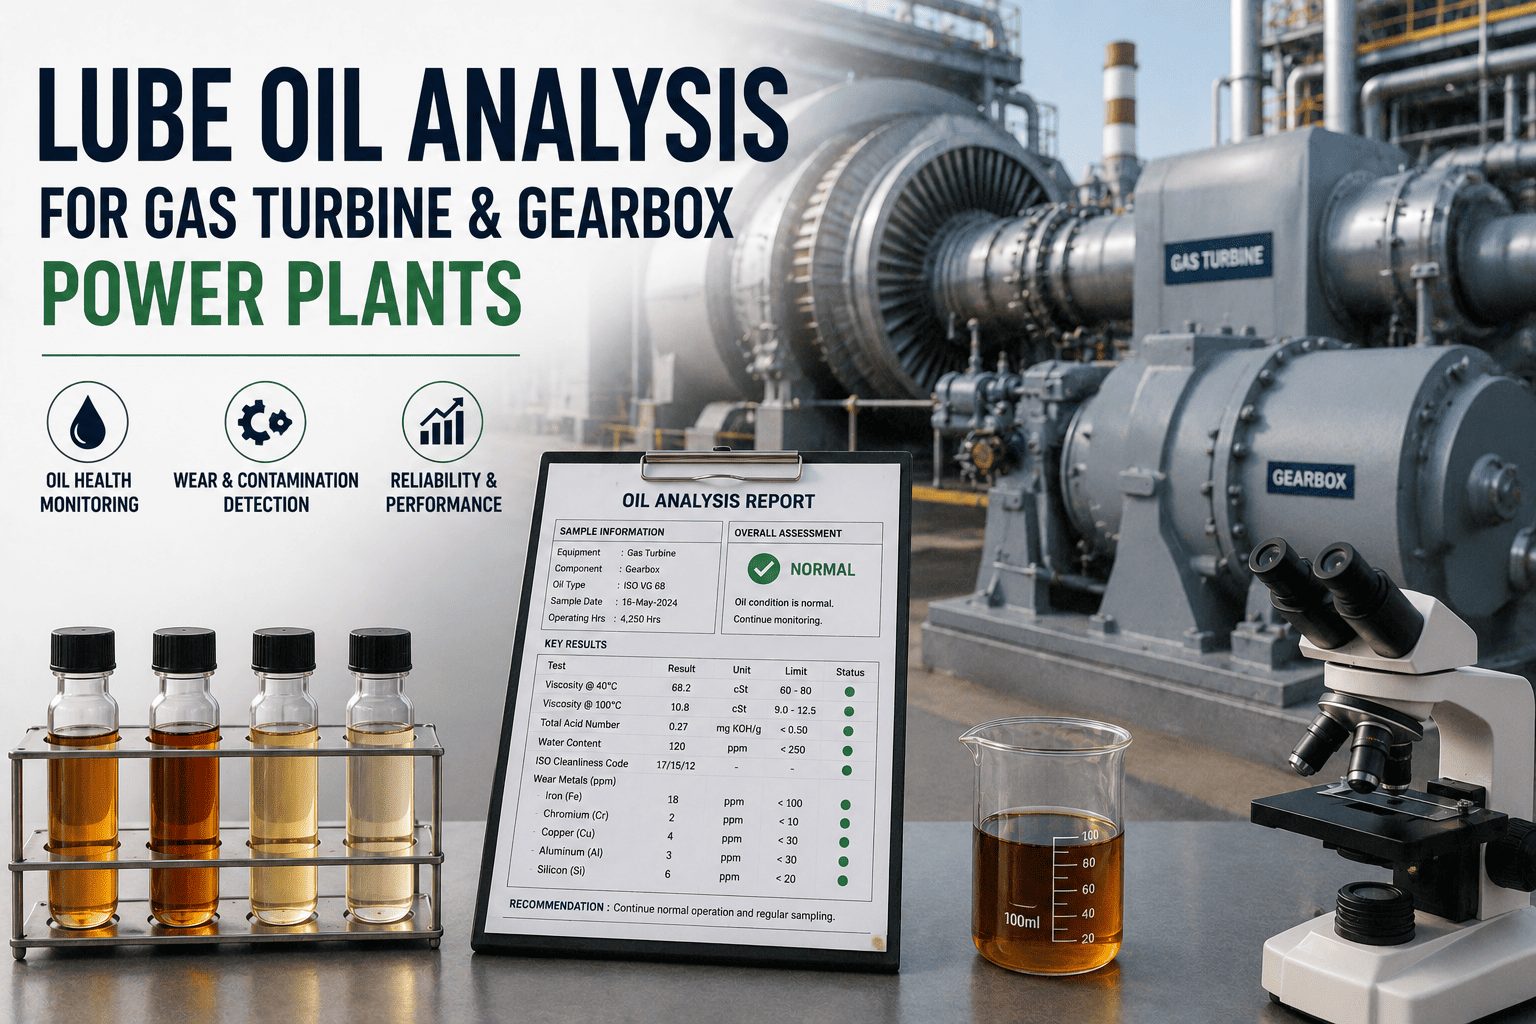
Lube oil analysis for power plant gas turbines and gearboxes is the single most cost-effective predictive maintenance technique available to reliability teams — a $25 oil sample can prevent a $500K turbine bearing failure. By tracking wear particles, viscosity, water content, and varnish potential on a consistent sampling interval, maintenance teams catch degradation weeks before vibration or temperature sensors register a problem. Whether you manage a peaking plant running GE 7FA frames or a baseload combined-cycle fleet with reduction-gear-driven generators, a structured turbine oil program reduces unplanned downtime by 30–50% and extends oil drain intervals by 2–3x. This guide covers sampling intervals, test slates, alarm limits, and how modern CMMS platforms like OxMaint automate the entire workflow — or you can Start Free Trial to deploy a digital oil analysis program today.
PREDICTIVE MAINTENANCE GUIDE
Is your turbine oil program catching failures 30 days before they happen — or 30 minutes?
A single missed varnish threshold can cost a 200MW gas turbine plant over $480K in unplanned downtime, bearing replacement, and lost generation revenue. OxMaint turns lab reports into automated work orders so you act on every sample — before the damage becomes irreversible.
TEST SLATES & SAMPLING INTERVALS
Gas turbine & gearbox oil sampling intervals and test slates
Industry standards (ASTM D4378, D6224) and major OEMs like Siemens, GE, and Mitsubishi recommend quarterly lube oil analysis for gas turbine reservoirs and bi-annual sampling for gearbox-driven equipment — but your interval should tighten as the oil ages. Below is a proven test slate mapped to failure modes, with alarm thresholds that trigger corrective work orders inside your CMMS.
| Test Parameter | ASTM Method | Gas Turbine Interval | Gearbox Interval | Alarm (Caution) | Failure Mode Detected |
|---|---|---|---|---|---|
| Viscosity @ 40°C | D445 | Quarterly | Semi-annual | ±10% from new oil | Oil degradation, wrong top-off, shear breakdown |
| Water (Karl Fischer) | D6304 | Monthly | Quarterly | > 200 ppm | Condensation, cooler leak, bearing corrosion |
| Acid Number (TAN) | D664 | Quarterly | Semi-annual | > 1.0 mg KOH/g rise | Oxidation, additive depletion |
| Particle Count (ISO Code) | ISO 11500 | Monthly | Quarterly | > ISO 18/16/13 | Contamination, filter bypass, wear ingress |
| Wear Metals (ICP) | D5185 | Quarterly | Quarterly | Fe > 50 ppm, Cu > 20 ppm | Bearing wear, gear scuffing, bushing erosion |
| Varnish Potential (MPC) | ASTM D7843 | Quarterly | Semi-annual | > 30 ΔE | Oxidation byproducts, valve stiction, filter plugging |
| PQ Index (Ferrous) | D7690 | Monthly | Quarterly | > 40 | Severe ferrous wear — gear pitting, spalling |
Real-world example: A 450MW combined-cycle plant in Texas running two GE 7FA gas turbines adopted quarterly MPC varnish monitoring with alarm thresholds at 30 ΔE. In month 14 of a 36-month oil cycle, MPC readings climbed from 18 to 34 ΔE — triggering an automated work order in OxMaint for an electrostatic oil flush. The $8,500 flush prevented a varnish-induced servo-valve stiction event that would have caused a 72-hour forced outage worth an estimated $1.1M in lost generation.
WORKED ROI EXAMPLE
Cost of inaction vs. a structured turbine oil program
For a mid-sized power plant with 2 gas turbines and 1 reduction gearbox, the math is stark. Below is a real-world cost model showing how a $14K/year oil analysis program prevents $420K+ in avoidable damage and downtime — a 30:1 return on investment.
ANNUAL OIL ANALYSIS PROGRAM COST
AVOIDED COST (WITHOUT PROGRAM)
WEAR PARTICLE & VARNISH DEEP-DIVE
Wear particle analysis and varnish monitoring for turbine reliability
Two tests separate world-class turbine oil programs from average ones: analytical ferrography (wear particle shape analysis) and Membrane Patch Colorimetry (MPC). Together they detect the failure modes that routine spectrometry misses — large wear particles above 10µm and soft contaminants that cause valve stiction.
Wear Particle Analysis (Analytical Ferrography)
Spectrometric ICP analysis is blind to particles larger than 8–10µm — exactly when severe wear (spalling, sliding, fatigue) generates the most diagnostic debris. Ferrography separates wear particles magnetically onto a slide, then a trained analyst classifies them by shape, size, and metallurgy.
- Normal rub wear: < 15µm platelets — baseline machinery wear
- Severe sliding wear: 15–50µm striated particles — load-zone distress
- Fatigue particles: 20–100µm chunks — gear/bearing spalling imminent
- Spheres: 1–5µm — bearing fatigue microcracks at subsurface
Detects bearing failure 3–6 weeks earlier than vibration alone.
Varnish Monitoring (MPC — ASTM D7843)
Varnish is the #1 cause of servo-valve stiction in gas turbine control systems. As turbine oil oxidizes, insoluble soft contaminants precipitate onto metal surfaces — trapping heat, plugging filters, and seizing control valves. MPC measures the color intensity of deposited contaminants on a 0.45µm patch.
- MPC < 15 ΔE: Normal — continue current interval
- MPC 15–30 ΔE: Caution — increase sampling, plan electrostatic flush
- MPC 30–40 ΔE: Critical — schedule flush within 30 days
- MPC > 40 ΔE: Severe — valve stiction risk, immediate action
Caught early, a $9K electrostatic flush prevents a $310K+ forced outage.
MONTH-BY-Month TIMELINE
How to build a turbine lube oil program in 90 days
A structured oil analysis program doesn't require a multi-year capital project. Here's a proven 3-month deployment timeline that takes a reactive, spreadsheet-driven plant to a condition-based, CMMS-automated oil monitoring system.
DAYS 1–30
Asset registry & baseline sampling
Catalog every turbine, gearbox, and hydraulic reservoir in OxMaint's asset hierarchy. Tag each with oil type, capacity, OEM-recommended test slate, and last-change date. Pull baseline samples from all critical assets — 1 sample per 250 gal of reservoir volume — and establish the "new oil" reference for each lubricant.
DAYS 31–60
Alarm limits & CMMS automation
Set caution and critical thresholds for each test parameter per OEM specs and ASTM D4378 guidance. Configure OxMaint to auto-generate work orders when a sample breaches a limit — routing the task to the right technician with the corrective procedure, required parts, and priority level pre-filled. Connect lab portal APIs so results flow into the CMMS automatically.
DAYS 61–90
Trend analysis & condition-based intervals
After 2–3 sampling cycles, trends emerge. OxMaint's analytics dashboard plots viscosity, TAN, water, particle count, and wear metals over time — making it obvious which assets are degrading fastest. Transition from fixed-interval oil changes to condition-based changes: extend drains on clean machines, flush the ones trending toward alarm.
HOW OXMAINT HELPS
CMMS-powered oil analysis: how OxMaint automates the workflow
Most power plants collect oil samples — then lose the value in spreadsheets, email attachments, and three-ring binders. OxMaint turns every lab report into an automated, traceable, auditable action. Here's how four specific capabilities map directly to oil analysis outcomes.
Automated sampling schedules
OxMaint auto-generates sampling work orders at the right interval for each asset — monthly water checks, quarterly full slates, semi-annual ferrography. Never miss a sample again.
Alarm-triggered work orders
When a lab result breaches a caution or critical threshold, OxMaint instantly creates a prioritized work order — pre-filled with the corrective procedure, required spare parts, and assigned technician.
Trend analytics dashboards
Every test result plots on a trend graph per asset. Spot viscosity drift, TAN rise, or MPC creep before they hit alarm levels. Compare identical turbines side-by-side to find the outlier.
Audit-ready compliance trail
Every sample, lab report, work order, and oil change is permanently linked to the asset record. Generate an ISO 55000 / NERC compliance report in one click — no more scrambling during audits.
Stop reading lab reports in isolation. Start acting on them automatically.
See how OxMaint connects oil sample results to work orders, trend dashboards, and audit trails — built for power plant maintenance and reliability teams. Book a 30-minute demo on your assets.
FAQ
Frequently asked questions about lube oil analysis in power plants
How often should I sample lube oil from gas turbines and gearboxes?
Gas turbine lube oil should be sampled quarterly for the full test slate (viscosity, TAN, water, particle count, wear metals, MPC) with monthly water-only checks if condensation is a known issue. Gearbox oil should be sampled semi-annually at minimum, quarterly for high-speed or heavily loaded units. Increase sampling frequency by 50% once any parameter enters the caution zone, and sample immediately after any abnormal event (trip, high vibration, oil top-off). OxMaint automates these dynamic intervals so you never miss a sample — book a demo to see the scheduling engine in action.
What is the most important oil test for gas turbine reliability?
Membrane Patch Colorimetry (MPC, ASTM D7843) for varnish potential is the single most valuable test for gas turbines. Varnish is the leading cause of servo-valve stiction in turbine control systems — a failure mode that can trip a unit offline with no vibration warning. An MPC reading above 30 ΔE requires immediate corrective action (electrostatic flush or oil change). Combined with quarterly particle count and wear-metal ICP analysis, MPC gives you early warning of 80%+ of oil-related turbine failures.
Can a CMMS automate oil analysis workflows?
Yes — a modern CMMS like OxMaint automates the entire oil analysis lifecycle. It schedules sampling work orders per asset and interval, receives lab results via API or manual upload, checks each result against pre-configured alarm thresholds, and auto-generates corrective work orders when limits are breached. It also trends all parameters on per-asset dashboards and maintains an audit-ready compliance trail linking every sample, report, and work order to the asset history. This eliminates the spreadsheet-and-email approach that causes 40% of lab reports to go unactioned.
What does a lube oil analysis program cost for a power plant?
A typical power plant with 2 gas turbines and 1 gearbox spends $12,000–$18,000 per year on oil analysis — covering lab fees ($75–$120 per sample), technician sampling time, and CMMS software. This investment typically delivers a 25–40× ROI by preventing a single major bearing or gearbox failure ($300K–$500K+ in avoided repair and downtime costs per incident). The largest variable is sampling discipline: missing 2 consecutive samples on a degrading asset can negate the entire program's value.
What is the difference between spectrometric analysis and ferrography?
Spectrometric analysis (ICP, ASTM D5185) measures dissolved and suspended wear metals at the parts-per-million level but is blind to particles larger than 8–10µm — meaning it misses the large wear debris generated during severe wear. Analytical ferrography separates wear particles magnetically and visually classifies them by size, shape, and concentration, detecting fatigue chunks and severe sliding particles up to 100µm+. Use spectrometry for routine trend monitoring and ferrography as a diagnostic follow-up when metals trend upward or vibration changes.
Turn every oil sample into a decision — not a filing task
Deploy OxMaint's AI-powered CMMS in days, not months. Automate sampling schedules, alarm-triggered work orders, and trend analytics across your entire turbine and gearbox fleet. Your next bearing failure is already developing — catch it before it catches you.
Free 14-day trial · No credit card