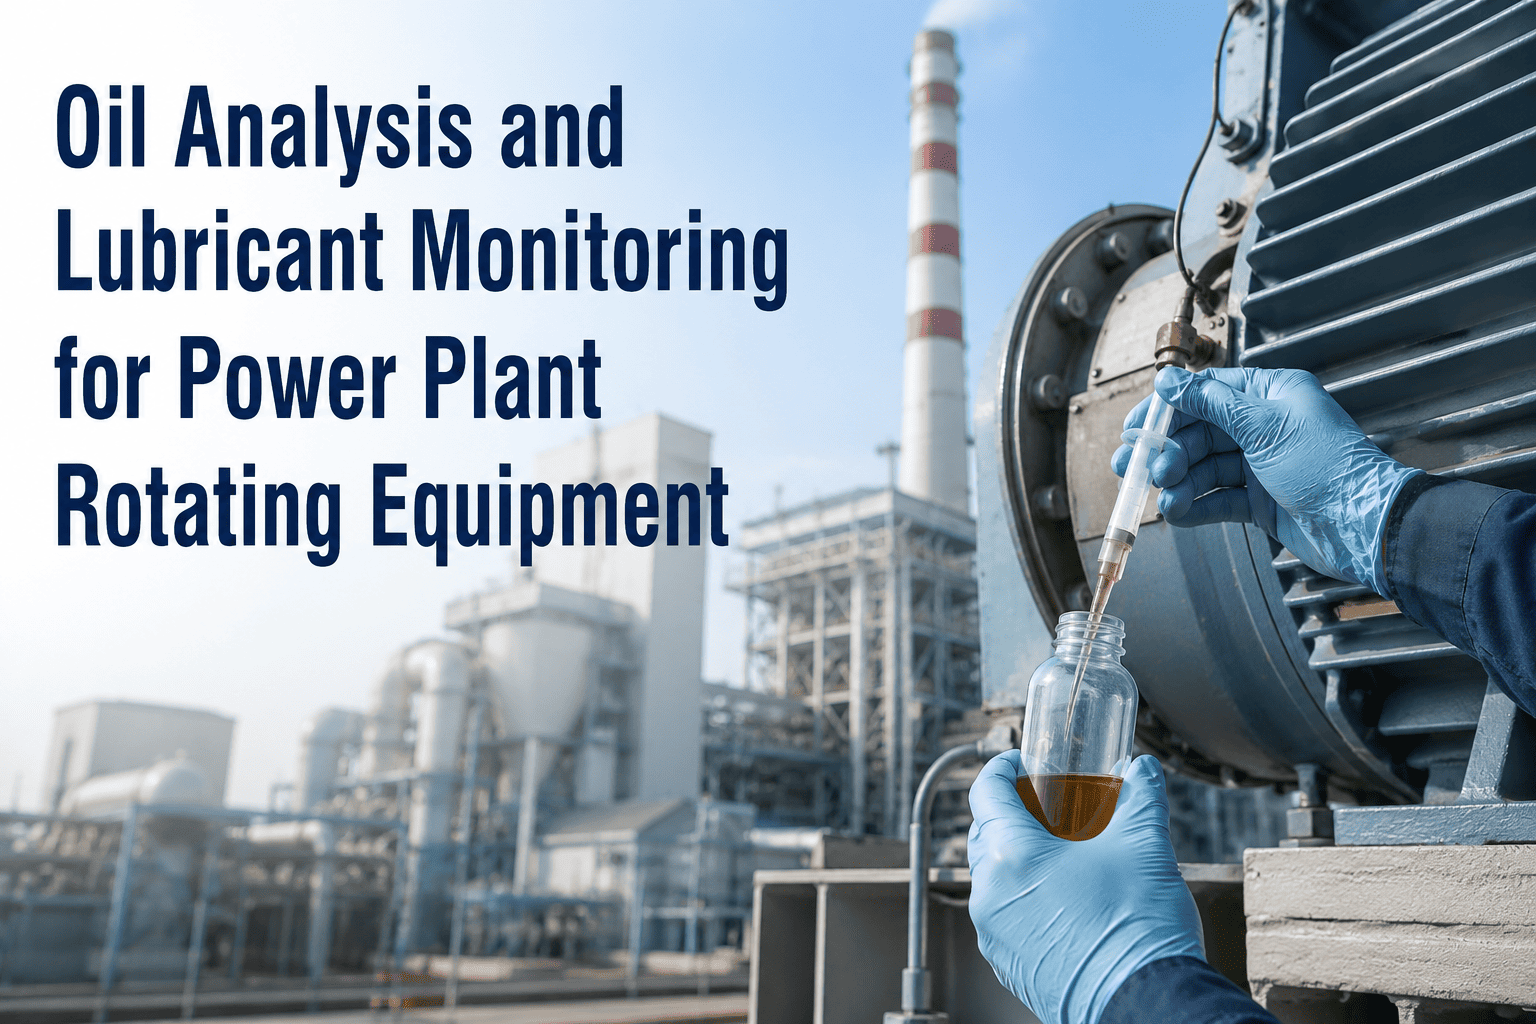
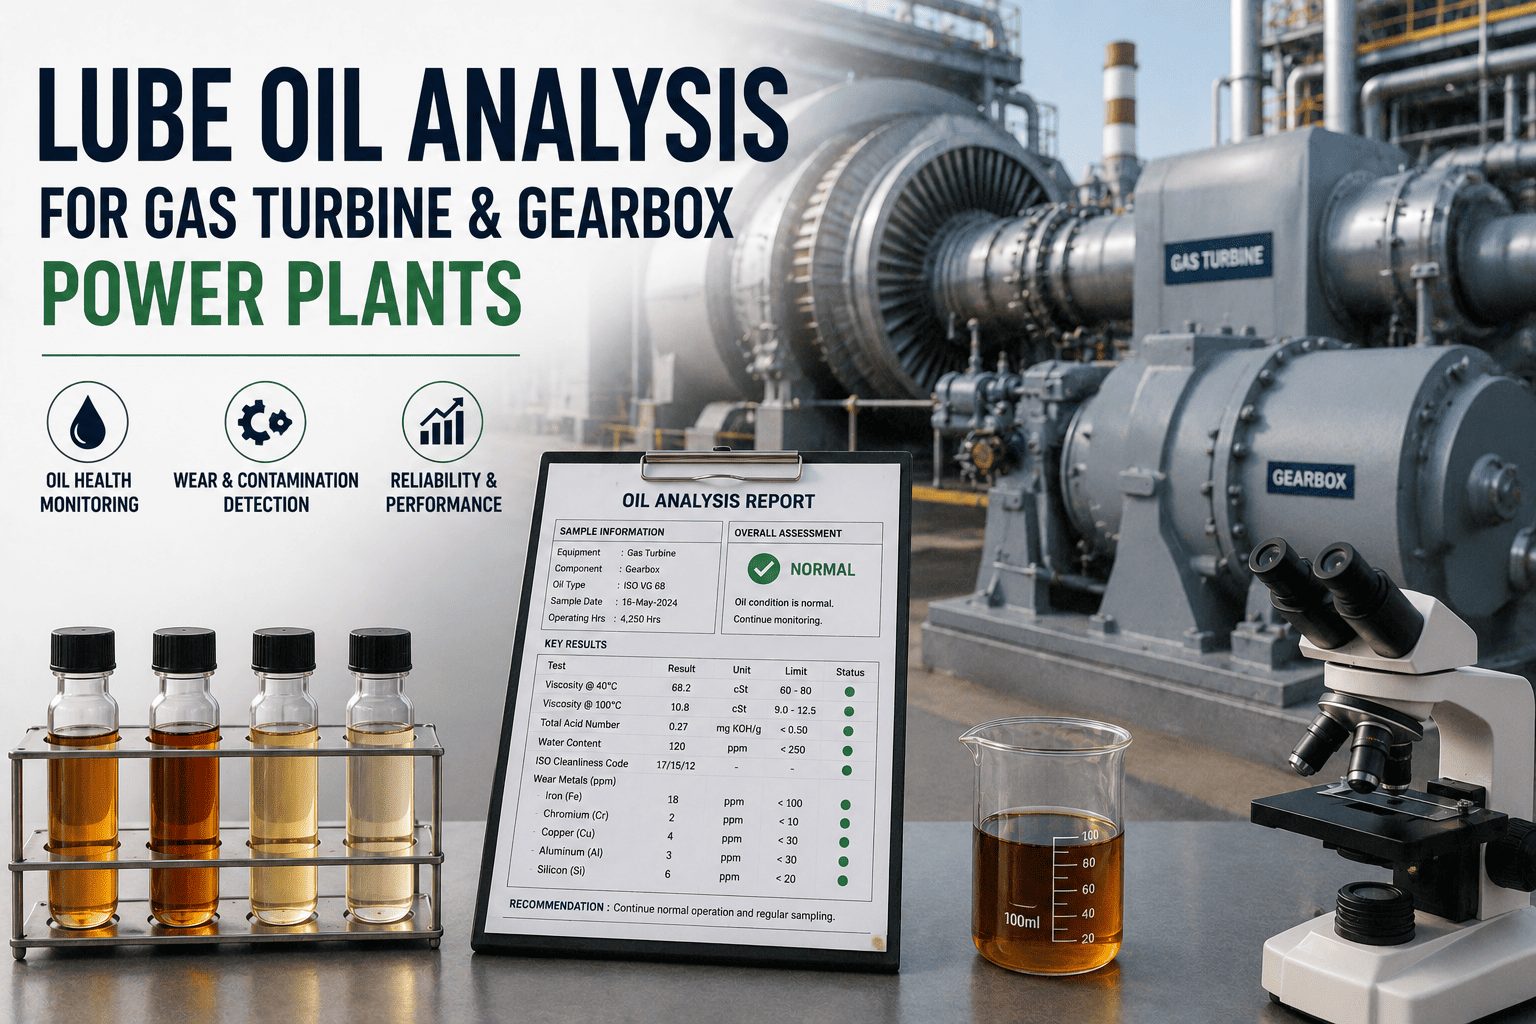
Oil analysis is the closest thing to a blood test that a rotating machine can receive. In power plant turbines, gearboxes, and large centrifugal pumps, the lubricating oil circulates through every bearing surface, seal, and gear mesh — picking up wear particles, contaminants, and chemical breakdown products along the way. A structured oil analysis programme extracts that information at regular sample intervals and converts it into early warning of failures that would otherwise arrive without notice. At a thermal power plant, an unplanned turbine bearing failure costs not just the repair — it costs the forced outage, the replacement power procurement, and the regulatory reporting. OxMaint Predictive Maintenance AI integrates oil analysis sampling schedules, lab result trending, and corrective work order generation so that the intelligence from every sample drives action — not just a report. Book a demo to see how oil analysis workflows are managed in OxMaint.
Predictive Maintenance AI · Reliability Engineering · Rotating Equipment
Oil Analysis and Lubricant Monitoring for Power Plant Rotating Equipment
Detect bearing wear, contamination, viscosity shift, and lubricant degradation in turbines, pumps, and gearboxes before they become failures — using structured oil sampling, lab analysis, and CMMS-integrated corrective workflows.
10×
Earlier fault detection vs vibration alone for early-stage bearing wear
75%
Of lubrication-related failures are preventable with regular oil analysis
$380K
Average avoided cost per prevented turbine bearing replacement at forced outage rates
30–60
Days of advance warning for most bearing and gear failures caught by oil analysis
What Oil Analysis Actually Detects — and When It Matters
Oil analysis is not a single test — it is a panel of tests, each sensitive to a specific failure mode. The value comes from trending multiple parameters over time, not from reading a single sample in isolation. Here is what each test family detects and why it matters in power generation equipment.
What it measures
Ferrous and non-ferrous particle count, particle size distribution, morphology
What it detects
Bearing spalling, gear tooth fatigue, abrasive wear, adhesive wear between rotating surfaces
Key indices
PQ Index (ferrous load), particle count (ISO 4406), RULER for antioxidant depletion
Equipment sensitivity
Turbine journal bearings, gearbox gear mesh, pump thrust bearings
What it measures
Concentration of 20+ elements in the oil (Fe, Cu, Al, Pb, Si, Na, Mg)
What it detects
Bearing cage wear (Cu, Al), gear surface wear (Fe, Cr), coolant ingress (Na, Mg, B), dirt contamination (Si, Al)
Key indices
Rate of change per hour of operation — not absolute value
Equipment sensitivity
Turbine oil systems, gearboxes with bronze bushings, diesel-driven pumps
What it measures
Kinematic viscosity at 40°C and 100°C, viscosity index, TAN, TBN, oxidation FTIR
What it detects
Lubricant degradation, thermal oxidation, additive depletion, mixing with incorrect grade
Key indices
±15% from new oil viscosity = change required. TAN rise >1.0 mg KOH/g = degradation alert
Equipment sensitivity
All turbine oil systems, compressor oils, hydraulic systems
What it measures
Water content (KF), glycol (FTIR), fuel dilution (flash point), particle count and size
What it detects
Seal failures (water ingress), cooler tube leaks (glycol), high-pressure seal bypass (fuel dilution)
Key indices
Water >200 ppm: immediate investigation. Glycol detected: oil change + cooler inspection
Equipment sensitivity
All rotating equipment; especially gearboxes with water coolers and turbine lube oil systems
Sampling Frequency by Equipment Type — The Decision Matrix
Sampling too infrequently misses emerging failures. Sampling too frequently adds cost without proportional benefit. The correct frequency depends on equipment criticality, oil system volume, operating hours, and the equipment's failure history. Use this matrix as your baseline.
| Equipment Type |
Criticality |
Oil Volume |
Sample Interval |
Test Panel |
Action Trigger |
| Steam Turbine (main unit) |
Critical |
5,000–50,000 L |
Monthly |
Full panel: ICP, viscosity, TAN, water, particle count, RULER |
Any single parameter breach |
| Gas Turbine |
Critical |
500–5,000 L |
Monthly |
Full panel + oxidation FTIR + varnish potential |
Varnish potential >40 or TAN >0.5 |
| Boiler Feed Pump (BFP) |
Critical |
20–200 L |
Quarterly |
ICP, viscosity, water, particle count |
Fe >50 ppm or water >200 ppm |
| Cooling Water Pump |
High |
5–50 L |
Quarterly |
ICP, viscosity, water |
Fe rising trend or water >500 ppm |
| Step-Up Transformer (tap changer) |
Critical |
Variable |
Annually + after fault events |
DGA, moisture, interfacial tension, breakdown voltage |
Combustible gas ratio or moisture >15 ppm |
| Gearbox (main drive) |
High |
50–500 L |
Quarterly |
ICP, particle count, viscosity, water, TAN |
Fe + Cu rising trend or particle count step change |
| ID/FD Fan Bearings |
Medium |
Grease — sample by plug |
6-monthly |
ICP, consistency, water, oxidation |
Fe >200 ppm in grease or dark colour change |
| Condensate Extraction Pump |
High |
10–100 L |
Quarterly |
ICP, viscosity, water |
Water >200 ppm (condensate ingress risk) |
OxMaint automates oil analysis sampling schedules, captures lab results against each asset, triggers corrective work orders when parameters breach thresholds, and tracks trend history over the full asset lifecycle.
Turbine Oil Degradation — The Varnish Problem Nobody Budgets For
Varnish formation is the single most damaging lubricant degradation failure mode in modern gas and steam turbines — and the one most commonly missed by basic oil analysis panels. Understanding the varnish failure chain is essential to designing an effective oil monitoring programme.
01
Thermal and Oxidative Stress
High-temperature turbine operation breaks polyol ester and mineral base oil molecules into degradation products. Antioxidant additives are consumed protecting the base oil — RULER test tracks remaining antioxidant life.
↓
02
Solubility Limit Reached
Oxidation products exceed oil solubility and begin to precipitate as soft contaminants (gel-like deposits). MPC (Membrane Patch Colorimetry) test detects insoluble soft contaminants before they deposit on surfaces.
↓
03
Varnish Deposition
Soft contaminants adhere to servo valve spools, bearing surfaces, and oil cooler passages. Servo valves begin to stick and respond slowly. Oil cooler efficiency drops. The deposits are invisible to standard particle counters.
↓
04
Servo Valve and Bearing Failure
Stuck servo valves cause turbine control response failures. Varnished bearing surfaces operate with reduced oil film thickness, accelerating bearing wear. Forced outage and full oil system flush required — typically $200K+ in total event cost.
Prevention: Add MPC and RULER tests to monthly turbine oil analysis. Varnish potential score above 40 (on 100-point scale) triggers immediate oil conditioning or controlled flush before servo valve sticking begins.
Interpreting Oil Analysis Results — What Action Does Each Finding Require
Oil analysis generates data. The value is in the corrective action that data triggers. This interpretation matrix maps common findings to their required response — the framework your maintenance team needs to act on results, not just file them.
Fe rising >10 ppm/sample trend
Bearing or gear surface wear accelerating
Increase sample frequency; schedule vibration check; plan bearing inspection at next opportunity
High
Water > 500 ppm
Seal failure or cooler leak
Offline filtration (vacuum dehydration) immediately; inspect seals and cooler; resample after 1 week
Urgent
Glycol detected
Cooling water system tube leak into oil
Drain oil system immediately; identify and repair cooler tube leak; flush system; refill with new oil
Urgent
Viscosity ±15% from spec
Oxidative thickening, thermal thinning, or wrong oil top-up
Identify cause; if oxidation: oil change. If incorrect top-up: drain and refill with correct grade
High
Si > 20 ppm rising trend
Airborne dust ingestion through breather or seal
Inspect and replace breather filter; check sump sealing; check filter bypass indicators
Monitor
TAN > 1.0 mg KOH/g
Lubricant oxidative degradation; additive depletion
Plan oil change at next planned outage; increase sample frequency to monthly until changed
High
MPC varnish potential > 40
Soft contaminant accumulation; varnish precursor
Deploy electrostatic or depth filtration; plan controlled oil flush if score reaches 60+
High
Frequently Asked Questions
How do I set oil analysis alarm limits for power plant rotating equipment?
Alarm limits should be set as rate-of-change thresholds, not absolute values. Establish a baseline from the first 3 samples under normal operating conditions, then set alert thresholds at 2× baseline rate of increase for wear metals (Fe, Cu, Al). Absolute limits apply to contamination (water, glycol, particle count ISO code) where any step-change requires investigation regardless of baseline.
OxMaint lets you configure both rate-of-change and absolute thresholds per asset and generates work orders automatically at breach.
What is the best practice for taking oil samples from turbine lube oil systems?
Sample from a live zone in the return line — not from the drain point or the tank top. Use a dedicated sampling valve that draws from the mid-stream flow, not from a stagnant dead leg. Flush 3× the sample line volume before collecting the sample to avoid collecting oil that has sat in the sampling port between intervals. Label samples with equipment ID, operating hours since last oil change, and any recent top-up volumes.
Book a demo to see how OxMaint sampling work orders capture this data at point of collection.
How does oil analysis compare to vibration analysis for bearing fault detection in power plants?
Oil analysis detects material loss from bearing surfaces 30–60 days before vibration analysis shows a measurable change — because wear particles are released into the oil before the dimensional change is large enough to alter vibration signature. The two technologies are complementary: oil analysis gives early warning and contamination insight; vibration analysis confirms fault location and severity. Power plant reliability programmes that use both together catch more faults earlier than either technology alone.
How does a CMMS integrate with an oil analysis programme in power generation?
A CMMS like
OxMaint schedules sampling work orders, captures lab results against the asset record, trends parameters over time, generates corrective work orders at threshold breach, and maintains the complete oil history across oil changes and top-ups. This replaces scattered lab PDF reports with an integrated asset intelligence record that informs both maintenance planning and capital replacement decisions.
When should turbine oil be changed rather than reconditioned?
Reconditioning (filtration, dehydration, additive replenishment) is appropriate when contamination is the primary issue and base oil quality is still within specification. Oil change is required when TAN exceeds 1.5 mg KOH/g, viscosity cannot be restored to within spec, varnish potential is above 60 on MPC, or when glycol or significant fuel contamination is confirmed. Base oil oxidation is irreversible — reconditioning cannot restore degraded base stock to its original performance characteristics.
Turn Every Oil Sample Into a Maintenance Decision
OxMaint Predictive Maintenance AI schedules oil sampling, captures lab results, trends parameters across every rotating asset in your power plant, and converts threshold breaches into corrective work orders automatically — closing the gap between oil analysis data and maintenance action.