A single feedwater heater operating at 80% of design thermal effectiveness costs a 500 MW thermal power plant between 0.4% and 0.9% in heat rate degradation — equivalent to $600,000 to $1.35 million in annual fuel costs for a unit that appears to be running normally by every operator dashboard indicator. Feedwater heaters are the thermal cycle's silent efficiency killers: they degrade gradually through tube fouling, condensate subcooling, and drain cascade failures that are invisible to the operations team until a heat rate audit or periodic inspection uncovers weeks of avoidable losses. AI-based performance monitoring changes that by computing real-time thermal effectiveness for each heater in the regenerative cycle and triggering maintenance action the moment performance diverges from the design model — not months later during the next scheduled outage. This guide covers the performance metrics, degradation mechanisms, and CMMS integration logic that turn feedwater heater monitoring from a quarterly engineering exercise into a continuous efficiency protection program — and shows how OxMaint's asset health monitoring platform is used by power plant engineering teams to close the gap between feedwater heater design efficiency and operating efficiency.
Thermal Systems · AI Monitoring · Feedwater Heater Reliability
Your Feedwater Heaters Are Degrading. The Dashboard Won't Tell You.
Terminal Temperature Difference, Drain Cooler Approach, and tube fouling factors tell the story of feedwater heater health — but only if someone is computing them continuously. OxMaint does it automatically, for every heater, every hour.
0.9%
Maximum heat rate penalty from a single underperforming feedwater heater on a 500 MW unit
$1.35M
Annualized fuel cost of that 0.9% heat rate deficit at $3.50/MMBTU
6 wks
Average time before degradation is caught without real-time performance monitoring
48 hrs
Detection lead time when AI TTD monitoring is active and thresholds are properly set
The Three Performance Metrics That Define Feedwater Heater Health
Every feedwater heater degradation mechanism — tube fouling, shell-side steam venting failure, drain cascade bypass, tube bundle leakage — manifests in one or more of three calculable performance metrics. OxMaint computes all three continuously from DCS process measurements and tracks their deviation from the design curve at each load point.
Primary Metric
Terminal Temperature Difference (TTD)
TTD = Tsat,extraction steam − TFW outlet
TTD measures how close the feedwater outlet temperature comes to the saturation temperature of the extraction steam. A low (or negative) TTD indicates a healthy heater with effective condensing duty. A rising TTD signals tube fouling, reduced steam flow, or excessive drain subcooling — and directly translates to higher boiler steam demand and worse heat rate. Design TTD for modern high-pressure heaters is typically −3°F to +5°F. A TTD of +15°F triggers an immediate investigation work order in OxMaint.
Alert threshold: Design TTD + 8°F
Secondary Metric
Drain Cooler Approach (DCA)
DCA = Tdrain outlet − TFW inlet
DCA measures the effectiveness of the drain cooler section in recovering heat from condensed extraction steam before it cascades to the next lower-pressure heater. A rising DCA means the drain cooler is either fouled, undersized due to increased flow, or bypassed — and feedwater entering the condensate stream carries less heat, reducing cycle efficiency. Design DCA is typically 10–15°F. DCA above 20°F combined with elevated TTD confirms a tube fouling condition.
Alert threshold: Design DCA + 8°F
Secondary Metric
Heat Transfer Effectiveness (%)
η = Qactual / Qdesign at current conditions
Effectiveness compares the actual heat transfer rate to what the heater should be delivering at the current extraction steam flow, feedwater flow, and inlet conditions. OxMaint calculates this by solving the energy balance across the heater using live DCS data and comparing to the vendor heat balance model loaded into the system. Effectiveness below 88% on a high-pressure heater generates a work order for engineering review. Below 80% triggers an urgent inspection WO.
Alert threshold: Below 88% effectiveness
Degradation Mechanisms: What Causes Each Metric to Drift
Each performance metric drifts for specific physical reasons. Knowing the mechanism behind the drift tells the maintenance team what to inspect and where — turning a numeric alert into a targeted corrective action rather than an unstructured investigation.
TTD Rising
Tube-side fouling
Scale deposition on the internal tube surface (iron oxide, calcium carbonate, copper deposits from condensate system) reduces the overall heat transfer coefficient. The fouling layer acts as an insulating barrier between the hot condensing steam shell side and the feedwater tube side. OxMaint tracks the progressive TTD rise rate — a rapid rise (over 2 days) suggests a new fouling source; a slow rise (over 3 weeks) indicates normal surface deposit accumulation.
TTD Rising
Air/non-condensable gas accumulation
Non-condensable gases (oxygen, carbon dioxide, nitrogen) that enter the shell side through vent valve failure, condenser air in-leakage, or dissolved gas carry-over accumulate in the top of the shell and create a gas blanketing effect over the tube bundle. This reduces the effective condensing surface area and drives TTD up rapidly — a characteristic rapid TTD rise that should be differentiated from slow fouling by the OxMaint trend analysis engine.
DCA Rising
Drain cooler fouling or cascade valve failure
Shell-side fouling in the drain cooler section, or a partially open drain bypass valve, allows drain to exit at higher-than-design temperature. OxMaint correlates the DCA rise with drain temperature and cascade valve position data from the DCS. If the drain temperature is high but the cascade valve is confirmed closed, the cause is fouling; if the cascade valve shows intermediate position, the work order directs the technician to the valve actuator and seat first.
Effectiveness Dropping
Tube bundle leakage
Tube bundle leaks allow shell-side condensate to mix with feedwater (or vice versa, depending on pressure differential direction) and bypass the heating process entirely. OxMaint detects this through the combination of a dropping effectiveness metric, elevated feedwater flow out versus condensate extraction steam flow in, and water chemistry alerts from the feedwater quality instrumentation. When tube leakage is suspected, OxMaint auto-generates an urgent inspection WO with a tube bundle hydrostatic test procedure pre-attached.
Effectiveness Dropping
Extraction steam flow loss
Partial closure of extraction steam isolation valves, turbine blade fouling reducing extraction pressure, or control system logic errors can reduce the extraction steam flow to a heater below design. OxMaint detects this through the combination of reduced effectiveness and a lower-than-expected extraction steam temperature at the heater inlet — differentiating it from fouling (where extraction steam flow is normal but heat transfer is impeded) to direct the investigation to the steam supply rather than the heater itself.
Real-time thermal performance
Know Your Feedwater Heater TTD and DCA Right Now — Not in Next Quarter's Heat Rate Audit.
OxMaint computes TTD, DCA, and heat transfer effectiveness for every heater in your regenerative cycle, every hour, from your existing DCS measurements. When performance drifts, a work order is created before the efficiency loss accumulates to a material cost.
OxMaint Monitoring Dashboard: What Engineers See in Real Time
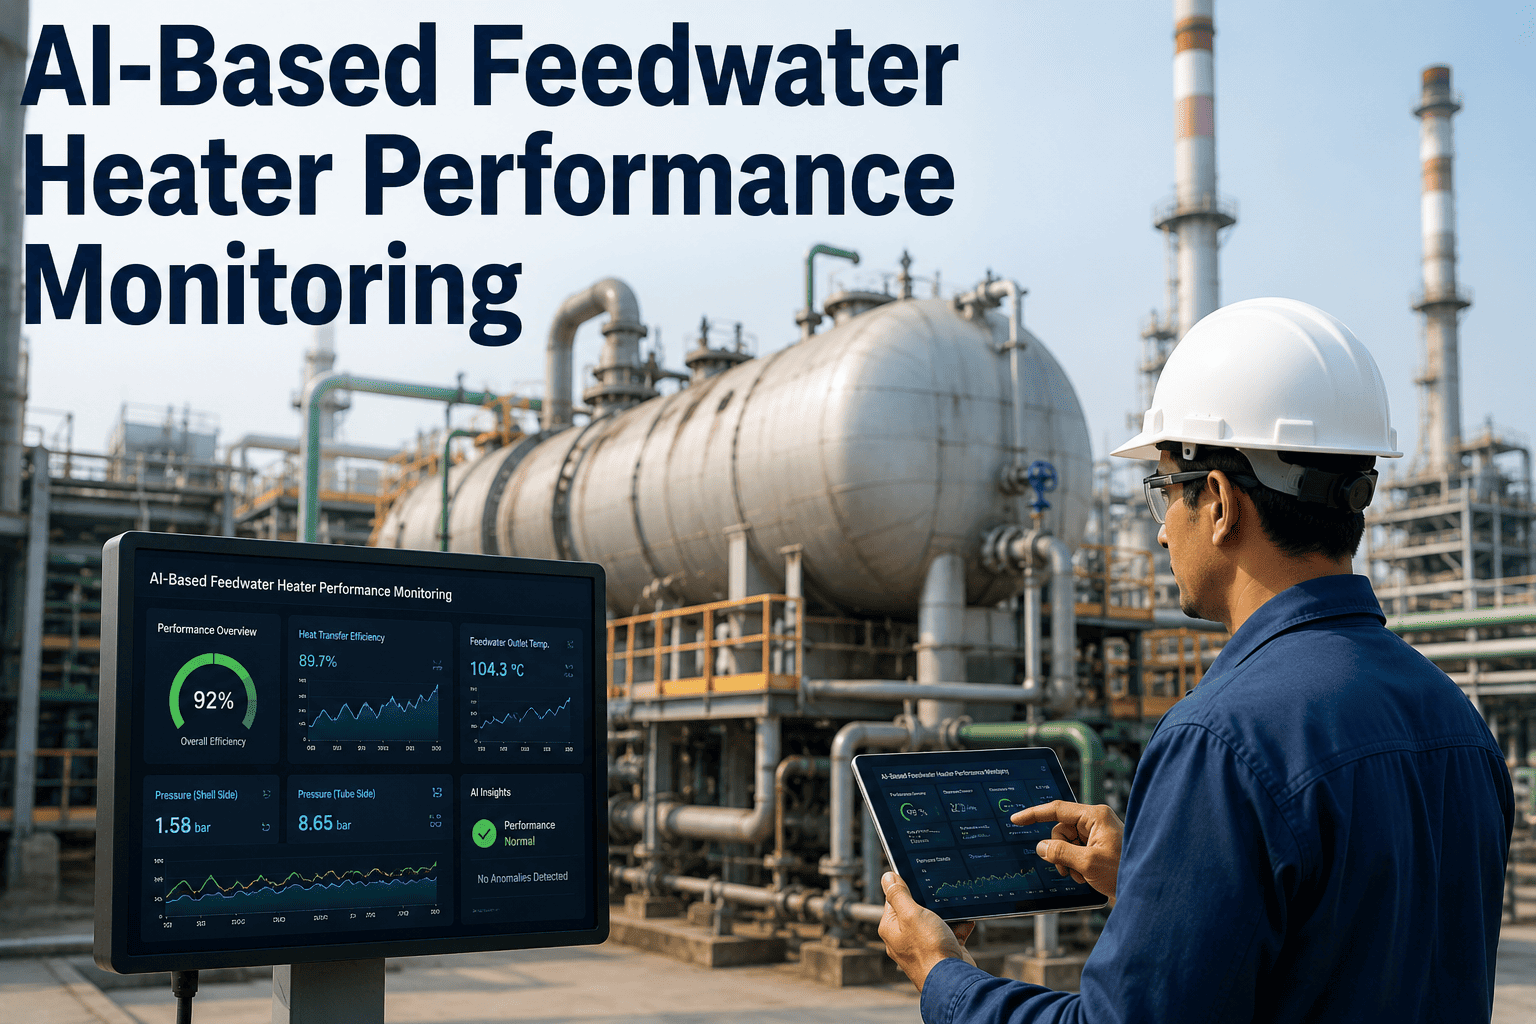
The OxMaint feedwater heater monitoring dashboard gives plant engineers a single view of the entire regenerative cycle performance — from LP heater train through deaerator to HP heaters — with heat rate impact quantified for each degraded heater in real time.
Regenerative Cycle Performance Monitor
Last updated: 4 minutes ago
LP Heater 1
TTD: +3.2°F
DCA: 12.1°F
Eff: 96.4%
Normal
LP Heater 2
TTD: +4.8°F
DCA: 13.5°F
Eff: 94.1%
Normal
LP Heater 3
TTD: +11.2°F
DCA: 18.9°F
Eff: 87.3%
WO-2026-1184 Open
Deaerator
O₂: 7 ppb
Level: Normal
Eff: 98.2%
Normal
HP Heater 1
TTD: +2.1°F
DCA: 11.2°F
Eff: 97.8%
Normal
HP Heater 2
TTD: +16.8°F
DCA: 22.4°F
Eff: 79.1%
P1 WO Created
Total cycle heat rate impact from degraded heaters:
+18.4 BTU/kWh (0.19%) · Estimated fuel cost: $248,000/yr
Frequently Asked Questions
Q1 What DCS measurements does OxMaint need to compute TTD, DCA, and thermal effectiveness?
The standard measurement set for a feedwater heater with a drain cooler section is: feedwater inlet and outlet temperature, extraction steam temperature at the heater inlet, condensate drain outlet temperature, feedwater flow rate, and extraction steam pressure (to calculate saturation temperature). These measurements are present in essentially all modern thermal plant DCS systems, and OxMaint connects to them via OPC-UA, Modbus TCP, or historian API. No additional instrumentation is required for plants running standard ASME PTC 12.1 feedwater heater measurements.
Start a free trial to run a measurement completeness check against your DCS tag list.
Q2 How does load correction work for feedwater heater performance metrics?
TTD and DCA are load-dependent — a heater operating at 50% load has different design performance characteristics than at 100% load, because extraction steam flow, feedwater flow, and temperature profiles all change. OxMaint stores the vendor design heat balance data across the full load range (typically 40%, 60%, 80%, and 100% load points) and interpolates the design values at the current load before computing the deviation. This prevents false alerts during load ramps and correctly identifies a heater that is actually degrading at 70% load versus one that simply shows a different TTD characteristic because the design curve is non-linear. This load-normalized comparison is one of the capabilities that separates OxMaint's implementation from simple fixed-threshold monitoring systems.
Q3 How quickly can a fouled feedwater heater tube bundle be cleaned during a maintenance window?
Hydro-jetting of feedwater heater tube bundles (the standard cleaning method for iron oxide and calcium scale) typically takes 6 to 14 hours for a medium-sized HP heater, depending on tube count and fouling severity. Chemical cleaning for tenacious copper deposits or biofouling can take 24 to 48 hours with additional neutralization and rinse time. OxMaint's maintenance planning module helps schedule cleaning windows during planned unit outages rather than emergency windows, which reduces total outage time by allowing cleaning crew pre-mobilization, chemical pre-staging, and parallel tasks to be sequenced in advance. Early TTD detection gives an average 3- to 6-week lead time before performance deteriorates to emergency-outage levels.
Q4 Can OxMaint quantify the heat rate impact of a degraded feedwater heater in dollar terms?
Yes — and this is one of the most important capabilities for making a business case for maintenance prioritization. OxMaint uses the measured thermal effectiveness deviation, the unit heat balance model, and the current fuel cost input to compute a real-time dollar-per-day efficiency loss for each degraded heater. When the HP Heater 2 TTD alert fires, the work order includes not just the technical finding but a financial impact estimate — for example, "$1,850/day in additional fuel cost at current load and fuel price." This connects the maintenance decision directly to the financial consequence, and gives plant managers and trading desk teams the information they need to prioritize planned outages when fuel cost exposure justifies the decision.
Book a demo to see this calculation configured against your unit's heat balance.
Q5 How does OxMaint handle a feedwater heater that has been bypassed from service?
When a feedwater heater is taken out of service and bypassed — a not uncommon operating condition for tube bundle repairs — OxMaint automatically switches the affected heater to "bypassed" mode in the asset hierarchy, suppresses the performance alerts for that unit, and activates a bypass heat rate penalty calculation that quantifies the efficiency loss from the reduced regenerative cycle. This bypass impact figure is updated in real time and included in the daily plant performance summary, giving the operations team a continuous financial argument for restoring the heater to service as quickly as possible. OxMaint also tracks the bypass duration against the maintenance team's committed restoration date and escalates if the restoration work order is falling behind schedule.
Thermal efficiency, protected
Every Degree of TTD Above Design Is Costing You Money. OxMaint Tells You the Exact Amount.
OxMaint's feedwater heater monitoring platform computes TTD, DCA, and thermal effectiveness for your full regenerative cycle in real time — quantifying the financial impact of each degraded heater and creating targeted maintenance work orders before efficiency losses accumulate to material levels. Purpose-built for power generation teams who treat heat rate as a maintainable asset, not a quarterly reporting metric.