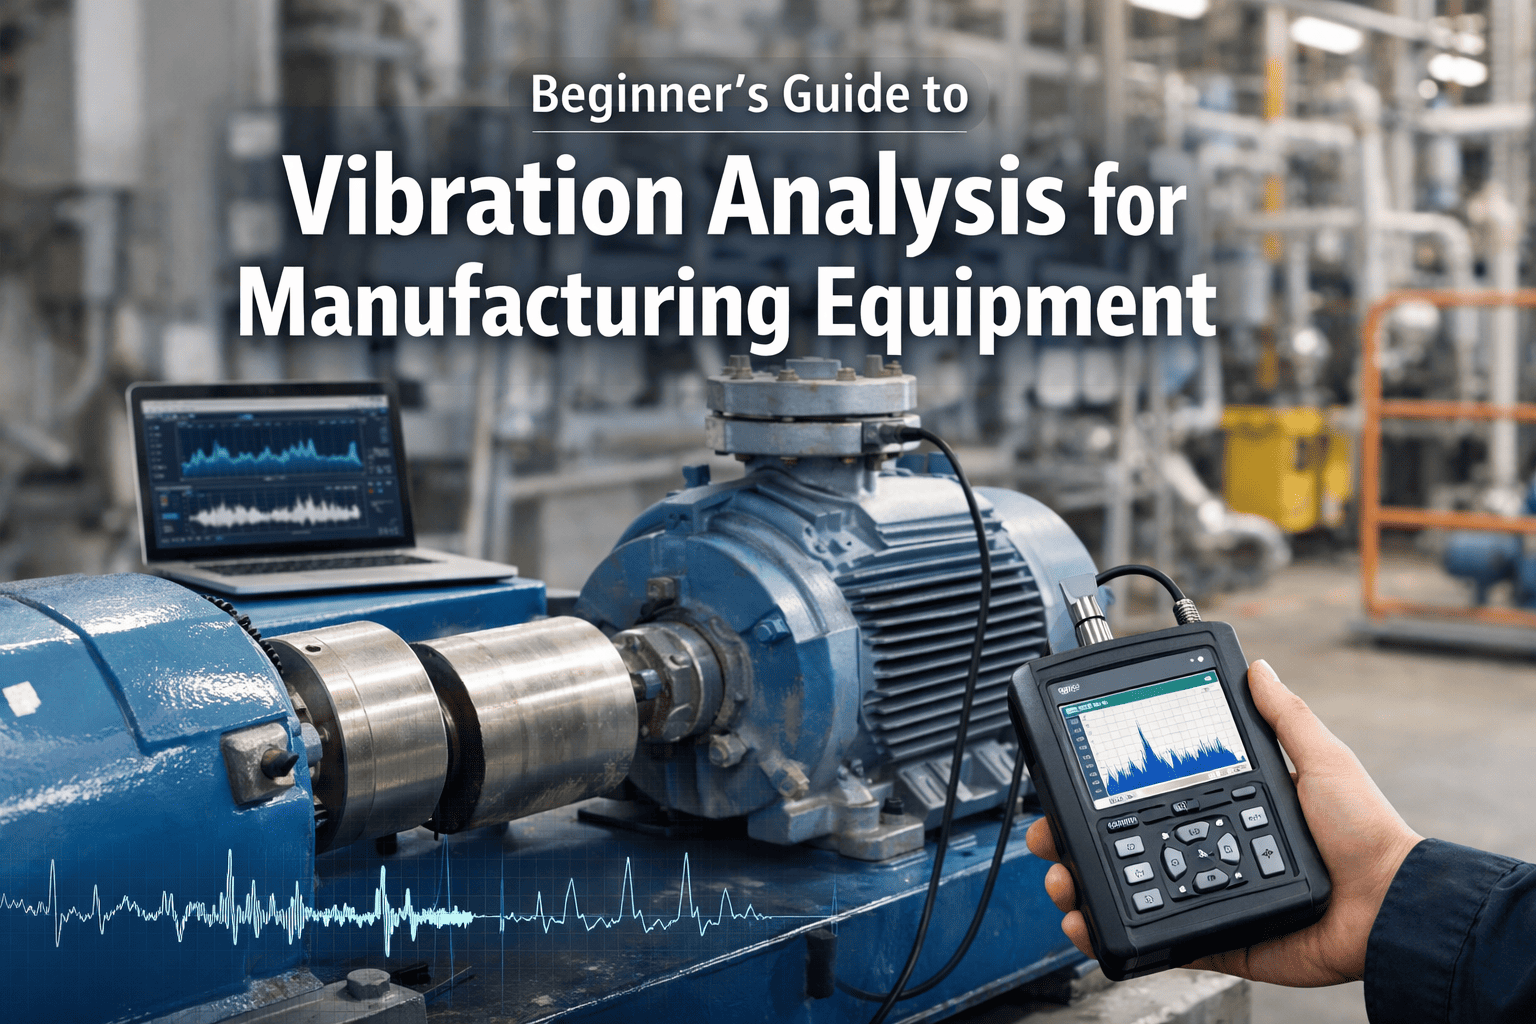
A bearing that is 6 weeks from catastrophic failure is already screaming — you just cannot hear it without the right tools. Vibration analysis is the diagnostic method that translates mechanical stress, wear, and misalignment into readable data patterns, giving maintenance engineers in manufacturing plants the ability to predict and prevent equipment failures before they stop a production line. From motors and pumps to gearboxes and compressors, every rotating asset in your facility carries a unique vibration signature — and deviations from that signature are early warnings that most plants ignore until it is too late. This guide covers the complete foundation: what vibration analysis measures, how to read fault signatures, which sensors to use, and how to close the gap between a detected anomaly and a completed repair using a connected CMMS like OXmaint.
Vibration Analysis — Beginner to Advanced
Every Rotating Machine Tells You When It Is About to Fail
Vibration patterns carry fault signatures detectable weeks before mechanical breakdown. Here is how to read them.
Live FFT Spectrum — Healthy Bearing
0 Hz1× RPM2×3×4×
4–8 wks
Advance warning for bearing faults via vibration
40–50%
Of all rotating equipment failures — bearing origin
ISO 10816
Global standard for machinery vibration severity
30%
Fewer bearing replacements with condition-based monitoring
The Three Measurement Parameters
What Vibration Analysis Actually Measures — and Why Each Parameter Matters
Vibration is not a single number. Three distinct parameters describe the full mechanical picture of a rotating asset, and each one reveals a different layer of fault information.
Displacement
µm (micrometres) — peak-to-peak
Physical movement of the shaft or housing from its centreline. Large displacement at low frequency indicates severe mechanical looseness, shaft bowing, or critical imbalance.
Best for: Low-speed equipment, journal bearings, shaft alignment checks, slow rotating shafts under 600 RPM
Velocity
mm/s RMS — most widely used
Rate of change in displacement — the most energy-relevant parameter for machinery health. ISO 10816 uses velocity RMS as its primary severity metric for most industrial machines.
Best for: Motors, pumps, fans, gearboxes — general-purpose severity assessment across the most common manufacturing assets
Acceleration
g (gravitational units) — high freq
High freq · 1,000–20,000 Hz
The force component — most sensitive to high-frequency events like rolling element bearing defects, gear tooth impacts, and cavitation. Detects early-stage sub-surface faults before they become structurally significant.
Best for: Rolling element bearings, gear mesh analysis, high-speed machinery above 3,600 RPM, early fault detection before damage propagates
Fault Signature Library
How to Read Vibration Fault Signatures: The 4 Most Common Manufacturing Faults
Each mechanical fault produces a unique pattern in the frequency spectrum. Once you know what to look for, a spectrum plot tells you exactly what is wrong before any physical damage is visible.
Frequency Spectrum Pattern
CauseUnequal mass distribution around the shaft rotational axis — common after repair, wear, or material buildup on fan blades
DirectionRadial (horizontal and vertical) — rarely axial unless coupled with misalignment
ActionDynamic balancing on the machine or in a balancing rig
Detection LeadDetectable immediately — amplitude rises proportionally with speed squared
Frequency Spectrum Pattern
CauseAngular or parallel misalignment between coupled shafts — from thermal growth, pipe strain, soft foot, or improper installation
DirectionHigh axial vibration is the key indicator — angular misalignment especially prominent in axial direction at 1× and 2×
ActionLaser shaft alignment or dial indicator correction; check for soft foot before aligning
Detection LeadWeeks to months — worsens with thermal cycling and coupling wear
Frequency Spectrum Pattern
CauseSub-surface fatigue cracks on inner race (BPFI), outer race (BPFO), or rolling element (BSF) — each mathematically calculable from bearing geometry and RPM
DirectionPrimarily radial — characteristic frequencies appear as sidebands around bearing defect frequencies at non-synchronous values
ActionPlan bearing replacement within the detected fault lead window — typically 4–8 weeks from first signature appearance
Detection Lead4–8 weeks — the most valuable early warning window in rotating equipment maintenance
Frequency Spectrum Pattern
CauseLoose bearing housing bolts, worn bearing fits, cracked or loose base frame, or deteriorated grout — structural looseness creates multiple harmonics or sub-harmonics of running speed
DirectionTypically vertical — looseness allows movement in the direction of gravity. Rich harmonic content (3rd, 4th, 5th harmonics) is the defining pattern
ActionInspect and torque all mounting hardware; check base frame integrity and grout condition
Detection LeadDetectable early — but worsens rapidly; loose structure accelerates bearing wear
OXmaint + Vibration Monitoring
Detected a Fault Signature? OXmaint Turns It Into a Repair Before the Next Shift
Vibration analysis without a closed maintenance loop is just data collection. OXmaint automatically generates prioritized work orders from vibration thresholds — with fault type, sensor readings, and recommended action pre-populated. The bearing does not wait for you to check a dashboard.
Sensor Selection
Choosing the Right Vibration Sensor for Your Equipment
Sensor selection is the most important hardware decision in a vibration monitoring program. The wrong sensor on an asset gives you data — but not the right data.
| Sensor Type |
Measures |
Frequency Range |
Best Asset Applications |
Limitation |
| Accelerometer (ICP/IEPE) |
Acceleration (g) |
0.5 Hz – 20 kHz |
Rolling element bearings, gearboxes, high-speed motors, compressors |
Less sensitive to very low frequency events below 1 Hz |
| Velocity Transducer |
Velocity (mm/s) |
10 Hz – 1,000 Hz |
General-purpose motors, fans, pumps — ISO 10816 measurements |
Moving coil design has fragility concerns in high-vibration environments |
| Eddy Current Proximity Probe |
Displacement (µm) |
0 – 10,000 Hz |
Journal bearings, turbine shafts, large rotating machinery with fluid-film bearings |
Requires permanent installation; measures shaft motion relative to bearing housing |
| MEMS Accelerometer |
Acceleration (g) |
0 – 5,000 Hz |
Wireless IoT monitoring, low-to-mid speed equipment, distributed sensor networks |
Lower sensitivity than ICP sensors; not suited for high-frequency bearing analysis |
| Ultrasonic (Acoustic Emission) |
AE (dBµV) |
50 kHz – 1 MHz |
Very early bearing fault detection, slow-speed bearings, lubrication monitoring |
Highly specialized; requires separate signal processing from standard vibration systems |
Global Standards
ISO Vibration Standards Every Manufacturing Engineer Should Know
ISO standards define the severity thresholds that tell you whether a vibration reading is acceptable, requires attention, or demands immediate action. These are the benchmarks used globally.
ISO 10816
Mechanical Vibration — Machine Evaluation on Non-Rotating Parts
Velocity RMS (mm/s) measured on bearing housings and machine structure
Zone A: New machines · Under 2.3 mm/s · Good
Zone B: Long-term operation · 2.3–4.5 mm/s · Acceptable
Zone C: Warning threshold · 4.5–7.1 mm/s · Investigate
Zone D: Danger zone · Above 7.1 mm/s · Shut down risk
ISO 13373
Condition Monitoring — Vibration Measurement Procedures
Defines data collection procedures, measurement point locations, transducer mounting, and data recording formats
Specifies radial, axial, and vertical measurement positions per machine class
Defines minimum averaging requirements for reliable FFT spectrum collection
Covers route-based and continuous monitoring program design
Foundation for any audit-defensible vibration monitoring program
ISO 20816
Updated Machinery Vibration — Supersedes 10816 Series
Expanded criteria covering wind turbines, industrial machines, pumps, compressors, and marine drive systems
Part 1: General guidelines for all rotating machinery
Part 3: Industrial machines — 15 kW and above
Part 7: Rotordynamic pumps — specific pump severity classes
More asset-class-specific than the ISO 10816 series it replaces
Setup Roadmap
How to Set Up Vibration Monitoring on Your Manufacturing Equipment
A structured five-step process takes you from zero vibration data to a predictive maintenance program that reliably catches faults weeks ahead of failure.
Define Measurement Points and Mount Sensors
Each bearing location requires a measurement point in radial horizontal, radial vertical, and axial directions — especially for coupled shafts. Use stud-mounted accelerometers for highest frequency accuracy. Magnetic mounts are acceptable for route-based portable measurements but reduce high-frequency fidelity. Mark and label all measurement points permanently.
Critical: Measurement point consistency is more important than sensor quality. Inconsistent placement destroys trend comparison.
Collect Baseline Data Under Stable Operating Conditions
Collect baseline measurements at the same load, speed, and temperature conditions for each asset. Take at minimum five readings spaced over two weeks to account for process variability. Record the overall velocity RMS and capture a full FFT spectrum at each point. This baseline is the reference fingerprint for all future trend comparisons.
Never set alert thresholds before collecting baseline. ISO alert thresholds are starting points — your asset's actual baseline may differ from the standard.
Configure Alert Thresholds by Asset Class and Severity Zone
Set warning and alarm thresholds at typically 150% and 250% of baseline RMS respectively. For bearing defect frequencies (BPFI, BPFO, BSF), calculate expected fault frequencies from the bearing manufacturer's geometry data and configure spectral band alarms around those specific frequencies to catch early-stage bearing faults the overall RMS reading will miss.
Spectral band alarms catch bearing faults 2–4 weeks earlier than overall RMS alarms — they detect amplitude rise at specific fault frequencies before the global reading climbs.
Connect Sensor Data to CMMS for Automatic Work Order Generation
Vibration data that lives only in an analyzer or standalone dashboard does not generate maintenance actions. Connect your vibration monitoring system to OXmaint via REST API so that every threshold breach automatically creates a prioritized work order — with fault type, sensor reading, asset ID, and recommended action pre-populated. The technician receives a mobile notification before the next manual round would have even started.
The average gap between fault detection and repair initiation is 4.6 days when findings go into email or spreadsheets. CMMS integration collapses this to under 1 hour.
Build Trend History and Refine Thresholds Over Time
After 90 days of operation, your trend data reveals asset-specific degradation rates, the typical time between fault signature appearance and failure, and which assets need more frequent measurement collection. Refine your thresholds based on this data. Assets with documented failure histories allow you to back-calculate the lead time your current thresholds would have provided — and tighten them further.
Programs that review and refine thresholds every 6 months achieve 60–70% shorter fault-to-failure lead times than programs that configure thresholds once and never revisit them.
4–8 wks
Bearing fault detection lead time via accelerometer spectral band alarms vs. days using overall RMS alone
70–75%
Reduction in unplanned breakdowns for manufacturing plants with continuous vibration monitoring programs
30%
Fewer unnecessary bearing replacements when condition-based replacement decisions replace calendar-based PM schedules
Common Questions
Frequently Asked Questions: Vibration Analysis for Manufacturing Equipment
What is the difference between vibration analysis and vibration monitoring?
Vibration monitoring is the continuous or periodic collection of vibration measurements from sensors attached to equipment. Vibration analysis is the interpretation of that data — identifying fault signatures, trending amplitude changes, and diagnosing the root cause of deviations. Monitoring without analysis produces data but no decisions. Most
modern CMMS platforms like OXmaint connect the two by automatically flagging threshold breaches and generating work orders so the analysis step triggers a maintenance action rather than just a report.
How often should I collect vibration measurements on manufacturing equipment?
Collection frequency should match the asset's criticality and historical failure rate. High-criticality assets — large motors, main compressors, critical pump trains — benefit from continuous online monitoring. Secondary equipment can run monthly route-based portable measurements. A practical starting point: critical assets continuously or weekly, important assets monthly, general assets quarterly. As you build failure history,
review your frequency strategy every six months and adjust based on how quickly faults are propagating on your specific equipment.
Can I use a smartphone accelerometer for vibration analysis on manufacturing equipment?
Smartphone accelerometers have frequency ranges limited to roughly 400 Hz with poor sensitivity below 10 mg — insufficient for detecting bearing defect frequencies that typically appear at 500–5,000 Hz. They are acceptable for detecting gross imbalance or looseness on very slow-speed equipment, but will miss the early-stage bearing faults that provide the highest-value advance warning. For a production manufacturing program, purpose-built ICP accelerometers or industrial-grade MEMS wireless sensors are the correct starting point.
OXmaint integrates with all major industrial sensor platforms via API for automated work order generation.
What is BPFO and BPFI and how do I calculate them?
BPFO (Ball Pass Frequency Outer Race) and BPFI (Ball Pass Frequency Inner Race) are the mathematically calculated defect frequencies for rolling element bearings. BPFO equals (number of balls ÷ 2) × RPM/60 × (1 − ball diameter ÷ pitch diameter × cos(contact angle)), and BPFI uses 1 plus the same term. Bearing manufacturers publish these frequency multipliers per bearing model. When vibration amplitude rises specifically at these non-synchronous frequencies, it indicates a developing crack on that specific race — typically
4–8 weeks before the bearing seizes — enough time for planned replacement with zero unplanned downtime.
How do I know if high vibration is a machine fault or a process issue?
Cross-referencing vibration data with process parameters — flow, pressure, temperature, and load — is the key to separating mechanical faults from process-driven vibration. Pump cavitation, for example, appears as broadband high-frequency vibration correlated with suction pressure drop. Resonance shows as extreme amplitude at a specific frequency when operating speed matches a structural natural frequency. Trending is also diagnostic: a mechanical fault rises progressively, while process-driven vibration typically correlates with operating point changes.
Book a demo with OXmaint to see how multi-parameter correlation works in practice across your asset fleet.
Start Your Vibration Program with OXmaint
Your Equipment Is Already Signaling Its Next Failure — Are You Listening?
Every motor, pump, and gearbox in your facility carries a vibration signature that reveals its health in real time. OXmaint connects your vibration sensors, processes threshold breaches, and auto-generates work orders — so your team acts on data the moment the machine signals a problem, not weeks later when it trips the line.