Steam system inefficiencies drain manufacturing budgets at rates most plant managers never see itemized — a single failed steam trap wastes 2,000 pounds of steam per year, costing $200 to $400 in fuel depending on regional energy prices. Multiply that by 50 to 200 traps in a typical mid-sized facility and the annual waste reaches six figures before anyone notices. Plants with documented steam system maintenance programmes reduce energy consumption by 10% to 15% and eliminate 80% of water hammer incidents that damage equipment and create safety hazards. This checklist structures your steam maintenance around five critical system components: steam generation, distribution networks, condensate recovery, steam traps, and pressure control devices. Each component follows industry standards from ASME, ASHRAE, and the Department of Energy's Steam Challenge programme. Track every inspection, test result, and energy-saving opportunity with OxMaint's steam system management module that calculates trap failure costs automatically and prioritizes repairs by financial impact.
Steam Systems · Energy Efficiency · Industrial Utilities
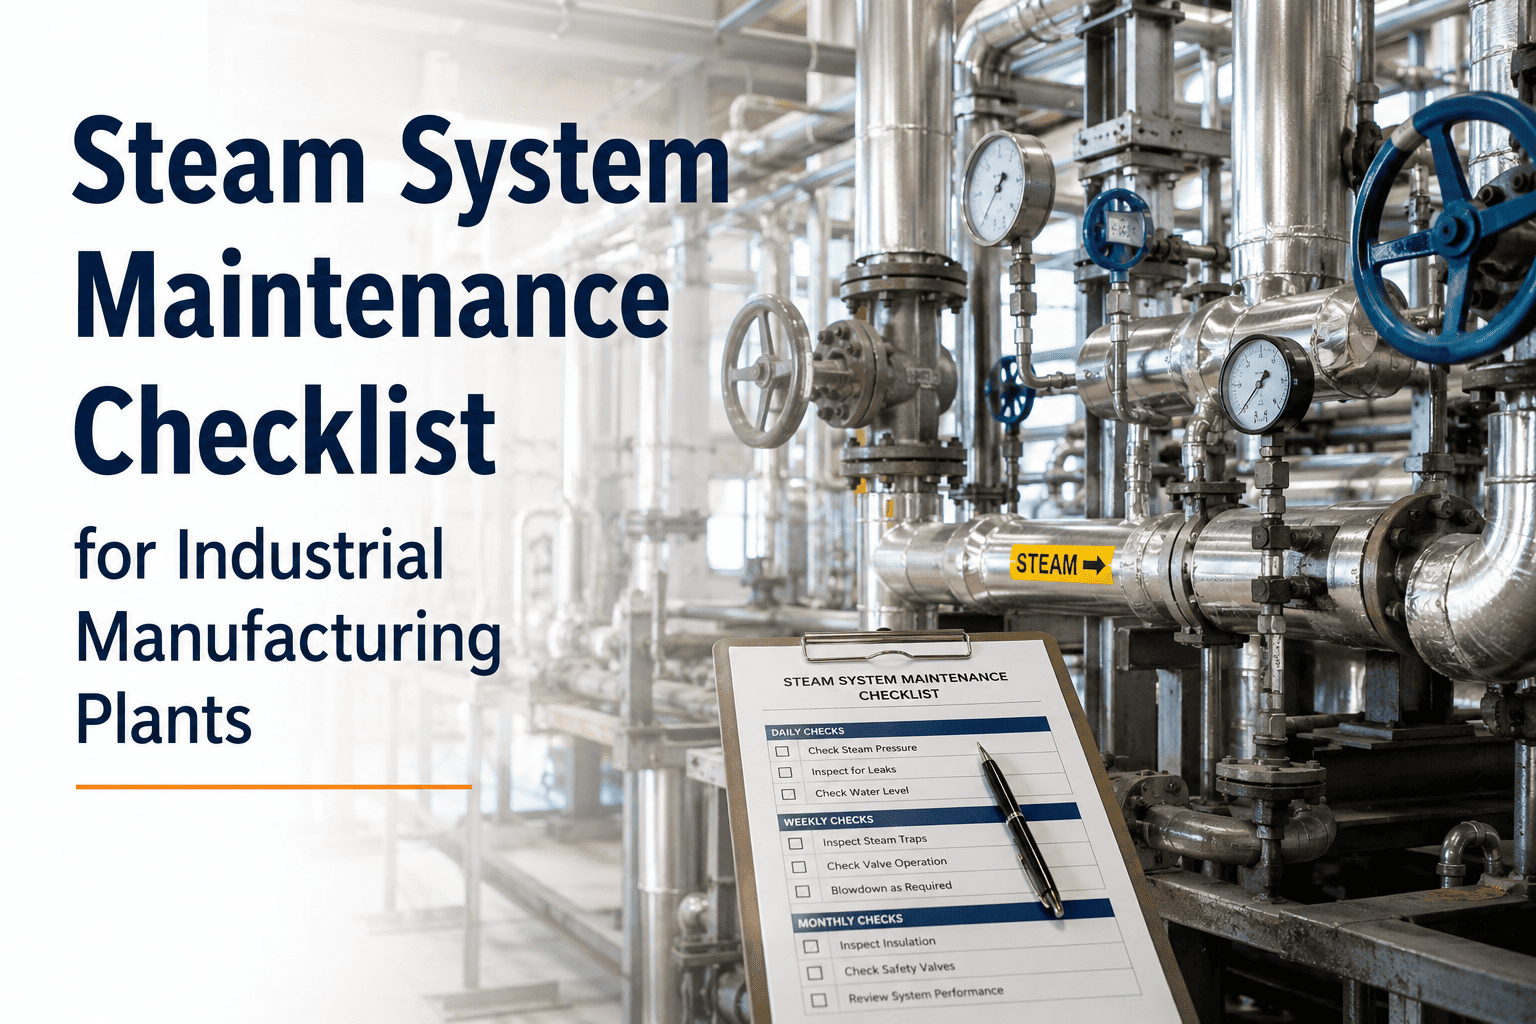
Steam System Maintenance Checklist for Industrial Manufacturing Plants
Five critical system components. One integrated maintenance strategy. Built for utilities engineers, energy managers, and maintenance teams who measure success in BTUs saved and equipment uptime extended.
$200-$400
Annual fuel cost per failed steam trap in typical operations
10-15%
Energy reduction with systematic steam maintenance programs
80%
Of water hammer incidents eliminated through proper maintenance
5 Components
Critical steam system areas in this maintenance checklist
Component 01
Steam Generation Equipment
Boiler efficiency directly determines steam system economics. A 1% efficiency loss costs $10,000 to $20,000 annually in a 100 horsepower boiler running two shifts. Water quality, combustion tuning, and heat transfer surface cleanliness are the three variables that control generation efficiency.
Boiler Water Chemistry Control
Boiler water pH maintained between 10.5 and 11.5 — test daily using calibrated pH meter; low pH causes corrosion, high pH causes caustic embrittlement of steel
Test: Daily · Owner: Water Treatment Operator · Standard: ASME Guidelines
Total dissolved solids measured and maintained below 3500 ppm for most industrial boilers — blowdown when TDS exceeds target to prevent carryover and scale formation
Test: Daily · Tool: TDS meter · Record: Boiler water log
Phosphate residual maintained at 20 to 40 ppm in boilers operating above 300 psi — prevents hardness scale deposition on heat transfer surfaces
Test: Weekly · Owner: Utilities Engineer · Standard: Boiler manufacturer specifications
Oxygen scavenger residual tested weekly — target sulfite residual 20 to 40 ppm or hydrazine 0.05 to 0.1 ppm depending on feedwater treatment programme
Test: Weekly · Record: Chemical feed log · Action: Adjust feed rate if out of range
Combustion Efficiency Optimization
Flue gas oxygen content measured weekly and maintained at 3% to 4% for natural gas fired boilers — oxygen below 2% indicates incomplete combustion
Test: Weekly · Tool: Combustion analyzer · Owner: Boiler Technician
Stack temperature monitored continuously — temperature rise above baseline by more than 40°F indicates fouled heat transfer surfaces requiring cleaning
Monitor: Continuous · Alert: Temperature deviation · Action: Schedule tube cleaning
Burner flame pattern inspected weekly through observation ports — yellow flames indicate poor air-fuel mixing, blue flames indicate proper combustion
Inspection: Weekly · Owner: Boiler Operator · Record: Burner observation log
Component 02
Steam Distribution Networks
Distribution losses waste 10% to 20% of generated steam in poorly maintained systems. Insulation failures, air binding, and inadequate drainage create efficiency losses and operational problems including water hammer and corrosion.
Insulation Integrity and Heat Loss Prevention
Steam line insulation inspected quarterly for damage, water staining, or compression — damaged insulation replaced immediately as bare pipe loses 1000 BTU per linear foot per hour
Inspection: Quarterly · Owner: Insulation Contractor · Standard: ASTM C1409
Valve and flange insulation covers installed on all steam system components — removable covers allow maintenance access while preventing radiant heat loss
Check: Monthly · Record: Insulation inventory · Action: Install missing covers
Surface temperature of insulated lines verified below 140°F using infrared thermometer — higher temperatures indicate insulation failure or incorrect thickness
Test: Quarterly · Tool: IR thermometer · Owner: Energy Manager
Condensate Drainage and Air Venting
Drip legs installed every 300 to 500 feet on horizontal steam mains and at all low points — drip legs prevent condensate accumulation that causes water hammer
Verify: During system walks · Standard: ASHRAE Applications Handbook · Owner: Piping Engineer
Automatic air vents functional at high points in steam system — vents must release air during startup and operation without allowing live steam discharge
Test: Monthly · Owner: Steam Fitter · Action: Replace failed vents immediately
Steam line pitch verified at minimum 1 inch per 20 feet in direction of steam flow — inadequate pitch allows condensate pooling and water hammer damage
Verify: Annual survey · Tool: Laser level · Record: Piping isometric drawings
Every failed steam trap costs you $300 per year. Every uninsulated valve costs $500. OxMaint calculates your waste, prioritizes repairs by ROI, and tracks energy savings achieved.
Component 03
Condensate Recovery Systems
Recovered condensate saves fuel cost, reduces water treatment chemical consumption, and minimizes thermal shock to boiler feedwater systems. Plants that recover 80% or more of condensate reduce operating costs by $15,000 to $40,000 annually per 1000 pounds per hour of steam generation.
Condensate Return Line Maintenance
Condensate return lines inspected annually for corrosion and leaks using ultrasonic thickness testing — carbonic acid corrosion thins pipe walls from inside
Test: Annually · Tool: UT thickness gauge · Owner: Inspection Contractor
Condensate pump operation verified weekly — check pump seal condition, bearing temperature, and discharge pressure; seal leaks waste hot condensate
Check: Weekly · Owner: Mechanical Technician · Record: Pump inspection log
Flash tank pressure controlled at optimal level for system — pressure set to maximize flash steam recovery while preventing backpressure on steam traps
Verify: Monthly · Standard: DOE Steam System Modeler · Owner: Utilities Engineer
Condensate Quality Monitoring
Condensate pH tested weekly at return tank — pH below 7.0 indicates carbonic acid formation from dissolved CO2; pH above 9.0 suggests boiler water contamination
Test: Weekly · Owner: Water Treatment Tech · Action: Investigate contamination source
Condensate iron content tested monthly — iron above 0.3 ppm indicates corrosion in return lines requiring immediate investigation and repair
Test: Monthly · Lab: Water treatment provider · Record: Condensate quality log
Component 04
Steam Trap Testing and Maintenance
Steam trap failures represent the largest single energy waste in most steam systems. A comprehensive trap survey and maintenance programme is the highest ROI activity in steam system management.
Steam Trap Performance Testing
All steam traps tested quarterly using ultrasonic trap tester or temperature differential method — classify traps as good, leaking, plugged, or blown open
Test: Quarterly · Tool: Ultrasonic detector · Owner: Steam Specialist
Failed traps replaced within 48 hours of identification — a trap blowing steam wastes $400 annually; multiply by trap count for true system waste
Action: Immediate repair · Record: Trap replacement log · Priority: High
Trap sizing verified during replacement — oversized traps lose capacity control, undersized traps allow condensate backup and equipment flooding
Verify: Every replacement · Standard: Trap manufacturer sizing software · Owner: Steam Engineer
Trap Installation Best Practices
Strainers installed upstream of all steam traps and cleaned quarterly — dirt and scale cause 50% of premature trap failures
Clean: Quarterly · Owner: Pipe Fitter · Record: Strainer cleaning log
Test valves installed on both sides of critical steam traps — isolation allows trap testing and replacement without system shutdown
Verify: During upgrades · Standard: Industry best practice · Owner: Maintenance Planner
Steam trap discharge piping sloped away from trap at minimum 1 inch per 10 feet — prevents condensate backup that reduces trap capacity
Check: Annual system walk · Tool: Level · Action: Modify incorrect installations
Component 05
Pressure Control and Safety Devices
Pressure control equipment maintains system stability and protects against overpressure conditions. Pressure reducing valves, safety relief valves, and control instrumentation require regular testing to ensure reliable operation.
Pressure Reducing Valve Maintenance
PRV downstream pressure verified weekly against setpoint — pressure drift above 5% of setpoint indicates diaphragm wear or pilot malfunction
Test: Weekly · Owner: Instrument Technician · Record: PRV performance log
PRV strainers inspected and cleaned quarterly — clogged strainers cause erratic pressure control and valve hunting
Clean: Quarterly · Owner: Pipe Fitter · Action: Replace damaged screens
PRV internal components inspected annually during scheduled outage — replace diaphragm, seats, and springs per manufacturer rebuild schedule
Rebuild: Annually · Contractor: Valve service specialist · Record: Rebuild certification
Safety Relief Valve Testing
Safety relief valves visually inspected weekly — check for corrosion, weeping, or damage to discharge piping; any visible steam discharge requires immediate investigation
Inspection: Weekly · Owner: Boiler Operator · Standard: ASME Section I
Relief valves pop tested or replaced per ASME code requirements — typically annual testing for boilers, extended intervals allowed for certified valves
Test: Per ASME schedule · Contractor: Authorized valve repair facility · Record: Test certification
Relief valve nameplate data verified matches boiler operating conditions — capacity must equal or exceed maximum boiler output at set pressure
Verify: During testing · Standard: ASME Boiler Code Section I · Owner: Chief Engineer
Industry Insights
Steam System Expert Perspectives
01
The biggest mistake facilities make is ignoring steam traps until equipment fails. Run trap surveys quarterly and you will find 8% to 12% failure rates. Ignore traps for two years and failure rates hit 30%. The fuel waste compounds every single day.
Utilities Manager, Pharmaceutical Manufacturing, 21 years
02
Boiler water chemistry is non-negotiable. I have seen facilities spend $200,000 replacing a boiler because they skipped daily water testing for six months. Scale buildup reduced heat transfer, efficiency dropped, tubes overheated and failed. All preventable with a $2 pH test strip.
Boiler Consultant, Industrial Services, 18 years
03
Condensate is liquid gold. Every gallon returned saves heating energy, water cost, and chemical cost. Yet half the facilities I audit dump condensate to drain because their return lines leaked and nobody fixed them. That is throwing away $20,000 to $50,000 per year.
Energy Engineer, Steam System Optimization, 16 years
Frequent Questions
Steam System Maintenance FAQs
How much fuel does a failed steam trap waste annually?
A steam trap failed open at 100 psi wastes approximately 50 to 80 pounds of steam per hour depending on orifice size. At typical fuel costs, this equals $200 to $400 per year per failed trap. Multiply by the number of failed traps in your system to calculate total waste. Many facilities have 10 to 20 failed traps at any given time, wasting $3,000 to $8,000 annually.
What is the correct frequency for steam trap surveys?
Quarterly steam trap surveys are industry best practice for critical process systems. Annual surveys are minimum acceptable for less critical applications. New trap installations should be checked within 30 days and again at 90 days because infant mortality rates are high. Monthly surveys are justified in high-energy-cost facilities where trap failures create immediate financial impact.
What causes water hammer in steam systems and how is it prevented?
Water hammer occurs when condensate accumulates in steam lines and is suddenly accelerated by steam flow, creating shock waves that damage piping and equipment. Prevention requires proper system pitch, adequate drip legs every 300 to 500 feet, functional steam traps at all low points, and slow warm-up procedures during startup. Water hammer damage costs $5,000 to $50,000 per incident in piping and equipment repairs.
Transform Steam System Maintenance from Cost Center to Profit Generator
OxMaint tracks trap failures, schedules surveys automatically, calculates energy waste per defect, and prioritizes repairs by financial return. Your steam system becomes measurable, manageable, and profitable.