Manufacturing plant managers have historically made decisions based on data that was hours — or days — old by the time it reached them. Real-time dashboards change this fundamental dynamic: the right KPI, at the right moment, on the right screen, enables decisions that reduce downtime, improve throughput, and surface problems before they compound. Sign up for Oxmaint to access live maintenance and operations dashboards that show your work order backlog, PM compliance rate, asset downtime, and technician productivity — updated in real time, accessible from any device.
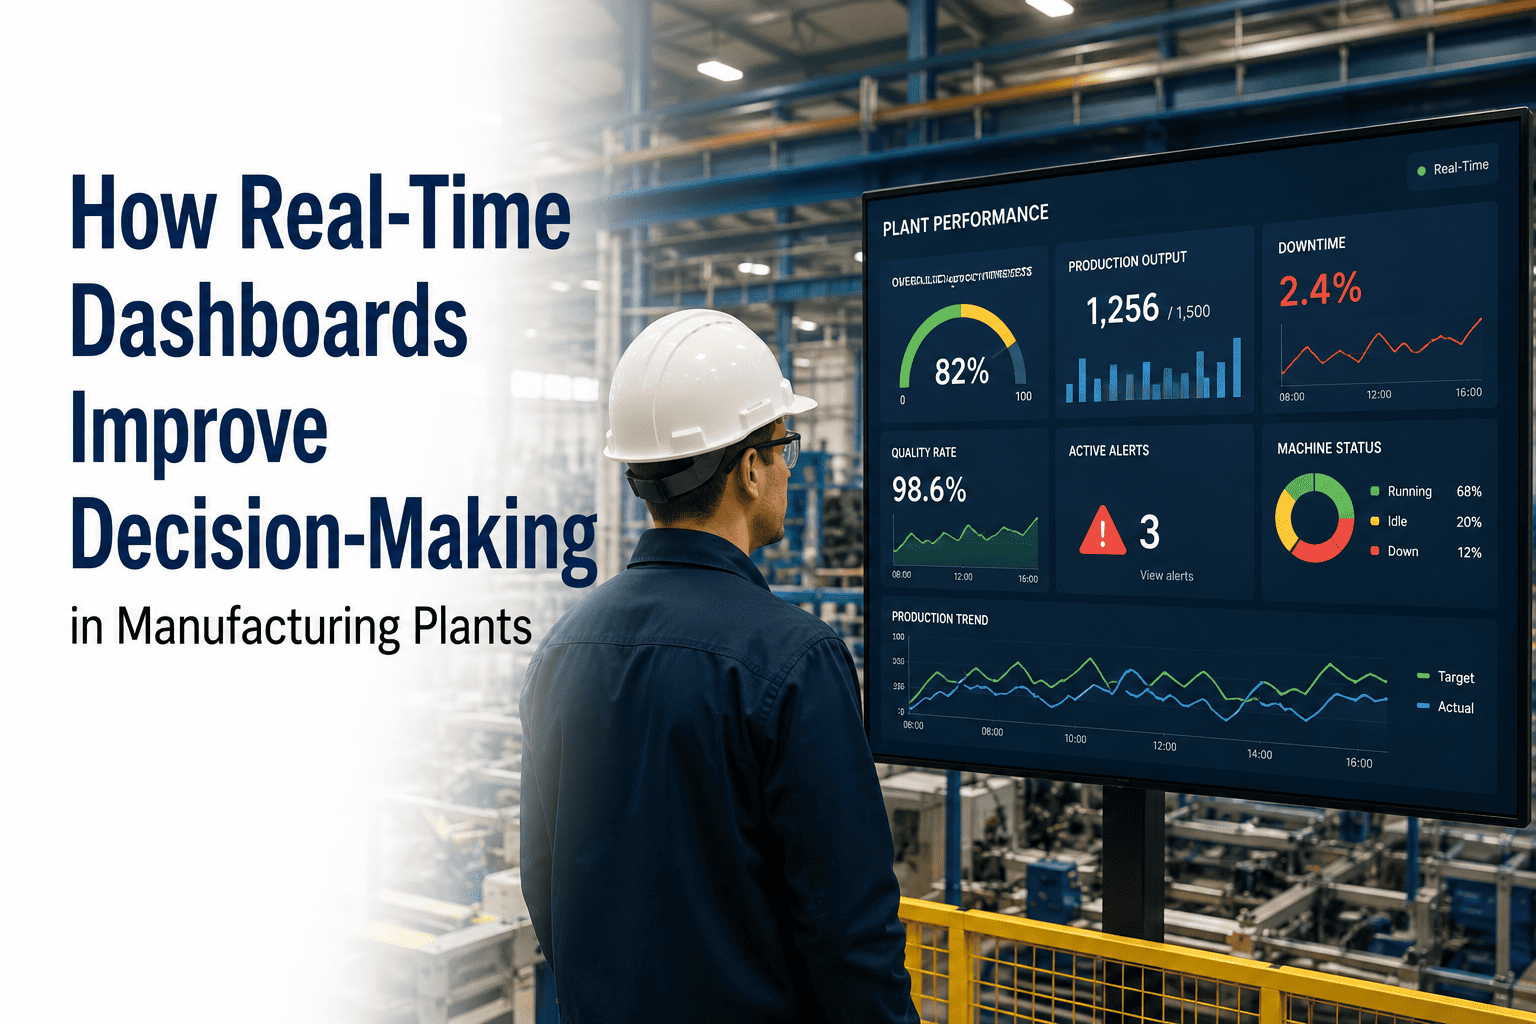
How Real-Time Dashboards Improve Decision-Making in Manufacturing Plants
Plant managers who wait for end-of-day reports are always reacting to yesterday's problems. Real-time dashboards shift the decision window from hours to minutes — turning visibility into competitive advantage.
Why the Timing of Data Changes Everything for Plant Managers
The value of operational data is not constant — it decays rapidly from the moment an event occurs. A line stoppage flagged in real time can be investigated and resolved in minutes. The same event discovered in a morning report triggers a retrospective investigation that changes nothing about what already happened to production output.
The Four Dashboard Layers Every Manufacturing Plant Needs
A single dashboard cannot serve every role in a plant. Different decisions require different data at different levels of granularity and frequency. Effective dashboard architecture stacks four distinct layers — each serving a specific decision-maker at the pace they need to operate.
OEE trend, maintenance cost vs budget, asset reliability KPIs, PM compliance rate, and supplier quality metrics. Drives capital planning, staffing decisions, and programme investment reviews. Updated daily, reviewed weekly.
Open work order queue, overdue PMs, technician utilisation, parts consumption, and reactive vs planned work ratio. Drives daily scheduling, resource allocation, and backlog prioritisation. Updated in real time, actioned daily.
Live production rate vs target, downtime events by cause, quality rejects, and asset status by line. Drives shift-level response to throughput deviations. Updated continuously, actioned within minutes.
Personal work order queue, asset history for current job, parts availability, and safety permits for the shift. Drives individual task execution and time reporting. Accessed on mobile device at point of work.
See Your Plant Maintenance Data Live in Oxmaint Dashboards
Oxmaint's real-time maintenance dashboard shows open work orders, PM compliance, asset downtime, and technician activity — refreshed continuously so your team always has the current picture, not yesterday's report.
What Makes a Manufacturing Dashboard Actually Useful — Not Just Impressive
Most manufacturing dashboard projects fail not because the technology doesn't work, but because the dashboard was designed to show data rather than to support decisions. The difference between a dashboard that operators check every hour and one that gets ignored after the first week comes down to five design principles.
| Principle | What It Means in Practice | Common Failure Mode |
|---|---|---|
| Decision-First Design | Every metric on the dashboard answers a specific operational question. If you cannot state the decision a metric supports, remove it. | Dashboard shows 40 KPIs but users cannot identify which three require action |
| Exception-Based Alerting | Dashboards highlight deviations from target, not just current values. Green/amber/red status coding with defined thresholds drives faster response. | All values displayed as neutral numbers — users must recall the target to judge performance |
| Role-Appropriate Granularity | Technicians need task-level detail. Managers need trend summaries. The same dashboard cannot serve both — separate views for separate roles. | Single dashboard tries to serve every role and ends up serving none effectively |
| Genuine Real-Time Refresh | Data latency must match the decision cycle. A maintenance dashboard refreshing every 4 hours is not real-time — it is a slow report. | Dashboard labelled "real-time" but pulling from a data warehouse updated overnight |
| Mobile-First for the Floor | Technicians and supervisors are not at desks. Dashboard data must be accessible and readable on a mobile device at point of work. | Dashboard designed for desktop monitors becomes unusable on a phone screen at a machine |
The Maintenance and OEE Metrics Every Plant Dashboard Should Display
The metrics that belong on a manufacturing operations dashboard are not chosen arbitrarily — they are the leading and lagging indicators that consistently predict and explain production and maintenance performance. These are the ones that matter most.
The single most comprehensive production performance metric — combining Availability, Performance, and Quality into one percentage. World-class target is 85%. A live OEE reading that drills down by loss category tells supervisors exactly where to focus recovery effort during a shift.
The total count and age of open work orders — split by priority. A growing backlog of high-priority open WOs is a leading indicator of increasing breakdown risk. It tells maintenance managers whether their team is keeping pace with incoming demand or falling behind.
The percentage of scheduled preventive maintenance tasks completed on time. Declining PM compliance is the earliest signal that a maintenance operation is drifting reactive. Displayed in real time, it allows supervisors to reallocate resource before overdue PMs turn into breakdowns.
Unplanned downtime categorised by root cause — equipment failure, changeover, material shortage, operator absence. A live Pareto of downtime causes during the current shift allows supervisors to direct maintenance and operations resources to the highest-impact problem in real time.
A plant-floor map or asset list showing the current operational status of every critical asset — running, on planned maintenance, on breakdown, or awaiting parts. Gives plant managers and supervisors instant situational awareness without walking the floor or calling individual technicians.
The real-time gap between planned production rate and actual rate — expressed in units, tonnes, or hours. A widening gap in the first hour of a shift signals a problem that can still be recovered within the shift if addressed immediately. End-of-day reporting makes the same gap unrecoverable.
Real-Time Manufacturing Dashboards — Questions Plant Managers Ask
A BI report aggregates historical data for analysis — it answers "what happened and why?" A real-time dashboard reflects current operational status — it answers "what is happening right now and what action is required?" Both serve different decision types. Plant managers need real-time dashboards for shift-level operational decisions and BI reports for weekly and monthly programme reviews. Oxmaint provides both: live operational dashboards and historical reporting from the same dataset. Sign up for Oxmaint to access both in one platform.
Design dashboards backwards from the decisions they need to support, not forwards from the data available. For each role, identify the three to five decisions made most frequently during a shift, then select only the metrics that directly inform those decisions. Every metric added beyond the decision set increases cognitive load without improving action. A useful rule of thumb: if a metric does not cause a specific action when it changes, it does not belong on an operational dashboard.
Oxmaint supports API-based integration with major ERP and MES platforms, enabling maintenance dashboard data to be combined with production data from your existing systems. Work order status, asset downtime, and PM compliance from Oxmaint can be surfaced alongside production output and quality data in a unified plant view. Book a demo to discuss your specific integration scenario and what is achievable with your current systems.
A maintenance manager's daily dashboard should include: open work order backlog by priority, overdue preventive maintenance count, planned vs actual work hours for the current week, reactive work order ratio for the current period, and assets currently on breakdown or awaiting parts. These five metrics together give a complete picture of whether the maintenance programme is ahead of demand or falling behind — and where to direct attention on any given day. Sign up for Oxmaint to configure this dashboard immediately after setup.
A working maintenance dashboard in Oxmaint — showing open work orders, PM compliance, asset status, and technician activity — can be live within the first week of setup, once assets and maintenance schedules are configured in the system. The dashboard does not require custom development or integration work to display core maintenance KPIs; it populates automatically as work orders are created and closed by the maintenance team.
Stop Managing Your Plant on Yesterday's Data. Get Live Visibility Today.
Oxmaint's real-time maintenance dashboards give plant managers, maintenance teams, and production supervisors the live KPI visibility they need to make faster, better-informed decisions — without waiting for end-of-day reports that are already out of date.