Manufacturing scrap is one of the most visible and most poorly managed cost categories in plant operations. Every piece of off-specification material, every rejected component, and every process waste stream represents a cost already incurred — in raw materials, energy, machine time, and labour — that will not become revenue. Plants that treat scrap as an operational inevitability and track it loosely are routinely operating with a 3–8% material cost drag that digital scrap management can systematically reduce. The first step is understanding exactly where scrap is being generated, at what rate, from which assets, and at what cost per event. Sign in to OxMaint to connect scrap events directly to maintenance work orders and asset performance data, or book a demo to see how digital scrap tracking integrates with your production and maintenance workflows.
Cost Reduction / Inventory Management
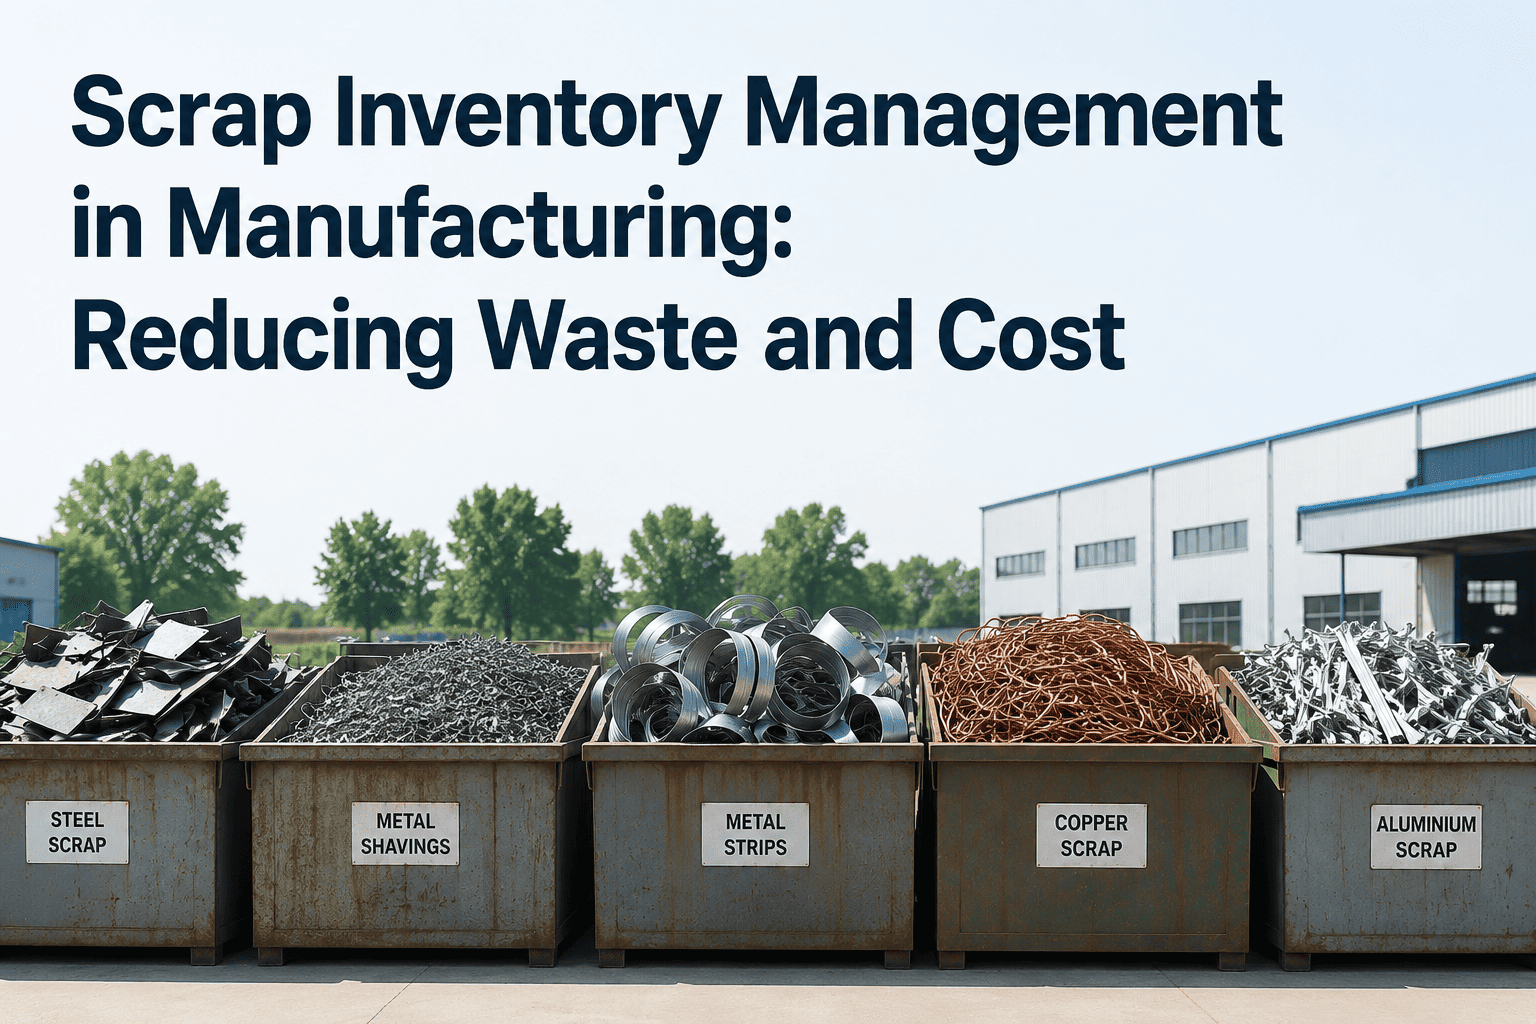
Scrap Inventory Management in Manufacturing: Reducing Waste and Cost
Poor scrap tracking costs manufacturers millions annually in unaccounted material waste, missed recycling value, and defect patterns that go undetected until they become systematic. Digital scrap inventory management transforms scrap from an uncontrolled cost into a managed and reducible one.
The Hidden Cost of Untracked Scrap
Most manufacturing plants know their total scrap rate. Far fewer know which specific machines, operators, shifts, materials, or process parameters are generating the most scrap — which means they cannot target reductions effectively. Untracked scrap is not just wasted material; it is wasted diagnostic information.
3–8%
Average material cost lost to scrap in manufacturing
40%
of scrap is traceable to equipment condition issues
$1M+
annual scrap cost at a mid-size automotive parts plant
60%
of scrap reduction potential is captured in the top 3 defect types
Paper logs
mean scrap patterns go undetected for weeks or months
Five Categories of Manufacturing Scrap — and Where They Come From
| Scrap Category |
Common Sources |
Primary Cause |
Reduction Lever |
| Process Scrap |
Tooling wear, parameter drift, changeover |
Equipment condition, setup variation |
Preventive maintenance, SPC monitoring |
| Incoming Material Scrap |
Supplier non-conformance, handling damage |
Supplier quality, receiving inspection gaps |
Supplier scorecard, receiving inspection protocol |
| Rework-to-Scrap |
Failed rework attempts, over-machined parts |
Rework process capability, operator skill |
Rework approval gates, first-pass fix rate tracking |
| Setup and Trial Scrap |
First-off inspection failures, machine warm-up |
Setup procedure quality, machine stability |
Digital setup checklists, machine warm-up protocols |
| Obsolescence Scrap |
Design changes, cancelled orders, excess stock |
Planning accuracy, demand forecasting |
Real-time inventory visibility, demand-driven build |
Connect Scrap Events to Maintenance Triggers in OxMaint
When a machine generates above-threshold scrap, OxMaint automatically raises a maintenance inspection work order. Scrap data and asset condition data in one connected system.
What Digital Scrap Tracking Captures That Paper Logs Cannot
Real-Time Scrap Logging at the Point of Generation
Operators log scrap events on mobile devices at the machine — capturing quantity, defect type, asset ID, and shift at the moment the scrap is generated. No end-of-shift consolidation, no missing events, no estimated quantities. Real-time data means supervisors see scrap rates as they develop — not after the shift has ended and material has moved.
Defect Code Standardisation Across Lines and Shifts
Paper logs allow different operators to describe the same defect differently — making cross-shift and cross-line analysis unreliable. Digital scrap systems enforce standardised defect code selection from a defined list, ensuring that data from different shifts and lines is comparable and aggregatable. Pareto analysis of scrap by defect type becomes reliable only when defect codes are consistent.
Automatic Linkage to Asset Maintenance Records
When scrap is logged against a specific asset, the event is automatically linked to that asset's maintenance history. A rise in scrap rate that correlates with overdue PM tasks, recent repairs, or tooling wear patterns becomes visible in the asset record — connecting quality and maintenance data that is typically managed in separate systems with no integration.
Scrap Cost Calculation: What Every Entry Should Capture
The monetary value of scrap is almost always underestimated because plants calculate it on raw material cost alone. A complete scrap cost calculation captures all value added to the part before it was scrapped — not just the material that was consumed.
Raw Material Cost
Material cost at point of purchase, allocated per unit
+
Labour Cost Added
All process steps completed before the part was rejected
+
Machine Time Cost
Machine hourly rate multiplied by time invested in the rejected part
+
Energy Cost
Energy consumed in processing the scrapped unit
−
Salvage or Recycling Value
Value recovered through material recycling or secondary sale
=
True Scrap Cost Per Event
The number that drives accurate monthly scrap cost reporting
Scrap Reduction: A Structured Approach
1
Measure and Classify — Build a Reliable Baseline
You cannot reduce what you cannot measure accurately. The first 30 days of a scrap reduction programme should focus entirely on capturing reliable, standardised scrap data by asset, defect type, shift, and material. Resist the temptation to act before the data is clean.
2
Pareto Analysis — Focus on the Vital Few
In most plants, 3–4 defect types account for over 60% of scrap cost. Pareto analysis on your first 30 days of clean data will identify them. All reduction resources should target these categories first — broad scrap awareness programmes that address all defect types simultaneously are less effective than focused attacks on high-volume categories.
3
Root Cause Linkage — Connect Scrap to Asset Condition
For each high-volume scrap category, identify the upstream equipment or process parameter that is the root cause driver. Scrap generated by a machine with degraded tooling, worn bearings, or a drifting temperature controller is a maintenance problem — not an operator problem. Cross-referencing scrap data with asset maintenance history reveals these linkages.
4
Trigger Maintenance from Scrap Thresholds
Configure automatic maintenance alerts when scrap rate from a specific asset exceeds a defined threshold. A machine generating three times its baseline scrap rate on a given shift should automatically trigger a maintenance inspection work order — not wait for the monthly scrap review meeting to surface the issue.
5
Track Recycling and Salvage Value Systematically
Scrap that cannot be eliminated should be captured at maximum recoverable value. Digital scrap tracking that records material type and weight per event enables accurate recycling claim submission, secondary sale pricing, and month-end reconciliation between scrap generated and scrap disposed.
"
The conversation about scrap in most plants is about rate — what percentage of production are we scrapping. The more useful conversation is about location and cause: which three assets account for 65% of our scrap cost, and is the scrap rate from those assets trending up or down this week. Digital tracking makes that question answerable in real time. The paper logbook can tell you the rate at month end. The digital system can tell you the rate at the end of this shift, by machine, with trend comparison to last week.
Anita Raghunathan
Manufacturing Quality Systems Lead · 16 years scrap reduction and quality engineering in automotive, aerospace, and consumer goods · Specialist in scrap cost modelling, defect classification systems, and maintenance-quality integration
Scrap Tracking and Sustainability: The Reporting Connection
Environmental and sustainability reporting requirements for manufacturers are increasing. Accurate scrap data — by material type, volume, disposal route, and recycling rate — is a core input to sustainability reporting frameworks including GHG Protocol Scope 3 calculations, ISO 14001 environmental management, and customer-mandated ESG reporting. Digital scrap tracking that captures material type and disposal method per event generates the data these reports require. Manual aggregation from paper logs is not sufficiently granular or reliable for formal sustainability submissions.
Frequently Asked Questions
What is the difference between scrap rate and scrap cost?
Scrap rate is a volume or count metric — the percentage of production that is rejected. Scrap cost is the financial impact — including material, labour, machine time, and energy invested before rejection, minus any salvage value. Plants that track only scrap rate consistently underestimate the true cost impact. Digital systems should capture both metrics for accurate management reporting.
OxMaint tracks both in your asset and production records.
How does scrap management connect to preventive maintenance?
Equipment in degraded condition — worn tooling, drifting process parameters, failing temperature controls — generates significantly more scrap. Proactive maintenance keeps machines in specification, directly reducing scrap generation from process drift. Digital systems that connect scrap events to asset records make this linkage visible and actionable.
Book a demo to see the OxMaint integration.
What data should be captured for every scrap event?
Asset ID, timestamp, shift and operator, defect code from a standardised list, quantity scrapped, material type and weight, disposition (recycled, reworked, disposed), and calculated cost value. Photo attachment of the defect is valuable for quality trend analysis. These fields transform scrap logs from compliance records into actionable operational data.
Can scrap data support ISO 14001 and sustainability reporting?
Yes. ISO 14001 requires documented waste management records including generation volumes, material types, and disposal routes. Digital scrap tracking that captures this data per event generates the granular, auditable records that ISO 14001 environmental management and GHG Protocol Scope 3 reporting require. Paper logbooks rarely meet the data quality standard for formal sustainability submissions.
How long does it take to see scrap reduction results from a digital tracking programme?
Most plants see meaningful pattern visibility within the first 4–6 weeks — enough data to identify the top 3 scrap categories and their primary asset sources. Measurable cost reduction from targeted maintenance and process interventions typically follows within 2–3 months of initiating the programme. The baseline measurement phase is not overhead — it is the foundation for all subsequent reductions.
Start your baseline in OxMaint today.
Scrap Is a Managed Cost. Start Managing It Digitally.
OxMaint connects scrap event logging to asset maintenance records, work order creation, and cost reporting — giving quality and maintenance teams the shared data they need to target and reduce scrap at its source.