Maintenance budget season puts plant managers and maintenance leaders in a familiar position: defending spending that leadership cannot directly see, to finance teams who only see the number. The reality is that a weak Sign Up Free maintenance budget does not save money — it defers cost and amplifies risk. This guide equips maintenance leaders with the frameworks, benchmarks, and ROI arguments needed to build a 2026 budget that wins approval and drives real performance outcomes. Whether you manage a single facility or a multi-site operation, the principles of justifying maintenance investment remain the same: connect every dollar to production continuity, asset life, and total cost of ownership.
Maintenance Budget · CMMS · ROI Tracking
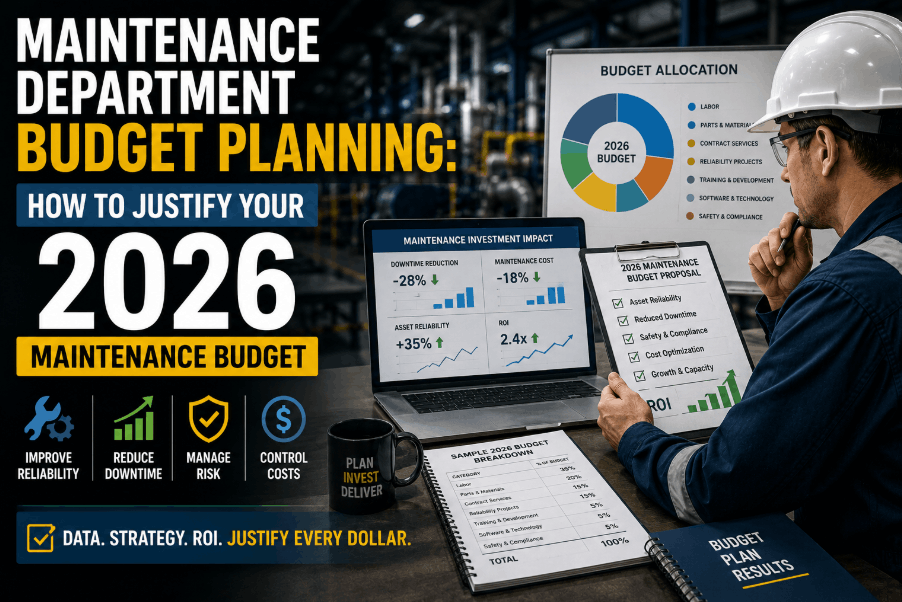
Build and Justify Your 2026 Maintenance Budget in Oxmaint
Track spend by category, measure PM ROI, and generate the executive-ready reports your CFO needs — all from one live dashboard.
Strategic Context
Why Maintenance Budget Justification Is Harder — and More Important — in 2026
Capital constraints, rising parts costs, and aging asset bases have made maintenance spending a CFO priority rather than a line item that passes without scrutiny. Plants that fail to Book a Demo and build a data-backed budget case routinely receive cuts that accelerate the reactive cycle — lower budgets produce more failures, more emergency spend, and ultimately higher total costs than the original ask. Understanding this dynamic is the foundation of every successful maintenance budget presentation.
3–5×
Cost of reactive vs planned maintenance work
4–6%
ARV spend at reactive plants vs 1.5–2% at world-class
$260K
Average hourly cost of unplanned downtime in discrete manufacturing
40%
Reduction in unplanned downtime achievable with structured PM programs
Budget Components
The 6 Core Components of a Manufacturing Maintenance Budget
A credible maintenance budget for 2026 is not a single number — it is a structured breakdown across six categories, each with its own justification logic and performance linkage. Presenting at this level of granularity signals financial maturity and makes approval far more likely.
01
Preventive Maintenance Labor
Planned technician hours for scheduled inspections, lubrication, calibration, and condition-based tasks. This is the foundation of a proactive program — budget here reduces emergency spend later.
CapEx Link: Asset Life Extension
02
Corrective and Emergency Labor
Reactive repair hours for unplanned failures. A maturing program reduces this line over time. Benchmark: world-class plants keep reactive labor below 15% of total maintenance hours.
Benchmark: Under 15% of Total Hours
03
Spare Parts and Materials
Storeroom replenishment, critical spare holdings, and consumables. Optimal stocking — driven by CMMS data — eliminates both stockouts that extend MTTR and over-stocking that ties up working capital.
CMMS-Driven Optimization
04
Contractor and Specialist Services
OEM services, specialized inspections, statutory compliance work, and major overhauls that exceed in-house capability. These should be planned and tendered well in advance to avoid emergency-rate premiums.
Pre-Tendered = 20–30% Savings
05
Maintenance Technology and CMMS
Software subscriptions, mobile platforms, condition monitoring sensors, and digital work order infrastructure. This line pays for itself by reducing wrench-time losses and enabling predictive maintenance triggers.
ROI: 3–10× Documented
06
Training and Skills Development
Technician upskilling, reliability engineering certification, and PLC/automation training. Under-investment here creates MTTR creep as the asset base becomes more complex than the workforce skills.
Reduces MTTR and Contractor Dependency
CapEx vs OPEX
CapEx vs OPEX Decisions: How to Frame Maintenance Investments for Finance
One of the most common approval barriers is budget classification. Finance teams respond differently to CapEx and OPEX requests, and maintenance leaders who understand how to frame each investment win approval more consistently. Sign Up Free and use Oxmaint's work order cost tracking to build the asset-level spend data that supports either classification argument.
| Investment Type |
Classification |
Justification Argument |
Finance Metric to Use |
| Asset overhaul or rebuild |
CapEx |
Extends asset life beyond original useful life — capitalizable under GAAP/IFRS |
Cost vs. replacement value; extended depreciation schedule |
| New condition monitoring hardware |
CapEx |
Permanent infrastructure addition that generates measurable failure reduction |
NPV of avoided downtime over 5-year sensor life |
| Planned PM labor and materials |
OPEX |
Routine period cost; demonstrate ratio improvement vs prior year reactive spend |
PMR trend; cost per equivalent unit of output |
| CMMS / maintenance software |
OPEX |
SaaS subscription; ROI from wrench time gain and emergency cost reduction |
Payback period; labor efficiency gain in dollars |
| Emergency corrective repairs |
OPEX |
Unavoidable; demonstrate reduction trajectory as PM program matures |
Year-over-year reactive cost reduction |
| Reliability improvement project |
CapEx or OPEX |
Depends on scope; engineering studies may be OPEX while physical changes are CapEx |
MTBF improvement value; production uptime gain |
ROI Arguments
How to Build the ROI Argument That Gets Maintenance Budgets Approved
Finance approves budgets that show measurable return. The challenge for maintenance is that most of the value is avoidance — you are quantifying failures that did not happen. The frameworks below translate maintenance investment into language that resonates with CFOs and plant leadership. Book a Demo and see how Oxmaint's reporting module generates these figures automatically from your work order data.
Downtime Avoidance Value
Avoided Failures × Avg Downtime Hours × Hourly Production Value
If your PM program prevented 12 failures last year, each averaging 4 hours at $180,000/hr production value, that is $8.6M in avoided downtime cost — against a PM labor spend that is a fraction of that figure.
Reactive vs Planned Cost Differential
Reactive Repair Cost − Planned Equivalent × Reactive Job Count
Emergency repairs cost 3–5× more than equivalent planned work. If you completed 400 reactive jobs last year at an average $2,800 each versus a planned cost of $700, the reactive premium was $840,000 — recoverable by investing in PM capacity.
Asset Life Extension Value
Replacement Cost ÷ Extended Life Years
A $1.2M CNC machining center with a 15-year design life extended to 20 years through structured maintenance saves $80,000/year in capital replacement deferral — a direct CapEx avoidance argument finance understands immediately.
OEE Improvement Revenue Impact
OEE Gain % × Throughput Capacity × Margin per Unit
Moving OEE from 68% to 74% on a line producing $22,000/hr of margin-bearing output generates $1.32M annually — from maintenance investment alone, with zero new capital equipment required.
Benchmarking
2026 Maintenance Budget Benchmarks by Industry Sector
Presenting your budget alongside industry benchmarks reframes the conversation from "how much are you asking for" to "how does your spend compare to best-in-class operations." Sign Up Free and connect your Oxmaint data to these benchmarks to build a credible, data-grounded budget narrative for leadership.
Discrete Manufacturing
Maintenance Cost / ARV1.5–3%
Reactive % of TotalUnder 20%
PM Compliance Target90%+
Process / Chemical
Maintenance Cost / ARV2–4%
Reactive % of TotalUnder 15%
PM Compliance Target95%+
Food and Beverage
Maintenance Cost / ARV2–3.5%
Reactive % of TotalUnder 25%
PM Compliance Target90%+
Utilities / Energy
Maintenance Cost / ARV1–2.5%
Reactive % of TotalUnder 10%
PM Compliance Target98%+
Presentation Strategy
How to Present Your Maintenance Budget to Leadership: A 4-Step Framework
A technically sound budget still fails if it is presented poorly. Leadership teams make budget decisions based on confidence in the team, clarity of the data, and visible connection between the ask and the business outcome. Book a Demo to see how Oxmaint generates the executive-ready dashboards and KPI reports that anchor a winning budget presentation.
Step 01
Lead with Last Year's Performance Data
Open with a one-page summary: total maintenance spend, reactive vs planned ratio, PM compliance rate, key equipment availability, and any major failure events with their production cost. This establishes credibility and makes the case that you are managing by data, not gut instinct.
Step 02
Frame the Ask as Risk Management
Every maintenance budget line is really a risk trade-off. A cut to spare parts budget is a decision to accept longer MTTR. A cut to PM labor is a decision to accept more unplanned failures. Make these trade-offs explicit — leadership should not be able to cut without understanding what risk they are accepting in return.
Step 03
Benchmark Your Spend Against Industry Peers
Show where your current maintenance cost as a percentage of ARV sits relative to industry averages and world-class benchmarks. If you are already below benchmark and being asked to cut further, the data makes clear that you are operating at the edge of sustainable maintenance — not with slack to absorb reductions.
Step 04
Tie Every Increase to a Measurable Outcome
Each incremental budget request should connect to a specific, measurable performance outcome: adding PM hours drives PM compliance from 72% to 90%, which is projected to reduce unplanned downtime by 18%, generating $X in production output. The more specific the outcome, the more likely the approval.
KPI Dashboards · Budget Reporting · Leadership Visibility
Get the Data Your Leadership Needs to Approve Your Budget
Oxmaint auto-generates cost breakdowns, PM compliance trends, and performance reports — ready for your next budget presentation.
Common Questions
Maintenance Budget Planning — Questions from Plant Managers and CFOs
What percentage of asset replacement value should a manufacturing plant spend on maintenance?
World-class manufacturing plants spend 1.5–2% of asset replacement value (ARV) annually on maintenance. Industry average is 4–6% — the gap is almost entirely explained by reactive work costs. Plants below benchmark are not saving money; they are deferring cost and accumulating undetected deterioration.
How do I justify increasing the maintenance budget when leadership only sees the cost?
Translate maintenance spend into avoided downtime cost, asset life extension value, and OEE improvement revenue. A $200K increase in PM labor that prevents three major failures worth $500K each in production loss is a $1.3M net return — frame it that way, not as a cost increase.
Should CMMS software be CapEx or OPEX in our maintenance budget?
SaaS-based CMMS subscriptions like Oxmaint are typically classified as OPEX. The justification is straightforward: document the labor efficiency gain from eliminating paper-based workflows, reduced emergency costs from better PM scheduling, and the data infrastructure needed for budget approval itself.
What data do I need before building my 2026 maintenance budget?
At minimum: total maintenance spend by category (labor, parts, contractor), planned vs reactive work ratio, PM compliance rate, major failure events and their downtime cost, and current asset replacement value. A CMMS like Oxmaint generates all of this automatically from work order history.
How far in advance should maintenance budget planning begin for 2026?
Start 90–120 days before the fiscal year end. This allows time to analyze 12 months of work order data, model scenario options, pre-tender contractor work, and present to leadership with enough time for revision cycles before final approval.
Plant Maintenance · CMMS · Asset Management
Stop Building Maintenance Budgets from Spreadsheets
Oxmaint gives you real-time cost data, KPI reporting, and CMMS infrastructure to plan, justify, and track your 2026 maintenance budget with confidence.
![5-year-capital-maintenance-plan-template-for-manufacturing-facilities-[excel]](./manage-post-2k26/uploads/5-year-capital-maintenance-plan-template-for-manufacturing-facilities-[excel].png)