Bearing failures account for 40–50% of all rotating machinery breakdowns in manufacturing — yet every single one of them announces itself through measurable physical signals weeks or months before catastrophic failure occurs. The difference between a planned bearing replacement that costs $800 and an unplanned failure that destroys a shaft, housing, and production schedule costing $40,000 is not luck — it is whether someone was reading those signals. Start monitoring your bearings with OxMaint AI and get your first predictive alert within 10 days, or book a demo to see live bearing fault detection on real industrial equipment.
OxMaint AI · Bearing Failure Prediction
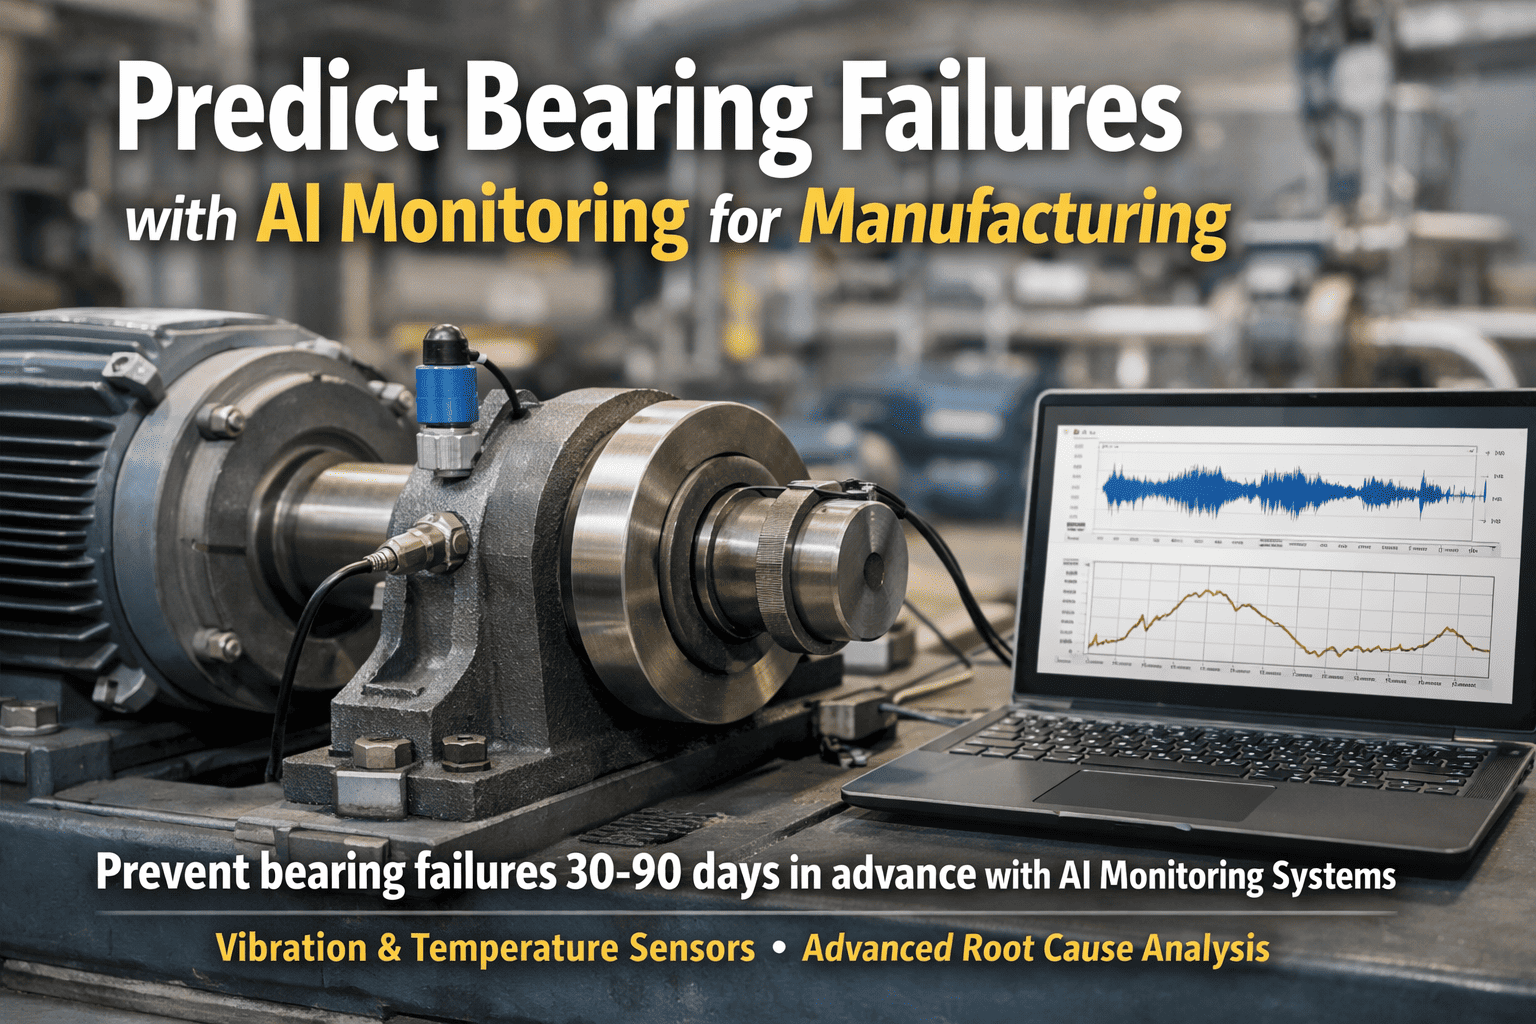
Predict Bearing Failures 30–90 Days Before They Happen
Vibration spectrum analysis, temperature trending, and acoustic emission monitoring — combined in one AI platform that turns raw sensor data into scheduled maintenance work orders.
45%
Of all machinery failures caused by bearings
30–90
Days advance warning AI delivers
50×
Cost difference: planned vs unplanned bearing failure
99.2%
Detection accuracy for Stage 2+ bearing faults
The 4-Stage Bearing Failure Progression — And When AI Detects Each Stage
Bearing failure is not an event — it is a process. The P-F curve (Potential Failure to Functional Failure) for rolling element bearings spans weeks to months. Understanding where in that progression your bearing currently sits is the entire value of AI monitoring. Traditional maintenance catches Stage 3 or Stage 4 — after secondary damage has begun. AI monitoring targets Stage 1 and Stage 2, where intervention is fast, cheap, and non-disruptive.
Micro-cracks form beneath the raceway surface. No external evidence. Only detectable via high-frequency stress wave emission (ultrasonic) and early-stage kurtosis rise in vibration data.
AI Detection Method
Ultrasonic + kurtosis analysis
Warning: 60–90 days out
Defect frequencies emerge in vibration spectrum — BPFO, BPFI, BSF signatures become measurable. Bearing running temperature begins deviating from baseline by 2–5°C.
AI Detection Method
Defect frequency + thermal deviation
Warning: 30–60 days out
Broadband vibration noise floor rises. Temperature increases 5–15°C above baseline. Sidebands appear around defect frequencies. Secondary damage to shaft and housing begins.
AI Detection Method
Broadband RMS + sideband mapping
Warning: 7–30 days out
Audible noise, extreme vibration, severe heat. Secondary damage to shaft, housing, and connected components already occurring. Emergency shutdown is the only safe response at this stage.
AI Detection Method
All sensors — critical alert threshold
Hours to days — emergency
OxMaint AI targets Stage 1 and Stage 2 detection. By the time a bearing reaches Stage 3, the cost of repair has already increased by 4–8× compared to a Stage 1 intervention.
3 Sensor Technologies That Predict Bearing Failure — What Each Measures
No single sensor technology captures the full picture of bearing health. AI bearing monitoring combines three complementary signal types — each revealing a different dimension of bearing condition — and cross-correlates them to confirm faults, suppress false positives, and estimate remaining useful life with high accuracy.
01
Vibration Analysis
Primary bearing fault detection method
Accelerometers mounted on bearing housings capture the full vibration spectrum from 10 Hz to 20 kHz. AI analyses bearing defect frequencies — Ball Pass Frequency Outer race (BPFO), Ball Pass Frequency Inner race (BPFI), and Ball Spin Frequency (BSF) — specific to each bearing geometry. The presence, amplitude, and sideband structure of these frequencies map precisely to fault type and severity.
Detection Earliest Stage
Stage 1–2
Fault Types Identified
Outer race, inner race, ball, cage
Advanced Warning
Up to 90 days
Installation Complexity
Low — surface-mount sensor
02
Temperature Monitoring
Lubrication and load condition indicator
PT100 or thermocouple sensors measure bearing housing temperature continuously. The absolute value matters less than the rate of change and deviation from load-normalised baseline. A bearing running 3°C above its established baseline at identical load and ambient conditions is showing a lubrication or load distribution anomaly — even if the absolute temperature looks normal. AI applies load correction factors to remove false signals from legitimate operating changes.
Detection Earliest Stage
Stage 2
Fault Types Identified
Lubrication failure, overload, contamination
Advanced Warning
30–60 days
Installation Complexity
Very low — standard probe
03
Acoustic Emission
Earliest-stage micro-crack detection
Acoustic emission (AE) sensors detect ultrasonic stress waves in the 100–300 kHz range produced when micro-cracks propagate or surfaces contact under stress. This is the earliest detectable signal of bearing deterioration — often present 60–90 days before vibration analysis picks up a defect frequency. In slow-speed bearings (below 100 RPM) where vibration analysis loses sensitivity, AE monitoring is the primary and often only effective detection method.
Detection Earliest Stage
Stage 1
Fault Types Identified
Sub-surface fatigue, micro-cracking
Advanced Warning
Up to 90 days
Best Application
Slow-speed, critical bearings
AI Root Cause Analysis: Why the Bearing Failed — Not Just That It Failed
Traditional condition monitoring tells you a bearing is failing. AI root cause analysis tells you why — which is the information you need to prevent the next failure, not just fix the current one. Each root cause produces a distinct pattern across sensor channels that AI learns to recognise and classify with high confidence.
Root Cause
Inadequate Lubrication
VibrationHigh-frequency random noise increase; kurtosis spike without defect frequency
TemperatureProgressive rise 5–15°C above load-corrected baseline
AEBurst-type emissions increasing in frequency
Intervention: Re-lubrication or lubrication system inspection before bearing replacement needed
Root Cause
Shaft Misalignment
Vibration1× and 2× running speed amplitude elevated; axial vibration disproportionately high
TemperatureAsymmetric heating across bearing faces
AEContinuous-type emissions during load cycles
Intervention: Alignment correction — replacing bearing without fixing alignment will repeat failure within weeks
Root Cause
Overloading
VibrationDefect frequencies appear early and progress rapidly; high sub-synchronous content
TemperatureLoad-correlated temperature exceedance — rises proportionally with production load
Motor CurrentCurrent draw elevated proportionally to temperature increase
Intervention: Load management review or bearing uprating — failure recurs if root cause load is not addressed
Root Cause
Contamination
VibrationIrregular impulsive events at non-harmonic frequencies; random spike pattern
TemperatureIntermittent spikes correlated with production cycles
AEHigh-amplitude burst emissions irregularly timed
Intervention: Seal inspection and replacement; ingress pathway elimination before re-installation
OxMaint's AI classifies root cause automatically and includes it in the maintenance work order — so technicians arrive with the right parts and the right corrective action, not just the replacement bearing.
OxMaint · Bearing Condition Monitoring
Know exactly which bearing is failing, why it is failing, and how many days you have left to act.
OxMaint connects to your existing sensors and delivers Stage 1 bearing fault alerts with root cause classification — automatically, from day 10 of deployment.
Bearing Monitoring Methods Compared: Manual, Periodic, and AI Continuous
Not all bearing monitoring is equal. The method determines the detection lead time, the false positive rate, and ultimately whether you catch the fault early enough to act cheaply — or late enough to pay the full failure cost.
| Criteria |
Manual Inspection |
Periodic Vibration Routes |
AI Continuous Monitoring |
| Detection lead time |
Hours to days (Stage 3–4) |
Days to 2 weeks (Stage 2–3) |
30–90 days (Stage 1–2) |
| Coverage |
Spot-check only |
Monthly or quarterly |
24/7 continuous |
| Root cause identification |
Subjective |
Analyst-dependent |
Automated classification |
| False positive rate |
High (human judgment) |
Medium (single sensor) |
Low (multi-sensor AI) |
| Intervention cost (avg) |
$18,000–$45,000 |
$4,000–$12,000 |
$800–$3,500 |
| Secondary damage rate |
58% |
24% |
Less than 3% |
| Skilled analyst required |
Yes |
Yes |
No — AI automates analysis |
Cost data reflects manufacturing sector benchmarking across motors, pumps, fans, and gearbox applications. AI continuous monitoring figures reflect facilities using multi-sensor input with ML anomaly detection trained on bearing failure physics.
Bearing Failure Impact by Application Type
Bearing criticality varies widely by application. A failed bearing in a low-speed cooling fan is an inconvenience — a failed bearing in a high-speed paper machine roll or a cement kiln drive is a production-stopping event with seven-figure consequences. AI monitoring priority should be weighted by the consequence of failure, not just the failure probability.
Electric Motors
80% of motor failures are bearing-related
Bearing failure is the dominant motor failure mode across all sizes and speeds. Motor bearing monitoring via vibration and motor current signature analysis together provides the most cost-effective coverage — no shaft access required for MCSA.
Speed range: 100–3,600 RPM
Pumps
Avg pump MTBF: 3 years without monitoring
Pump bearings are subject to combined radial and axial loads that vary with flow conditions. AI monitoring correlates vibration data with process flow rate and pressure to normalise bearing health readings against actual operating conditions — eliminating false alarms from legitimate load changes.
Speed range: 800–3,600 RPM
Gearboxes
Bearing failures cause 51% of gearbox failures
Gearbox input and output shaft bearings operate at different speeds and loads, requiring separate monitoring parameters for each bearing position. Oil temperature monitoring combined with vibration at gear mesh frequencies distinguishes bearing faults from gear tooth faults — preventing misdiagnosis and unnecessary overhauls.
Multiple shaft speeds
Fans & Blowers
Imbalance causes 70% of fan bearing failures
Fan and blower bearings are highly sensitive to mass imbalance from blade fouling or erosion — which manifests as elevated 1× running speed vibration. AI monitoring separates bearing fault signatures from imbalance-driven vibration, identifying which root cause is driving bearing deterioration for precise intervention.
Speed range: 200–3,600 RPM
Slow-Speed Equipment
Below 100 RPM — vibration analysis loses effectiveness
Kilns, mixers, crushers, and paper machine rolls operating below 100 RPM produce vibration signals too weak for standard accelerometer-based analysis. Acoustic emission monitoring is the primary detection technology for slow-speed bearings — detecting stress wave emissions directly at the bearing surface regardless of shaft speed.
Speed range: 1–100 RPM
High-Speed Spindles
Failure cost: $50K–$500K per event in CNC environments
Machine tool spindle bearings operating above 10,000 RPM require specialised high-frequency vibration analysis with precision temperature monitoring. The failure consequence — spindle replacement, machine calibration, and lost precision — makes these the highest-value bearings to monitor in any machining facility.
Speed range: 5,000–60,000 RPM
How OxMaint Delivers Bearing Failure Prediction in Practice
OxMaint is not a data display tool — it is a maintenance decision engine. Every bearing data stream flowing into OxMaint exits as an actionable maintenance work order with fault classification, severity rating, intervention recommendation, and estimated remaining useful life. Here is the exact operational flow.
01
Sensor Integration
OxMaint ingests vibration, temperature, and AE data from existing sensors via OPC-UA, Modbus, or direct API. Bearing geometry data (BPFO, BPFI, BSF, FTF frequencies) is loaded per asset for frequency-specific fault detection.
02
Baseline Learning
A 7-day baseline period establishes load-normalised health fingerprints for each bearing position — accounting for speed variation, load cycling, and ambient temperature effects that would otherwise generate false alerts.
03
Continuous AI Analysis
Multi-sensor anomaly detection runs 24/7 — correlating vibration spectrum, temperature deviation, and AE signal changes to classify fault type, confirm severity stage, and suppress false positives through multi-channel confirmation logic.
04
Work Order Generation
Confirmed bearing faults automatically generate a prioritised maintenance work order containing fault type, root cause classification, severity rating (Stage 1–4), estimated remaining useful life, and recommended intervention action with part specification.
10 days
Time to first predictive alert after deployment
99.2%
Detection accuracy for Stage 2+ bearing faults
Less than 2%
False positive rate with multi-sensor confirmation
40%
Average maintenance cost reduction in year one
Frequently Asked Questions
How many sensors do we need per bearing to use OxMaint effectively?
For most rotating equipment, a single triaxial accelerometer and one temperature probe per bearing position provides sufficient data for Stage 2+ detection. For critical bearings where Stage 1 detection is required — such as kiln drives or high-value spindles — adding an acoustic emission sensor extends detection to 60–90 days in advance.
Book a scoping call and OxMaint's deployment team will specify the minimum viable sensor set for your specific asset criticality profile and existing infrastructure.
Can OxMaint detect bearing faults on slow-speed equipment below 100 RPM?
Yes — standard vibration analysis loses sensitivity below 100 RPM because defect frequency amplitudes become too small relative to background noise. OxMaint supports acoustic emission monitoring as the primary detection method for slow-speed applications including kilns, paper machine rolls, crushers, and agitators. AE signals are independent of shaft speed, making them equally effective at 5 RPM and 500 RPM.
Start your free trial and configure slow-speed bearing positions with AE input during the initial asset setup.
Does OxMaint tell us why a bearing is failing, or just that it is failing?
OxMaint performs automated root cause classification as part of every bearing fault alert — identifying whether the failure driver is inadequate lubrication, misalignment, overloading, contamination, or a primary material defect. This classification is based on the multi-sensor pattern signature associated with each root cause, not just the presence of a defect frequency. The root cause classification is included in the generated work order so technicians arrive with the corrective action defined, not just the replacement part.
What happens if a bearing generates a false positive alert in OxMaint?
OxMaint's multi-signal confirmation logic requires anomalies to appear across at least two independent sensor channels before escalating to a work order — significantly reducing false positive rates compared to single-sensor threshold alarms. When a work order is completed and the bearing is found healthy, that result feeds back into the AI model as a negative training example, improving specificity for that asset position over time. Users can also adjust confidence thresholds per asset to match their operational risk tolerance.
Book a demo to see how false positive management is configured in practice.
OxMaint · AI Bearing Failure Prediction
Every Bearing Failure Running in Your Facility Right Now
Is Already Generating the Signal to Prevent It.
OxMaint reads those signals continuously, classifies the fault, identifies the root cause, and delivers a work order before Stage 3 damage begins. Most facilities are live within 10 days — no infrastructure overhaul required.
-in-manufacturing.png)
.png)


.png)