Every hospital's maintenance backlog is a story about risk that hasn't been paid own yet. A 6-week backlog on lobby lighting is a paperwork problem; a 6-week backlog on OR HVAC controls is a survey finding waiting to happen. The difference is measurement — and most hospitals measure backlog as one number when it needs to be measured as a distribution across age, criticality and zone. This guide walks through the KPIs that separate healthy backlog from silent risk, and the recovery moves that actually work, using OXMAINT AI, the AI-powered CMMS built for hospital biomed & facilities teams who need to see the backlog before it sees them.
Hospital Analytics · Backlog KPIs · Risk & Recovery · 2026
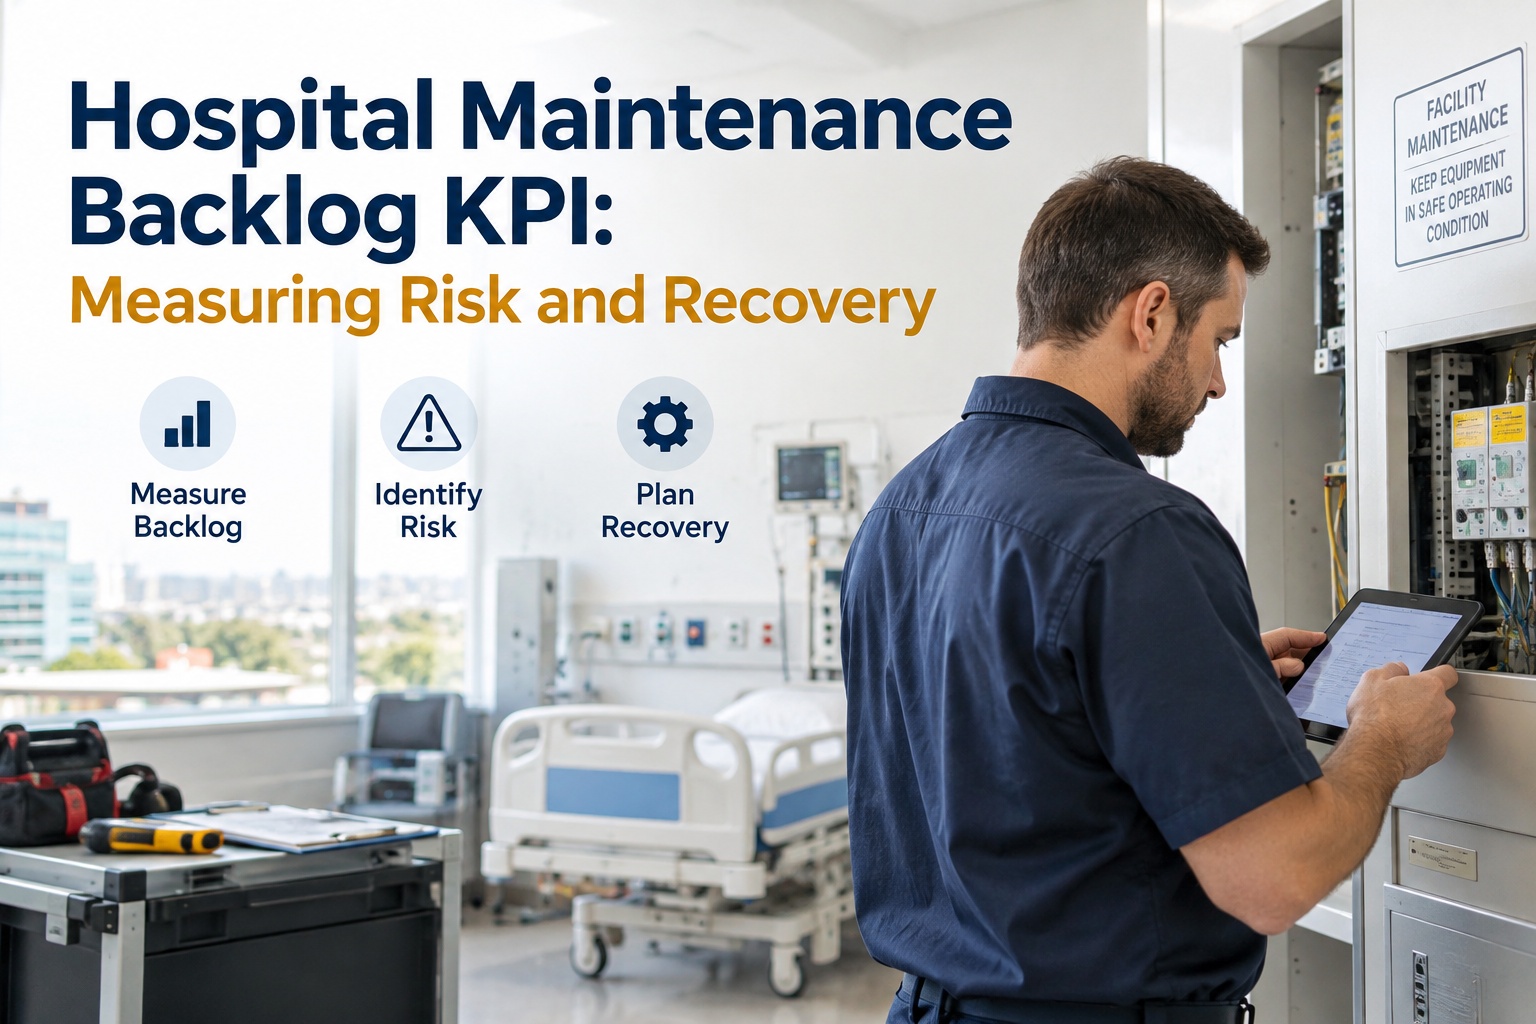
Hospital Maintenance Backlog KPI: Measuring Risk and Recovery
When the backlog is a single number, the risk hides inside it. OXMAINT AI is the AI-powered CMMS/maintenance management software that connects the full workflow on one platform: maintenance requests and inspection findings turn into logged defects, defects become prioritized work orders, and every asset gets its preventive or predictive PM cadence scheduled automatically. Because every step is captured with a timestamp, an asset tag and a criticality score, your backlog stops being one number and starts being a map — of what's aging, where the risk sits, and how fast you're actually recovering.
Requests → Defects → Work Orders
Age & Criticality Scoring
Recovery Velocity Tracking
What "Backlog" Actually Means — A Working Definition
Backlog isn't overdue work. It's the total volume of identified work not yet completed — measured in weeks of remaining labor capacity. A healthy hospital backlog sits between 2 and 4 weeks of forward capacity: enough to keep technicians scheduled, not so much that critical items age past their risk window. Anything below 2 weeks signals under-identification of issues; anything above 4 signals recovery drift. Sign up free and get a live backlog-in-weeks reading in OXMAINT AI.
< 2 wks
Under-Identifying
Inspections not finding what's out there. Risk builds silently.
2–4 wks
Healthy Zone
Steady work flow, identified faster than it ages into risk.
4–8 wks
Recovery Needed
Capacity gap opening. Recovery plan should be active.
> 8 wks
Systemic Risk
Critical items aging past window. Escalation warranted.
The 6 KPIs That Actually Measure Backlog Risk
One number can't tell you whether your backlog is safe or dangerous. Six can. Each of the KPIs below captures a different dimension of the same question — how much unattended work is on the fleet, and how urgent is it? OXMAINT AI computes all six from the same work-order stream that already lives in the platform, so the KPI dashboard is a query, not a report someone has to build. Book a demo to see the full KPI dashboard for your fleet.
K1
Backlog Weeks
Total open-work labor hours ÷ weekly technician capacity. The headline number, but only meaningful alongside K2–K6.
K2
Aged-Backlog %
Share of open work older than its criticality-tier response window. This is where risk actually hides.
K3
T1/T2 Overdue Count
Absolute count of critical & high-priority items past due. A leadership escalation trigger.
K4
Recovery Velocity
Work-orders closed per week minus work-orders opened per week. Positive = shrinking. Negative = growing.
K5
MTTR by Tier
Mean time to repair, split by criticality tier. Rising T1 MTTR is the earliest warning of capacity strain.
K6
MTBF Trend
Mean time between failures for the same asset class. Falling MTBF says the backlog is producing repeat failures.
Backlog Aging Distribution — See Where Risk Concentrates
The single most useful visual in hospital maintenance analytics is the aging distribution — the share of open work at each age band. A backlog that looks fine at "4 weeks" often turns out to have a long tail of 60-day-plus items sitting on critical assets. OXMAINT AI splits every open work-order by age band and criticality tier, so the tail is visible before it becomes an incident. Start free and pull your own aging distribution in OXMAINT AI.
Open Work Orders by Age Band — Illustrative Fleet
38%0–14 days
27%15–30 d
19%31–60 d
11%61–90 d
5%90+
Healthy tail: 65% of open work is under 30 days — freshly identified, not yet aging into risk.
Watch band: 30% between 31–90 days. Recovery velocity needs to stay positive.
Risk tail: 5% past 90 days. Every T1/T2 item in this tail deserves individual review.
The Risk Heatmap — Age × Criticality
Age alone doesn't measure risk; neither does criticality. Multiplied together, they produce the heatmap every facilities director should have on a wall. A T1 asset (life-support, imaging, sole chiller) at 60+ days open is a different problem from a T4 asset at 60+ days open, and the heatmap makes that difference visible. OXMAINT AI generates this map live from the open-work stream. Book a demo to see your own risk heatmap in OXMAINT AI.
Backlog Risk Heatmap — Open Work Orders
0–14 d
15–30 d
31–60 d
60+ d
T1 Critical
8
4
2
1
T2 High
22
14
9
4
T3 Standard
41
28
17
8
T4 Low
33
19
12
6
Acceptable
Watch
Recover now
Escalate
A Backlog You Can Only See As One Number Is a Backlog You Can't Recover.
OXMAINT AI splits every open work-order by age, tier and zone from the moment it's logged — so recovery decisions are made against evidence, not against gut feel.
What Feeds Backlog Growth — The 5 Root Drivers
Backlog doesn't grow because technicians are lazy. It grows because five upstream conditions keep pushing more work into the queue than capacity can absorb. Identifying which of the five is dominant at your hospital is step one of any recovery. Sign up free and diagnose your dominant driver in OXMAINT AI.
BACKLOG GROWTH
Inspection Surge
A new inspection cycle uncovers defects that were always there. Healthy — but capacity has to absorb it.
PM Slippage
Preventive tasks skipped or deferred convert into unplanned defects at 2–3× the labor cost.
Repeat Failures
The same asset failing multiple times signals root cause not addressed — every recurrence adds to the queue.
Parts Delay
Work-orders that could close today waiting for a part tomorrow — the silent driver most CMMS dashboards miss.
Skill Gap
Certain work only one technician is qualified for. Their leave becomes a backlog spike.
The Recovery Playbook — A 60-Day Sequence
Recovering a bloated backlog is not one project — it's a sequence. Skipping straight to "close more work" without triaging first tends to close low-risk items while T1 items keep aging. The three-phase playbook below is what disciplined facilities teams use, and it maps directly to how OXMAINT AI structures a recovery view. Book a demo to walk through the recovery playbook on your fleet.
Phase 1
Days 1–15
Triage & Freeze
Re-score every open work-order on criticality & age
Freeze new non-critical intake for 10 working days
Identify all T1/T2 items past their response window
Publish the aging distribution to leadership
Phase 2
Days 16–40
Concentrated Burn-Down
Dedicate 60% of tech capacity to T1/T2 aged items
Batch same-asset-class WOs to reduce setup time
Escalate parts-blocked items to procurement daily
Track recovery velocity — target positive by day 20
Phase 3
Days 41–60
Steady-State Discipline
Re-open normal intake with tier-scored routing
Set weekly cadence: aging review + velocity check
Address the dominant root driver identified above
Publish monthly KPI scorecard to leadership
Recovery Velocity — The Number That Predicts Everything Else
Every other KPI is a snapshot. Recovery velocity is the trajectory. Positive velocity means you're closing more than you're opening — the backlog is shrinking, and every other KPI will follow. Negative velocity means the opposite, and even a fresh backlog will age into risk within weeks. OXMAINT AI tracks weekly velocity per site and per team so course corrections happen before the aging tail forms. Sign up free and track your first velocity reading in OXMAINT AI.
▼
Negative
Opens > Closes
Backlog growing. Every week of drift adds 5–8% to aged-backlog % within 90 days.
Trigger a Phase 1 triage immediately.
▶
Flat
Opens ≈ Closes
Steady state, but no recovery on any existing aged tail. Fine short-term, dangerous long-term.
Reallocate 15–20% of capacity to the aged tier.
▲
Positive
Closes > Opens
Backlog shrinking. Aged tail contracting week over week. All other KPIs improve as a downstream effect.
Maintain cadence, publish weekly progress.
Backlog Composition — Not All Work Weighs the Same
A 200-hour backlog of routine PM tasks is not the same as a 200-hour backlog of unplanned corrective work — and the ratio of the two tells you whether your maintenance program is proactive or reactive. Below is the composition split OXMAINT AI generates as a standing report. Reactive-heavy composition (right side dominant) is the shape of a program losing ground; PM-heavy composition (left side dominant) is a program in control. Book a demo to see your own composition split.
Illustrative Backlog Composition — Same Hospital, Two States
Proactive State
PM 52%
Insp 22%
Pred 14%
Corr 12%
Reactive State
PM 18%
Insp 12%
Pred 6%
Corrective 64%
Preventive PM
Inspection Findings
Predictive Alerts
Corrective / Unplanned
The healthier the program, the smaller the corrective slice. Track this ratio weekly.
How OXMAINT AI Turns Backlog Into a Recovery Plan
OXMAINT AI captures every step of the workflow — request or inspection finding, logged defect, prioritized work order, PM cadence — on one platform, so the KPIs on this page are outputs of the software rather than reports someone has to assemble. Below is how each capability maps to the recovery workflow. Sign up free and start seeing backlog by age & tier in OXMAINT AI.
◆
Age & Tier Auto-Scoring
Every open work-order carries a criticality tier and an age counter — the two dimensions the heatmap needs.
◆
Live Aging Distribution
The aging bar updates in real time as work-orders open, age & close. No monthly report cycle.
◆
Recovery Velocity Tracker
Weekly opens vs closes per team & per site, with trend lines that flag negative velocity before it becomes a crisis.
◆
Root-Driver Diagnostics
Backlog growth broken down across the five root drivers so recovery targets the actual cause.
◆
Parts-Blocked Isolation
Work-orders waiting on parts are separated from work-orders waiting on labor — different problem, different fix.
◆
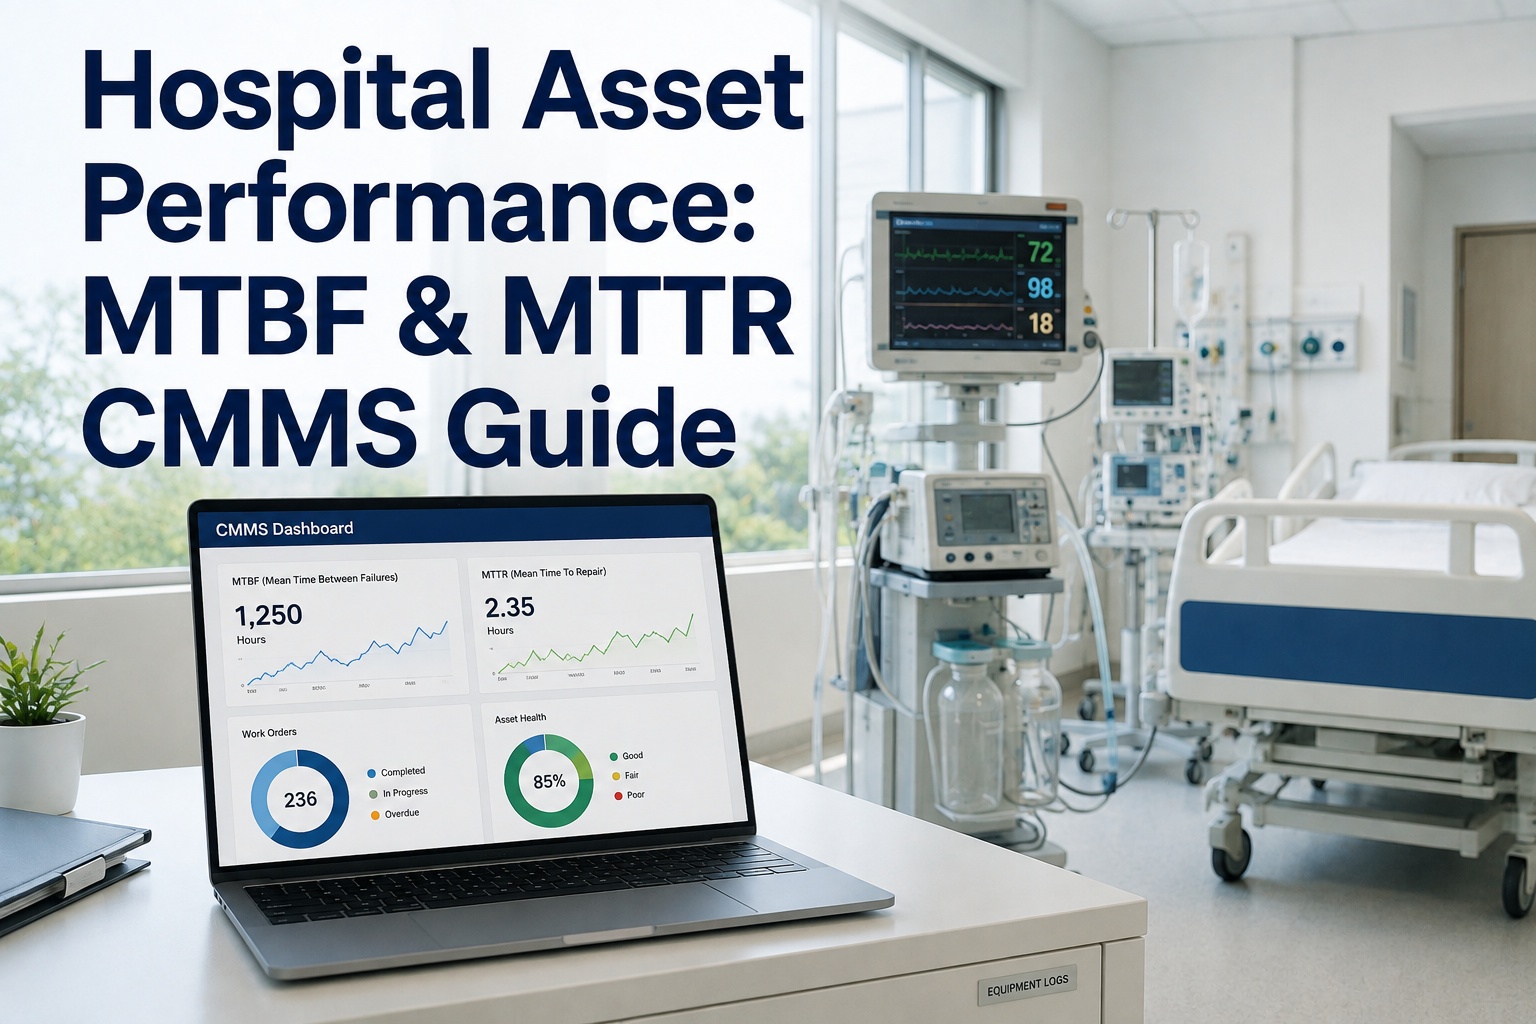
MTTR / MTBF by Class
Reliability trending per asset class so you can tell when the backlog is producing repeat failures.
We were told our backlog was 'fine — around four weeks.' Once we split it by age and tier we found a 90-day tail on infection-control HVAC that nobody had eyes on. The single-number view had been hiding it for months.
— Facilities Director, Regional Acute-Care Hospital
Frequently Asked Questions
Is a low backlog always a good sign?
Not necessarily. A backlog under 2 weeks in a hospital of any size usually means inspections aren't finding what's out there — issues are being lived with rather than logged. The healthiest signal is a stable 2–4 week backlog with a small aged tail and positive recovery velocity.
Start free and read your own health signal in OXMAINT AI.How often should we review the backlog KPIs?
Recovery velocity and T1/T2 overdue count deserve a weekly look — they change fast. The aging distribution and composition split are more useful monthly, because the shape of the distribution is what tells the story. MTTR & MTBF trends need a rolling 90-day view to be meaningful.
Book a demo to see the weekly & monthly view together.What's the fastest way to shrink an aged-backlog tail?
Phase 2 of the recovery playbook — a concentrated burn-down where 60% of tech capacity is dedicated to T1/T2 aged items for two to three weeks. The math works: aged items are usually longer-duration jobs, so closing them shifts more hours than closing an equivalent count of fresh items.
Start free and set up a burn-down view in OXMAINT AI.How do MTTR and MTBF fit into backlog analytics?
They're the reliability side of the same coin. Rising MTTR by tier says jobs are taking longer — usually capacity strain or skill-gap issues. Falling MTBF says the same assets are failing more often — usually a sign that deferred PM work is generating repeat corrective work. Both are early warnings that backlog is about to grow.
Book a demo to see the reliability view in OXMAINT AI.Can we roll up backlog KPIs across multiple sites?
Yes — the same age & tier scoring works across a portfolio, so leadership can see a system-level heatmap and drill into any campus. The rollup also lets you compare recovery velocity between sites, which tends to surface where a playbook is working and where it isn't.
Sign up free and set up your portfolio rollup in OXMAINT AI.
Stop Measuring Backlog As One Number. Start Measuring It As Risk.
OXMAINT AI gives hospital biomed & facilities teams the age-and-tier view of every open work-order, the live recovery-velocity tracker, and the root-driver diagnostics that turn a bloated backlog into a plan. Start free, or book a walkthrough with an engineer who works with hospital teams.