In the public sector, transparency and efficiency are not just goals—they are mandates. When citizens question how tax dollars are utilized for infrastructure, relying on outdated spreadsheets and fragmented records creates a massive liability gap. To ensure trust and operational success, municipalities must track government maintenance KPIs that demonstrate public accountability — work order response time, PM completion rate, cost per facility sq ft, citizen satisfaction scores, and deferred maintenance reduction trends. By centralizing this data, public works departments can transition from reactive guesswork to objective, data-backed capital planning, enhancing overall public sector performance. Talk to our team about deploying an automated government maintenance dashboard today.
Government Performance Measurement
Government Maintenance KPIs: Metrics for Public Accountability and Operational Excellence
Modernize municipal maintenance reporting with real-time government maintenance analytics, streamlining city operations metrics for roads, utilities, and facilities.
45%
Increase in PM completion rate via automated scheduling
3x
Faster work order response time for public requests
15%
Reduction in cost per facility sq ft
4.8/5
Average citizen satisfaction scores achieved
Why Legacy Municipal Maintenance Reporting Fails
Municipalities relying on paper clipboards and isolated software to manage critical infrastructure cannot effectively track government maintenance KPIs. Legacy methods obscure true city operations metrics. A citizen complaint received manually is often lost in translation. Without a centralized government maintenance dashboard, departments allocate budgets blindly, leading to inefficient spending and a growing backlog. Oxmaint transforms this model by treating public works KPIs as live, strategic assets. Start Free Trial.
The Six Roadblocks to Public Accountability Maintenance
Data Silos
Hidden
Municipal maintenance metrics are trapped in disparate systems, making holistic reporting impossible.
Poor Response
Slow
Work order response times lag due to manual dispatching, frustrating citizens and staff alike.
Deferred Backlogs
Rising
Budget is consumed by emergency repairs, derailing deferred maintenance reduction trends.
Low Visibility
Blind
Lack of municipal efficiency metrics prevents data-driven Capital Improvement Planning (CIP).
Budget Waste
High
Inability to track cost per facility sq ft leads to severe resource misallocation across departments.
Public Distrust
Risk
Failing to publish government performance measurement data lowers citizen satisfaction scores.
The KPI Lifecycle: From Request to Resolution
A successful public sector performance program follows a structured data lifecycle. It moves from citizen request to operational action. By leveraging government maintenance analytics, municipalities can process thousands of data points into a cohesive dashboard that drives public accountability maintenance.
The Municipal Efficiency Workflow
Automated tracking for city maintenance benchmarks
Citizen portals and IoT sensors auto-generate requests.
Intake
›
System categorizes and routes tickets to appropriate public works units.
Routing
›
Mobile app alerts field crews to minimize work order response time.
Action
›
Technicians log hours, parts, and updates instantly via mobile.
Tracking
›
Automated alerts notify citizens, boosting citizen satisfaction scores.
Closure
›
Data feeds the government maintenance dashboard for real-time review.
Reporting
Standardize Your Work Order Metrics
Oxmaint centralizes government work order metrics, calculates key benchmarks, and generates compliance-ready municipal maintenance reporting—removing the administrative burden from public works teams.
Core City Maintenance Benchmarks by Category
A transparent city approach applies specific measurement standards to different operational wings. Facilities require cost per square foot tracking, while fleets require PM compliance tracking. Effective platforms unify these municipal efficiency metrics into a single view, allowing leadership to prove public accountability maintenance to stakeholders. Book a Demo.
Key Government Maintenance KPIs
Focus: Work Order Response Time
Time to Acknowledge
Mean Time to Repair
On-Time Completion
SLA Compliance
Outcome: Faster service delivery and higher citizen satisfaction scores.
Focus: PM Completion Rate
PM vs. Reactive Ratio
Schedule Compliance
Inspection Pass Rate
Asset Lifespan Extension
Outcome: Maximized infrastructure health and minimized emergency breakdowns.
Focus: Cost per Facility Sq Ft
Labor Cost Tracking
Parts Spend
Energy Usage
Contractor ROI
Outcome: Optimized budgets and defensible government performance measurement.
Focus: Deferred Maintenance Reduction Trends
Backlog Growth
Capital Forecasting
Risk Mitigation
Grant Audits
Outcome: Clear, data-backed evidence for long-term municipal funding requests.
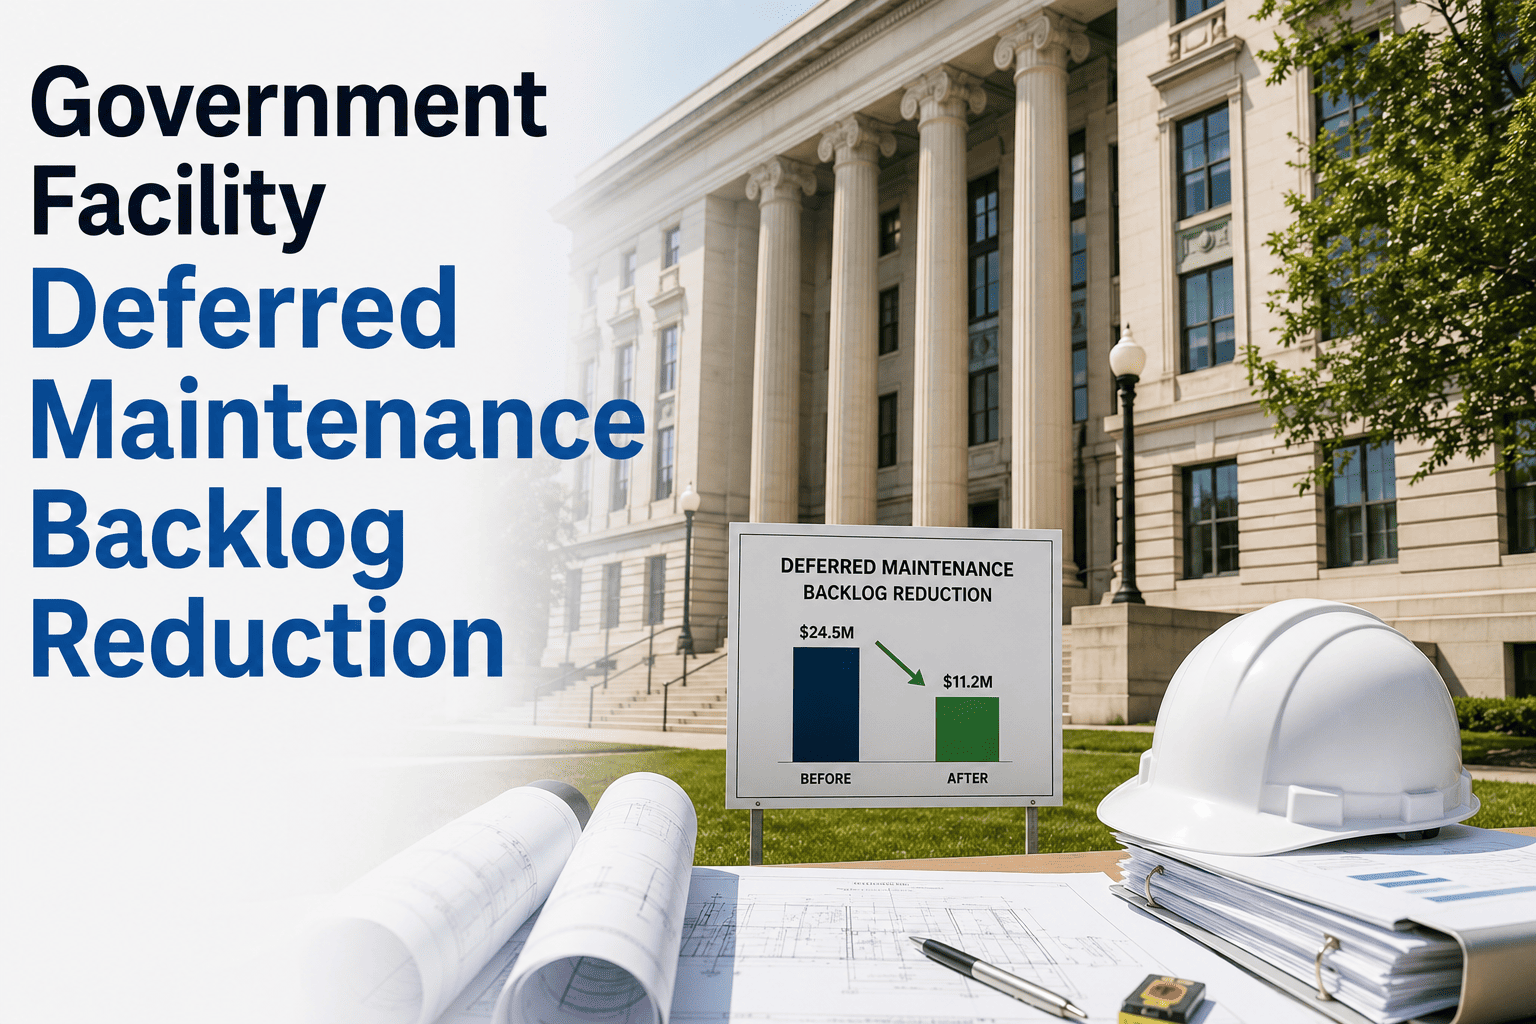
Before & After: The Impact of Government Maintenance Analytics
Moving from undocumented activities to visible municipal maintenance metrics yields massive operational returns. By tracking government work order metrics diligently, public works departments stretch tax dollars further and provide the objective evidence needed to win competitive infrastructure grants and secure council approvals.
Build a Transparent City
Oxmaint provides the digital backbone for your public sector performance strategy—visualizing city operations metrics and ensuring that every dollar spent is accounted for with precise government maintenance KPIs.
Essential Public Works KPIs Outputs
For municipal efficiency metrics to be valuable, they must be easily digestible. Modern platforms generate specific deliverables that engineering, administrative, and finance teams use daily. These outputs validate budget requests and establish rock-solid public accountability maintenance. Start Free Trial.
Government Performance Measurement Outputs
01
Executive Dashboards
Real-time KPI visualization
Benchmark comparison
Council-ready reports
02
Cost Analysis Reports
Facility cost breakdowns
Labor vs. Materials ratio
Contractor spend tracking
03
Response Time Logs
Time-stamped lifecycles
SLA breach alerts
Technician routing
04
PM Compliance Tracking
PM completion tracking
Missed inspection alerts
Regulatory audit trails
05
Citizen Engagement Stats
Satisfaction score tracking
Issue resolution feedback
Public portals
06
Backlog Heatmaps
Deferred reduction trends
High-risk visualization
Funding justifications
Expert Perspective: Accountability Through Data
"
The biggest shift for our municipality was realizing that public accountability isn't just about balancing a ledger—it's about proving operational excellence. Before we had a government maintenance dashboard, answering questions from the city council about our PM completion rate or deferred backlog was a guessing game. By implementing strict municipal maintenance reporting, we finally had the data to back up our budget requests. We reduced our work order response time drastically and, for the first time, could definitively show citizens exactly how their tax dollars were improving their neighborhoods.
— Director of Public Works, Regional Municipality
65%
Faster work order resolutions
20%
Reduction in facility operating costs
100%
Audit compliance achieved
Municipalities that earn high public trust share a common trait: they operate with total transparency. By building a rigorous tracking system for your government maintenance KPIs supported by digital tools, you ensure operational efficiency, justify capital expenditures, and create a better community. Start building your accountability backbone with the tools necessary for modern governance.
Empower Your City Operations
Oxmaint's platform tracks vital government work order metrics, automates PM schedules, and generates the municipal efficiency metrics you need to lead a responsive, data-driven public works department.
Frequently Asked Questions
How do government maintenance KPIs improve public sector performance?
Tracking KPIs like PM completion rate and work order response time forces departments to move from reactive "firefighting" to proactive management. When metrics are visible on a government maintenance dashboard, accountability naturally increases, leading to more efficient resource use, fewer emergency breakdowns, and ultimately higher citizen satisfaction scores.
Why is measuring cost per facility sq ft so critical for municipalities?
Cost per facility sq ft is one of the most vital city maintenance benchmarks because it normalizes spending data across varying building sizes. It allows city managers to identify energy-inefficient buildings, overstaffed facilities, or expensive contractor dependencies, ensuring that tax dollars are optimized across the entire civic portfolio.
How can software help reverse negative deferred maintenance reduction trends?
Deferred maintenance grows when routine preventative tasks are skipped. A CMMS like Oxmaint automates scheduling, ensuring that PMs are completed on time. Furthermore, by providing concrete government maintenance analytics regarding asset deterioration, departments can logically justify necessary budget increases to the city council to address the backlog systematically.
Will my field technicians adopt a new municipal maintenance reporting system?
Yes, if the system is designed for ease of use. Oxmaint focuses on mobile-first execution, allowing field crews to close work orders, log hours, and update city operations metrics directly from their smartphones in seconds. The easier it is for the frontline workers, the more accurate your government performance measurement data will be.
How long does it take to establish baseline public works KPIs?
With a modern platform, basic metrics like work order response time and current PM compliance can be tracked from day one. More complex municipal efficiency metrics, such as accurate cost analyses and long-term deferred maintenance trends, typically establish a highly reliable baseline within 3 to 6 months of consistent system usage.