Public sector agencies across the US carry a combined deferred maintenance backlog exceeding $500 billion — and it grows by 8–10% every year that proactive repairs are postponed. OxMaint's Analytics and Reporting platform turns backlog data into a prioritized, council-ready action plan that helps government facility managers reduce deferred liability, justify capital budgets, and prove asset stewardship to elected officials and auditors.
Public Sector Asset Planning · Analytics & Reporting · 2026
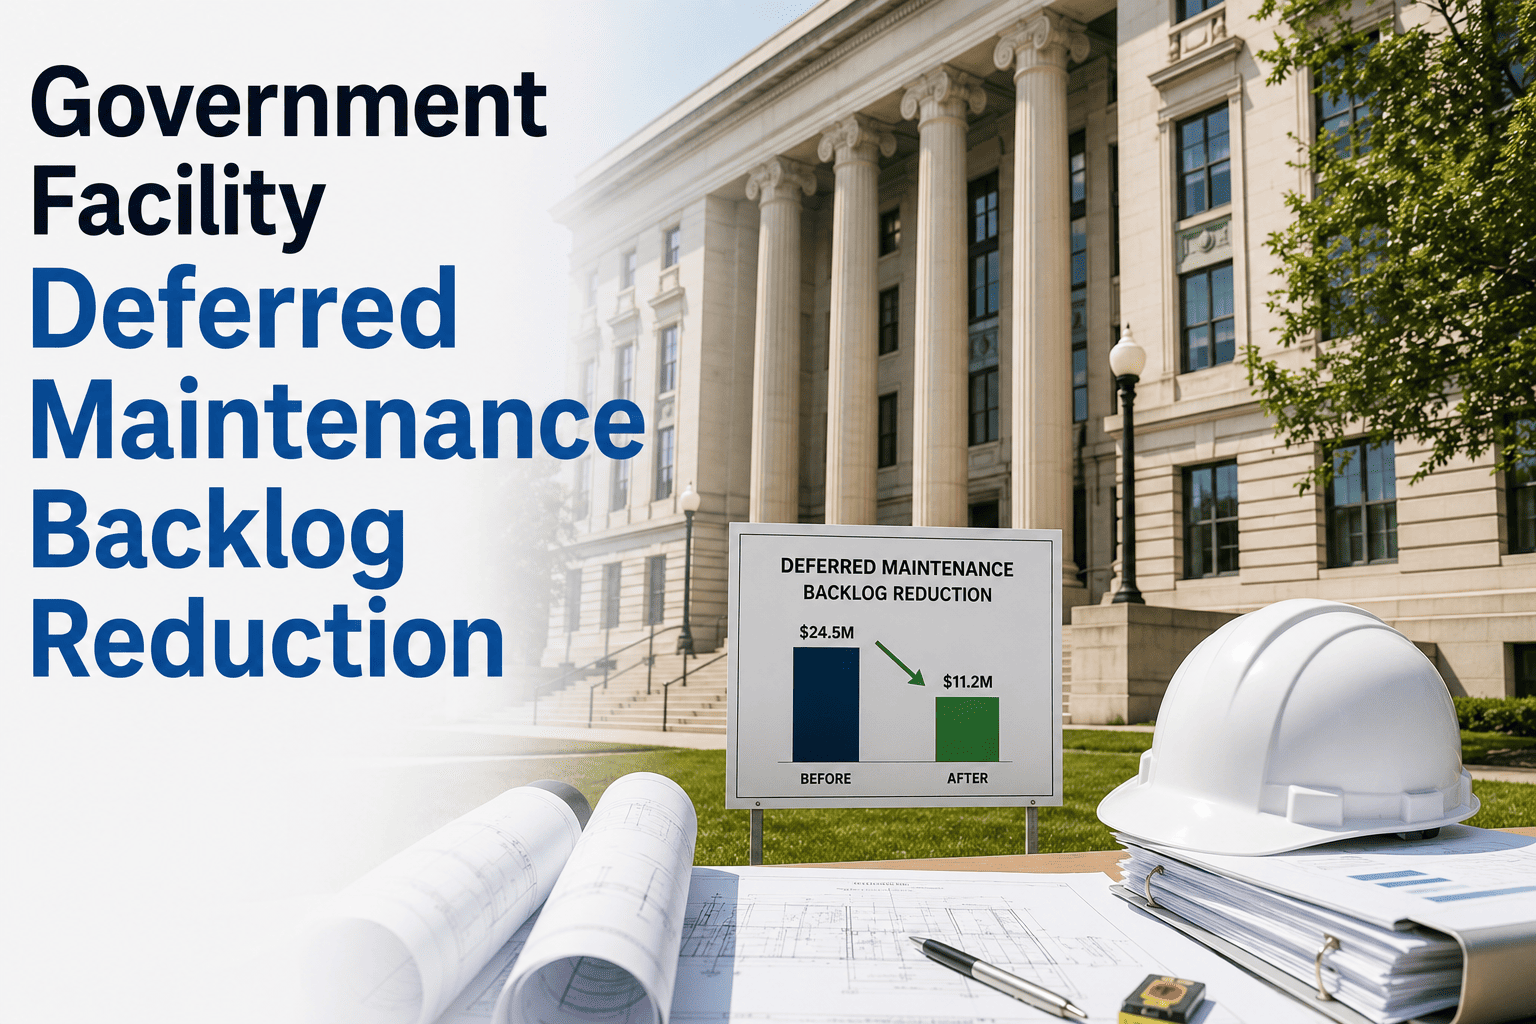
Government Facility Deferred Maintenance Backlog Reduction
Turn your deferred maintenance backlog from a liability into a data-driven capital plan — with OxMaint analytics built for public sector accountability.
$500B+
US public facility deferred maintenance backlog
8–10%
Annual backlog growth without proactive planning
62%
Reduction in backlog growth with CMMS analytics
The Deferred Maintenance Spiral — How It Gets Worse
1
Repair Deferred
Budget pressure pushes non-emergency repairs to next fiscal year. Asset condition worsens silently.
2
Condition Degrades
Deferred item now requires more extensive repair. Estimated cost increases 30–80% from original scope.
3
Secondary Failures
Adjacent systems fail due to untreated root cause. One deferred item becomes three urgent repairs.
4
Emergency Spend
Emergency repair triggered. Cost is now 4–6× the original deferred repair estimate. Backlog grows.
Backlog Priority Matrix — How OxMaint Scores Every Asset
th>Risk Category
| Priority Level |
Condition Score | Recommended Action |
Budget Treatment |
| Critical |
0–25 |
Life-safety / service failure |
Immediate repair |
Emergency supplemental |
| High |
26–50 |
Accelerating deterioration |
Current fiscal year |
Capital priority queue |
| Medium |
51–70 |
Degrading, manageable |
Next 1–2 years |
Capital plan inclusion |
| Low |
71–100 |
Stable, monitor only |
Planned PM cycle |
Operating budget |
What OxMaint Analytics Delivers for Budget Offices
01
Backlog Valuation Reports
Accurate dollar-value assessment of your entire deferred maintenance backlog — broken down by building, system, and priority level. Ready for council presentation in one click.
02
5-Year Capital Forecast
AI-generated capital spending projections based on asset condition trends — helping budget offices plan multi-year appropriations instead of reacting year to year.
03
Cost-of-Delay Modeling
Quantifies the financial penalty of deferring each repair — showing officials the true cost of delay versus the cost of timely maintenance. The most powerful budget justification tool available.
04
Audit-Ready Documentation
Every asset condition assessment, inspection record, and work order is timestamped and exportable — meeting state auditor and federal grant documentation requirements.
Get Your Backlog Under Control — Start Free
OxMaint deploys in 1–4 weeks. Your first backlog valuation report is ready before your next budget meeting.
Backlog Reduction: Before vs. After OxMaint
Metric
Without CMMS
With OxMaint
Backlog visibility
Partial / estimated
100% documented
Budget justification
Narrative-based
Data-driven reports
Audit prep time
3–6 weeks
Under 1 hour
Backlog growth rate
8–10% per year
Reduced to 2–3%
Emergency spend %
28–40% of budget
Below 12%
Expert Review
"Deferred maintenance in public facilities is not a budget problem — it is a data problem. Agencies that cannot quantify their backlog cannot prioritize it, cannot justify capital funding for it, and cannot demonstrate stewardship to oversight bodies. A modern CMMS with analytics capability transforms the backlog from a political liability into a credible capital plan that budget committees can approve with confidence. The cost of inaction compounds every year."
James Whitfield — Senior Advisor, National Association of Public Works Officials; contributing author, APWA Public Infrastructure Asset Management Report 2025
Frequently Asked Questions
How does OxMaint calculate the dollar value of a deferred maintenance backlog?
OxMaint uses condition assessment scores, asset age, replacement cost data, and deterioration rate models to generate a backlog dollar valuation for each facility and asset class. The platform pulls from RSMeans cost databases and local contractor pricing benchmarks to ensure valuations are defensible in budget presentations and audits. Reports are exportable in council-ready format.
See a sample backlog report in the free trial.
Can OxMaint help justify capital budget requests to a city council or legislature?
Yes — OxMaint generates cost-of-delay reports that show elected officials the financial consequence of deferring each capital project. The platform visualises the repair-vs-replace crossover point, the risk-adjusted cost of inaction, and the 5-year capital forecast needed to reverse backlog growth. These reports have directly supported budget approvals for facilities departments in municipalities ranging from 25,000 to 2.4 million residents.
Book a demo to see council-ready report examples.
Does OxMaint support federal grant reporting for infrastructure funding programs?
OxMaint supports documentation requirements for FEMA BRIC, HUD CDBG, and IIJA infrastructure grant programs, including asset condition baselines, maintenance history exports, and project completion documentation. The platform stores all records in grant-auditable format with chain-of-custody timestamps, reducing grant compliance reporting time by up to 80% compared to manual spreadsheet-based documentation methods.
Turn Your Backlog Into a Budget Win
OxMaint gives public sector facility managers the analytics, documentation, and reporting they need to reduce deferred maintenance and win budget approvals.