A 1,100-bottles-per-minute carbonated soft drink line in Georgia lost 48 minutes on a Thursday evening because a single capper head drifted 4 in-lb below torque spec. The filler upstream kept running for six seconds before backing up; the labeler downstream ran the accumulation buffer dry in ninety. By the time the line restarted, the plant had lost 52,800 units of finished product, one truckload commit, and an entire evening’s changeover window. A bottling line is not a set of independent machines. It is a chain, and reliability is what the chain remembers about every link that has ever failed on it. Explore how OxMaint tracks reliability signals per asset and turns torque drift, vibration creep, and thermal trends into scheduled work before the buffer runs dry — start a free trial to see it live, or book a demo with our team.
Production Uptime / Bottling Line Reliability
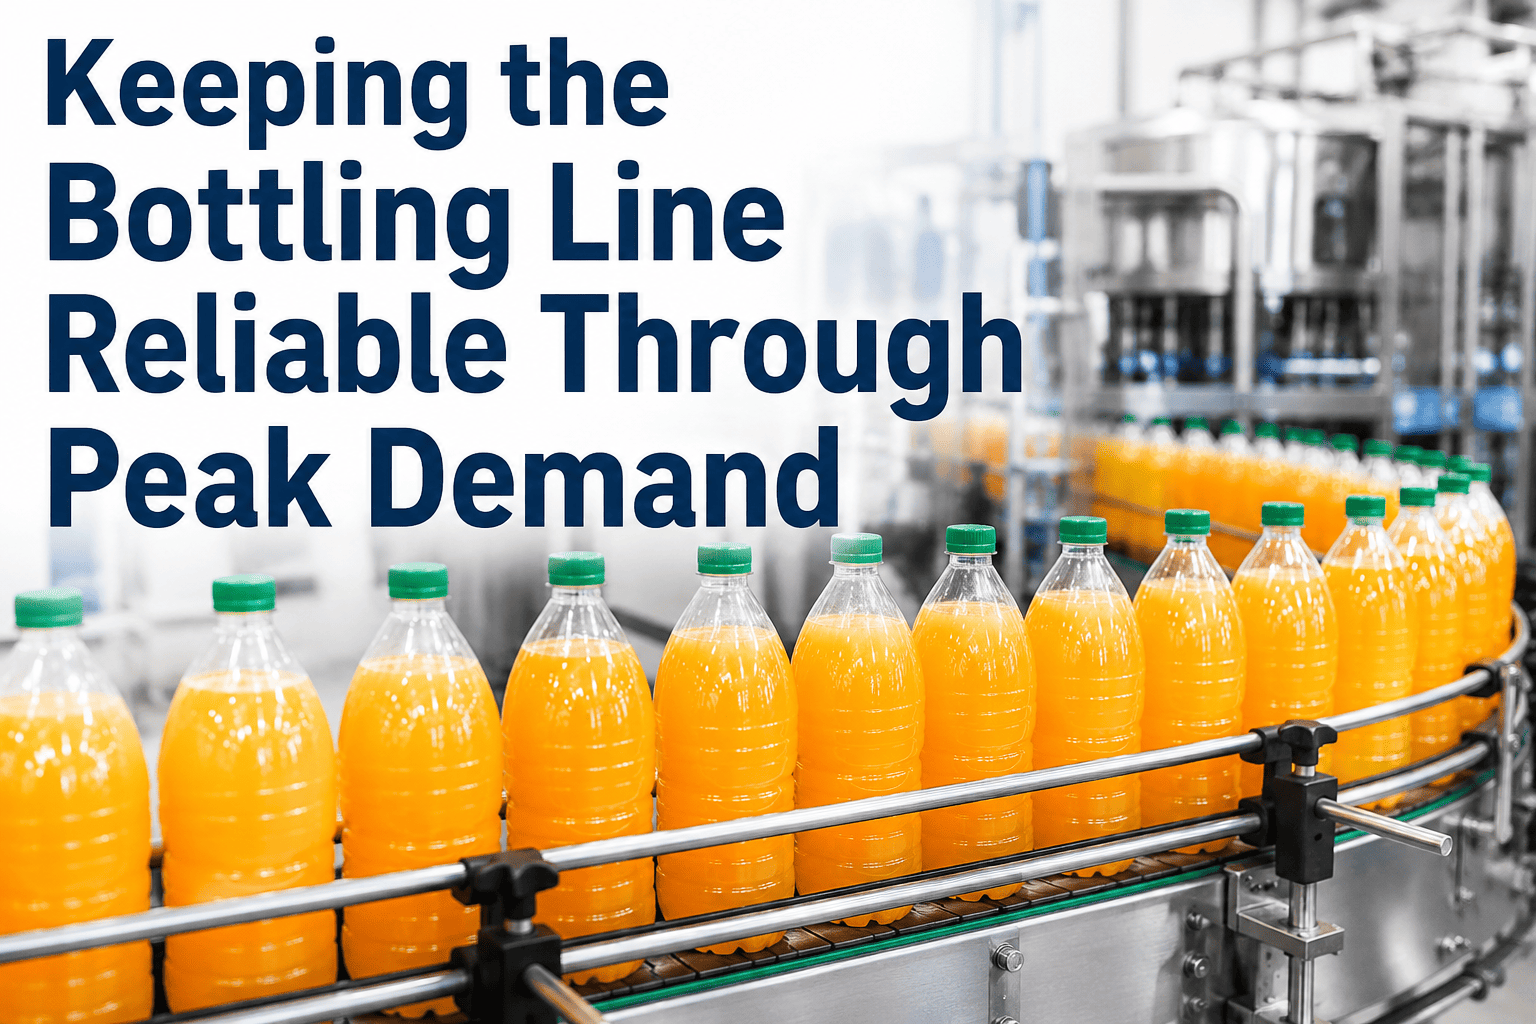
Keeping the Bottling Line Reliable Through Peak Demand
Filler, capper, and labeler coordination is not a controls problem — it is a reliability problem. Track every asset’s failure precursors, coordinate PM around the constraint, and keep the line running at rated speed when the schedule needs it most.
$20k–30k
Cost per hour of unplanned downtime on high-speed bottling lines
69%
Industry avg. bottling OEE vs. 85%+ world-class benchmark
$200k–500k
Annual throughput value per single OEE point on mid-scale lines
6 sec
Median time before a capper fault backs up the filler upstream
The V-Curve of Bottling Line Reliability
In the Theory of Constraints, a bottling line is a V-curve: the filler at the vertex is the constraint that sets rated speed, and every asset upstream and downstream must run measurably faster with accumulation buffers absorbing the difference. Reliability is not about every machine running perfectly — it is about the constraint never being starved and the downstream never being flooded. Get this wrong and the fastest asset on the line becomes the biggest bottleneck.
Upstream
Depalletiser
+12% rated speed
Empty container supply, feeds accumulation table
Rinser / Blow Moulder
+8% rated speed
Container prep, first quality gate
Constraint
Rotary Filler + Capper
Rated speed — the line pace
Runs at maximum sustainable throughput. Every stop at this point costs the whole line, every second.
Downstream
Labeler
+10% rated speed
Draws from accumulator, absorbs capper micro-stops
Packer / Palletiser
+15% rated speed
End of line, protected by inline accumulation
Reliability Targets Are Different for Every Asset
A single OEE target across a bottling line hides where the recoverable capacity actually lives. Fillers, cappers, labelers, and conveyors all have different failure modes, different accumulation protection, and different world-class benchmarks. The reliability programme that treats each asset class on its own schedule is the one that closes the 16-point gap between average and best-in-class.
Rotary Filler
The constraint. Bottleneck losses cascade line-wide — cycle-based nozzle replacement and fill valve seal PMs are non-negotiable.
Capper & Sealer
Torque head calibration weekly, chuck replacement on wear intervals. Sealed containers are mandatory — no partial production possible.
Labeler
Applicator service intervals, adhesive system inspection, web tension monitoring. A 0.5% miss rate on 60k/hr = 300 non-conforming units.
Conveyor & Accumulation
Rarely the bottleneck, but downtime blocks everything. Belt tension, bearing temp, and lubrication programmes are the whole game.
Reliability Lives at the Asset Level
Track Every Filler Head, Every Capper Chuck, Every Labeler Applicator
OxMaint registers every wearing part with its own life history, PM interval, and failure signature — so reliability stops being a shift-level average and becomes a per-asset engineering decision.
The Three Signals That Predict Every Bottling Line Stop
A rotary filler does not fail without warning. A capper head does not lose torque overnight. Nearly every high-speed bottling failure leaves a signal trail days or weeks before it manifests — if the CMMS is set up to see it. The three trends below cover the majority of what breaks a bottling line, and each one is a work order trigger, not a discovery event.
Signal 01
Torque Drift
Capper heads, chuck systems, ROPP
Applied torque falls or rises from set point by even 5–8% before consumer-visible seal failure. Servo current, magnetic clutch position, and per-head torque samples reveal the drift days before quality holds begin.
72 hrsTypical lead time to failure
Signal 02
Vibration Signature
Filler bearings, conveyor drives
Bearing wear on a high-speed rotary filler produces a distinct vibration harmonic weeks before hard failure. Conveyor chain elongation shows up as low-frequency drift on drive current. Neither is invisible — only unmonitored.
2–3 wksTypical lead time to failure
Signal 03
Thermal Creep
Pumps, motors, CIP heat exchangers
A pasteuriser circulation pump running two degrees warmer than baseline is a bearing degradation signature. Thermal creep on drive motors precedes overload trips. Both trend for hours before they matter.
24–48 hrsTypical lead time to failure
What Reliability Really Costs Per Hour
A stop on a bottling line does not cost one machine — it costs the whole line. On a mid-scale carbonated soft drink line at 1,000 bpm, the arithmetic below shows how a single-minute event stacks up. This is why every hour of unplanned downtime justifies a serious reliability programme by lunch.
Minute 1
$400
Direct throughput loss at 1,000 bpm — the container the line failed to make in the first sixty seconds of the stop.
Minutes 2–5
$1.6k
Accumulation depletes downstream; upstream backs up. Filler bowl product ages, carbonation drifts, quality window closes.
Minutes 6–15
$4.5k
Full line halt cascades. Labor stands idle, CIP re-cycle may be required if bowl product is dumped. MTTR clock ticks against the shift.
Beyond 15 min
$20k+
Truckload commits at risk. Overtime authorised. Corrective maintenance without spares triggers rush freight. Quality holds pending re-inspection.
How OxMaint Runs Bottling Line Reliability
A single reliability workbench for the filler, capper, labeler, and everything in between — with the specific PMs, the specific signals, and the specific work orders that keep the constraint running at rated speed.
01
Per-Asset Reliability Register
Every filler valve, capper chuck, labeler applicator, and conveyor drive registered with make, model, install date, and failure history. Reliability decisions live at the head, not the line.
02
Cycle-Based PM Automation
Filler valve seals, capper chucks, and labeler tapes scheduled by production cycles — not by calendar. Wear-life is measured in bottles, and PMs trigger before the wear curve turns vertical.
03
Torque & Vibration Trending
Per-head torque samples logged every shift and trended against tolerance bands. Vibration signatures on rotary bearings monitored for harmonic drift. Both feed work orders before failure.
04
V-Curve Speed Enforcement
Upstream and downstream speed excess relative to the constraint monitored continuously. When accumulation runs below buffer threshold, alerts fire before scrap begins.
05
Failure Playbooks on Mobile
Every recurring stop — a capper torque fault, a star-wheel jam, a filler pressure loss — carries its prior clear time, parts used, and diagnostic notes. Technicians walk in with the answer, not the search.
06
Audit-Ready Torque & QA Logs
Every torque verification, fill accuracy check, and CIP cycle record stored against the asset with digital signatures — ready for the auditor without a scramble.
Reactive vs. Reliability-Driven Bottling
The same 1,000-bpm line, the same operators, the same SKUs — but two very different outcomes depending on whether reliability is a monthly report or a live signal. Book a demo to project the gap on your own line data.
Reactive Baseline
- 69%Sustained OEE across the line
- DiscoveryCapper torque drift found by QA hold, not by trend
- ManualTorque verification logged on paper by shift
- CalendarPMs scheduled by month, not by cycles
- ReactiveRepair after failure, no lead-time to plan
- RushedEmergency spares freighted at premium cost
Reliability with OxMaint
- 82%+Sustained OEE within two improvement cycles
- PredictedTorque drift flagged 72 hours before QA impact
- DigitalPer-head torque logged and trended automatically
- Cycle-basedPMs scheduled by production cycles, not calendar
- ScheduledIntervention planned into changeover window
- StagedSpares pre-positioned per predicted failure profile
What Reliability-Driven Plants Report at 12 Months
52%
Reduction in unplanned bottling line stops within one year
13 pt
Average OEE lift on constraint asset with cycle-based PMs
2.6x
MTBF improvement on high-speed rotary equipment
$4.2M
Avg. annual recoverable throughput per mid-scale bottling line
Frequently Asked Questions
Which bottling line asset should the reliability programme prioritise first?
The filler — it is the constraint that sets rated speed for the whole line. Recovering four OEE points on the filler typically produces more throughput than ten points recovered anywhere else.
Start a free trial and see your constraint’s current profile.
How does OxMaint handle per-head torque tracking on rotary cappers?
Each capping head is registered as its own sub-asset with its own torque tolerance, calibration record, and wear history. Per-shift torque samples trend against tolerance and generate work orders on drift — before a QA hold. Book a demo to see the trending walked through.
Can OxMaint schedule PMs by production cycles instead of calendar dates?
Yes. Filler valve seals, capper chucks, and labeler applicators all trigger PMs by container count, cycle count, or CIP volume — whichever threshold hits first. Wear-life is measured in bottles, and PMs land before the wear curve turns vertical.
How fast do bottling line reliability improvements appear in practice?
Signal baselines populate in the first 2–3 weeks. Documented downtime reduction of 30–54% within two operating cycles is typical. Full asset-level reliability profiles mature over 45–60 days.
Book a demo to see a comparable line’s ramp.
Does OxMaint integrate with existing PLC and SCADA on the bottling line?
Yes. OxMaint ingests PLC and SCADA signals via standard APIs and IoT gateways — torque samples, vibration harmonics, thermal trends, and speed data — without controls modification. The reliability layer sits above the existing automation, not in place of it.
Start Your Bottling Line Reliability Programme
Stop Losing Shifts to Faults You Could Have Predicted.
OxMaint tracks reliability signals per asset, coordinates PMs around the constraint, and turns torque drift, vibration creep, and thermal trends into scheduled maintenance windows — so the bottling line runs at rated speed when the schedule needs it most.