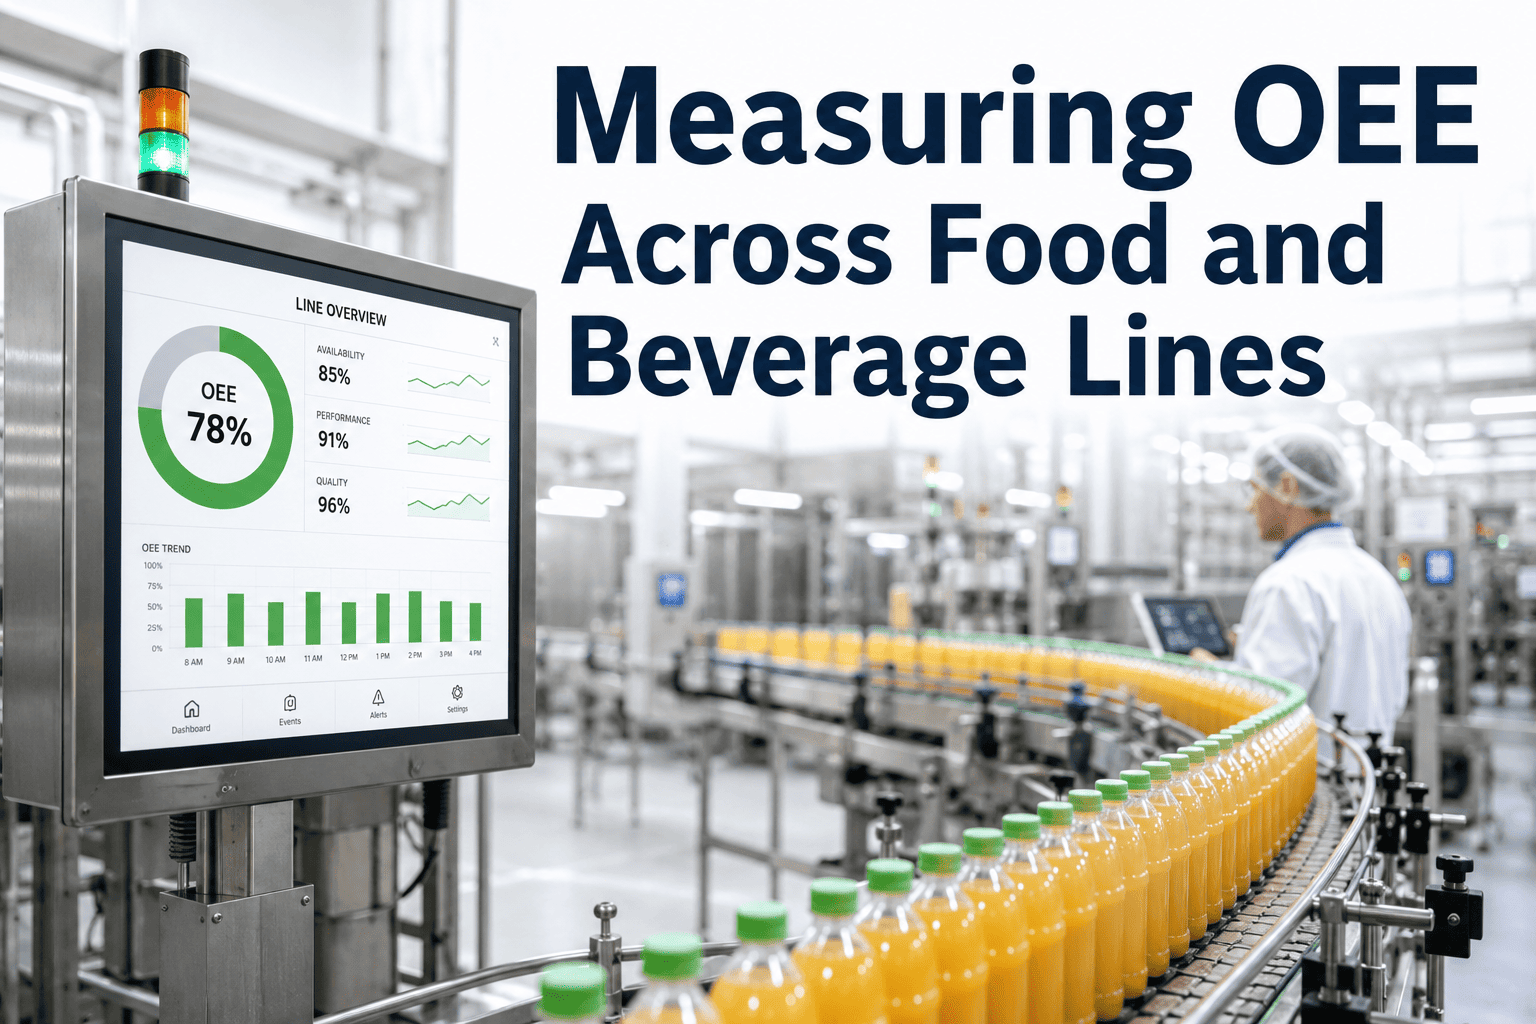
Most food and beverage plants measure OEE wrong before they ever calculate it. A shift report that says "78% uptime" is not OEE, it is one input buried inside three that actually matter: Availability, Performance, and Quality. Get the calculation right and OEE becomes the single number that tells you whether a line is losing money to breakdowns, to slow running, or to product that never should have shipped. Get it wrong and you chase the wrong fix for months. This guide breaks down how to measure OEE correctly on a food or beverage line, what a realistic benchmark looks like for your plant type, and how a connected CMMS closes the measurement gap that spreadsheets always leave open.
The Number On Your Shift Report Is Probably Wrong
Manually logged OEE and sensor-measured OEE rarely agree. Micro-stops under five minutes, the seconds lost to slow-running conveyors, and startup scrap all vanish from a paper log but show up in the output count at the end of the day.
Availability × Performance × Quality, Nothing Else
OEE is a single multiplied score, not an average. A line that is available 90% of the time, runs at 80% of rated speed, and produces 95% good product is not at 88% OEE, it is at 68%. Each factor drags the others down, which is exactly why a single "uptime" number hides so much.
Run time divided by planned production time. Breakdowns, changeovers, and unplanned CIP overruns all cut this number directly.
Actual output divided by the maximum possible output at rated speed. Micro-stops and chronic under-speeding live here, invisible to manual logs.
Good units divided by total units produced. Startup scrap, fill-weight drift, and metal-detect rejects during ramp-up sit inside this factor.
See Your Real OEE, Not The Shift-Report Version
Oxmaint pulls Availability, Performance, and Quality from the same maintenance data you already log, calculates true OEE per line and per SKU, and turns every loss into a work order instead of a footnote.
Stop Benchmarking Against A Number Built For Car Factories
The 85% "world-class" figure came out of discrete automotive and electronics manufacturing, lines with low product mix and no mandatory sanitation. Food and beverage plants carry structural losses those industries never see, so the honest comparison looks different.
| Plant Type | Typical OEE Range | Realistic Target | Dominant Loss |
|---|---|---|---|
| High-volume beverage bottler, dedicated line | 60% - 70% | 78% - 82% | Changeover and CIP frequency |
| Multi-SKU packaged food line | 50% - 60% | 70% - 75% | Micro-stops and speed drift |
| Ready-meal or multi-component tray line | 40% - 55% | 65% - 70% | Allergen changeovers |
| Dairy or bakery with continuous process | 55% - 65% | 75% - 80% | Startup scrap after CIP |
The Six Losses Hiding Inside Every OEE Score
Every point of OEE lost on a food or beverage line falls into one of six buckets. Knowing which bucket is draining a line tells maintenance, scheduling, or quality exactly where to look first.
Unplanned equipment failure that halts the line mid-run, the loss every reactive maintenance program is built to hide.
Time lost switching SKUs, formats, or allergens, partly structural but frequency and duration can both be trimmed.
Jams, sensor faults, and short stalls under five minutes, rarely logged by hand but the single largest recoverable gap.
Running below rated speed to protect a worn component or compensate for upstream variability, quietly eating throughput.
Scrap generated while a line stabilizes after a changeover or CIP cycle, before fill weight and seal integrity settle.
In-run defects caught by metal detection, checkweighers, or vision systems once the line is already at speed.
Measurement That Turns Into A Work Order
A correct OEE number is only useful if it triggers action. Oxmaint links every Availability, Performance, and Quality loss straight back to the asset, the shift, and the maintenance record that explains it.
Availability, Performance, and Quality calculated continuously from maintenance and downtime data already flowing through the system.
Short stops that never make a paper shift log are captured and rolled into Performance loss automatically.
A recurring breakdown or speed loss on a specific asset opens a maintenance task instead of sitting in a report nobody reads.
Sanitation and allergen changeover records are timestamped and stored, supporting SQF and BRCGS documentation without extra paperwork.
Moving A Line From Honest Measurement To Real Improvement
Plants that move their OEE score meaningfully rarely do it with a single fix. The improvement follows a sequence, and skipping the first step is why most OEE programs stall after the first quarter.
Replace the shift-report estimate with sensor or maintenance-linked data before setting any improvement target.
Identify whether a given line is bleeding Availability, Performance, or Quality, since the fix for each is different.
Fix the single biggest loss category before spreading effort across all six, compounding gains are faster this way.
Confirm the fix moved the number, then move to the next loss bucket, a realistic pace is 10 to 15 points over a year.
Frequently Asked Questions
Why is 85% the wrong benchmark for a food or beverage line?
What is the biggest recoverable loss on most food lines?
How does a CMMS improve OEE measurement accuracy?
Is CIP time counted as an OEE loss?
How fast can a plant realistically improve OEE?
Every Point Of OEE Is Capacity You Already Paid For
A line moving from 60% to 75% OEE adds the equivalent of another packaging line without a dollar of capital spend. See where your Availability, Performance, and Quality losses actually sit, per line and per SKU, within the first 30 days.