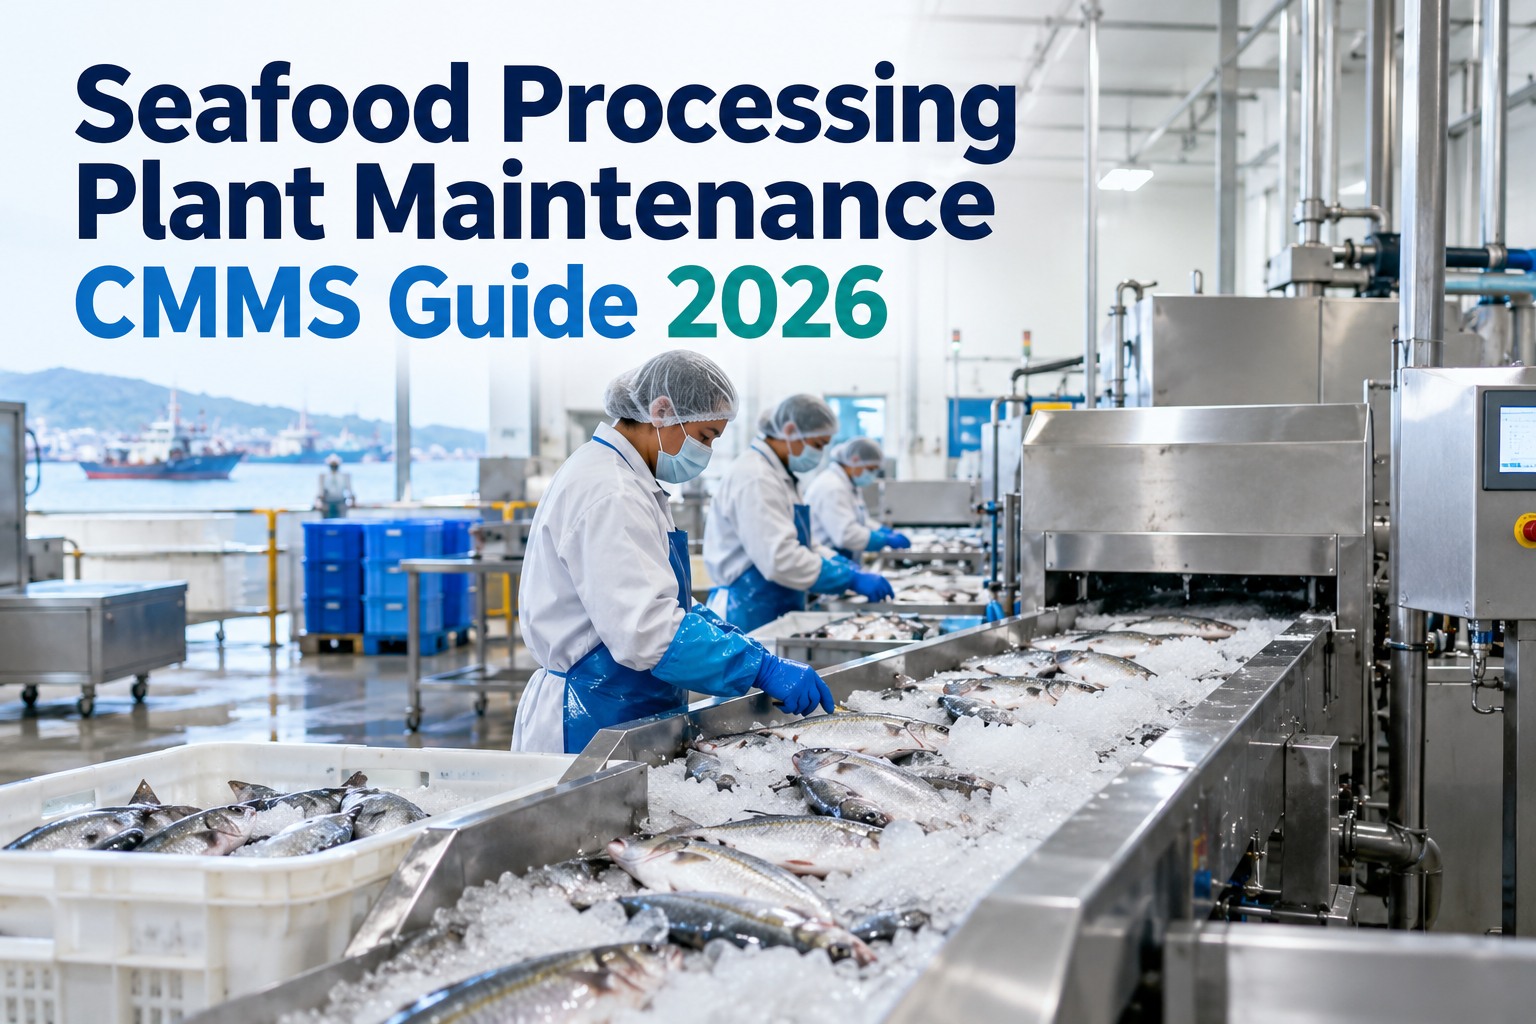
A food plant running at 60% OEE loses roughly 9.6 hours of every 24, and industry research consistently finds that 74% of that downtime is preventable — not with new capital equipment, but with a maintenance discipline that catches root causes instead of firefighting symptoms. The plants moving from 60% to 75% OEE do it with the same lines, the same crew, and the same shift pattern; they just stop letting unplanned failures set the daily agenda. A 31% reduction in unplanned downtime inside twelve months is not a stretch target for 2026, it is what happens when downtime events get logged with real root causes, and the same causes stop being tolerated event after event. See the uptime playbook applied to food manufacturing in OxMaint's production uptime module for food plants.
Food Plant Uptime · CMMS Strategy · 2026 Playbook
Uptime Is Not One Number. It Is Three Multiplied Together.
Every uptime problem in a food plant reduces to one equation. Fix any single factor without fixing the others and the plant's real uptime barely moves. Understand the multiplication, and the improvement path becomes obvious.
OEE
Availability × Performance × Quality
Availability
Scheduled time actually running
Biggest maintenance lever
Performance
Actual rate vs theoretical max
Micro-stops and speed loss
Quality
Good output vs total output
Rework, scrap, holds
Industry-average food plant sits at 60–65% OEE. World-class food plants operate at 85% or higher. The 20-point gap is where the money lives — and 74% of it is preventable in your existing operation.
$4K–$30K
per hour of unplanned downtime in food and beverage manufacturing, before hidden costs
74%
of food plant downtime is preventable with modern maintenance discipline and CMMS-driven tracking
31%
reduction in unplanned downtime achievable within 12 months of systematic root-cause tracking
4.8x
cost multiplier of reactive repair vs the same failure caught and scheduled beforehand
The Cost of One Hour Down — What Finance Sees vs What Actually Bleeds Out
Most food plants track downtime in one number: lost production value. That single number captures roughly a third of the real damage. The other two-thirds are still hitting the P&L — they are just showing up in labor overrun, scrap, expediting, and customer chargeback lines that never get traced back to the original failure event.
What the maintenance report shows
1 line item · Lost production value
$4,000 – $12,000 / hour
The rest of what actually happened, layer by layer
L1
Idle labor across the whole line
A 60-person line on payroll during a stoppage costs $1,200–$2,400 per hour in idle wages — irrespective of who is turning wrenches on the repair.
L2
Scrap and WIP inventory loss
Product in the line at failure moment — hot batter mid-mix, ice cream at the wrong temperature, filled containers not yet sealed — becomes scrap or downgrade.
L3
Emergency parts and overtime premiums
Expedited freight, weekend labor rates, and OEM emergency support calls stack on quickly. A rush shipment of a critical part can cost 3–8x the planned procurement price.
L4
Cleanup, sanitation redo, and CIP re-run
Any repair on food-contact equipment triggers a full sanitation cycle before restart. Add the chemistry, water, energy, and labor for the re-run — plus the delay it adds before the line can resume.
L5
Customer chargebacks and expedited shipping
Missed shipments trigger contractual penalties in retail and QSR contracts. Expedited freight to catch up compresses margin further, sometimes on multiple downstream shipments.
L6
Compliance risk and audit exposure
Any breakdown near a CCP raises the audit-finding probability at the next SQF, BRC, or FDA visit. That risk carries a real expected cost, even when the current incident closes clean.
Total real cost per hour of unplanned downtime
2–3× the maintenance report number
Stop tracking one number. Start tracking the whole event.
See Every Downtime Layer Attached to Every Stoppage — By Asset, By Cause, By Line
OxMaint captures the full cost stack against every unplanned event and rolls it up to the Pareto that shows where 80% of the downtime dollars are actually going. The improvement priorities become impossible to argue with.
Where Food Plant Downtime Actually Comes From
Aggregated data across food and beverage manufacturing shows a remarkably consistent breakdown. Equipment failure dominates, but two other categories together account for nearly a third of downtime hours — and every category on this map has a specific CMMS-enforceable countermeasure.
42%
Aging equipment failure
13%
Maintenance time gaps
14%
Utility & material supply
12%
Quality & CCP deviation
The 74% that is preventable
Aging equipment failure, operator error, and maintenance time gaps together account for 74% of food-plant downtime hours — and every one of those categories responds to CMMS-driven interventions with measurable, trackable payoff. The remaining 26% is a mix of supply-chain, utility, and CCP-driven deviation, which needs a different playbook but is a much smaller pool of hours.
The Five Levers That Actually Move Uptime
Every credible food-plant uptime program pulls these five levers together. Any one on its own delivers 5–10% improvement. All five together are how food plants get to a 31% reduction in unplanned downtime inside twelve months — with the same equipment, the same crew, and no capital project.
Lever 01
Log every stoppage against a structured root cause
No stoppage closes until failure mode, component, cause, and duration are captured. This turns the plant's downtime data from anecdote into Pareto. Half the improvement work is being able to see where the hours are going.
Impact · Baseline visibility in 30 days
Lever 02
Hit 90%+ PM compliance on the top failure-mode assets
PM compliance below 80% correlates with 2–3x higher unplanned downtime. Ninety percent compliance is not a soft target — it is the threshold at which unplanned events stop dominating the maintenance calendar.
Impact · 15–20% reduction in unplanned events
Lever 03
Shift planned-vs-reactive ratio above 80:20
Reactive maintenance costs 4.8x more per event than the same repair caught in a planned window. Every ten points of shift from reactive to planned translates directly into recovered maintenance labor and lower parts cost.
Impact · 25–30% reduction in maintenance spend
Lever 04
Cut MTTR through kitted parts and job-plan discipline
Half of MTTR on food-plant lines is spent looking for parts and instructions. Pre-kitted top-20 failure parts with job plans attached to the CMMS work order takes 40–60% of that time out of every event.
Impact · MTTR from 4 hrs to under 2 hrs on critical assets
Lever 05
Layer condition monitoring on the top 15 critical assets
Vibration, temperature, and amp-draw sensors on the assets driving the top 5 failure modes catch degradation 2–4 weeks before failure. Predictive alerts feed the CMMS, which turns them into planned work — not emergencies.
Impact · 2–4 weeks of warning window on critical failures
The Numbers to Beat — Food Plant Uptime Benchmarks
Reliability KPIs only matter when compared against the industry — and the difference between "we are doing okay" and "we are leaving millions on the floor" is one benchmark table away. The right column below is where the top-decile food plants live in 2026.
From 60% OEE to 75% is a 12-month program, not a decade project
Get the Uptime Benchmark Comparison Against Your Own Lines
A 30-minute demo maps your current OEE, PM compliance, and MTBF against the food-plant benchmarks above — and shows the specific work-order and PM configurations that move each number.
The 90-Day Uptime Recovery Plan
Uptime programs stall when they try to fix everything at once. Ninety days, three phases, with a specific measurable outcome at the end of each — this is the sequence food plants use to hit a 15% downtime reduction inside three months and stay on track for 31% by month twelve.
What gets done
Deploy CMMS with mobile work orders on the top 30 critical assets. Configure structured failure codes on every stoppage. Baseline OEE per line, MTBF per asset class, and PM compliance across the plant.
Outcome by day 30
Every downtime event is logged with structured cause. Pareto of failure modes is live. Expected impact: 15–20% downtime reduction from PM automation alone.
What gets done
Root cause analysis workflow on all top-Pareto failure modes. Spare-parts kitting for top 20 failure repairs. Job plans attached to critical work orders. PM compliance push to 90%+ on the top failure-mode assets.
Outcome by day 60
Recurring failures drop 30–40%. MTTR on critical assets cuts in half. Planned-to-reactive ratio moves from 55:45 toward 75:25.
What gets done
Condition-monitoring sensors on top 15 critical assets — vibration, temperature, amp draw. Predictive alert thresholds tuned. CMMS auto-generates work orders from sensor triggers. Operator autonomous-maintenance basics rolled out on the line.
Outcome by day 90
2–4 week warning window on critical failures. Unplanned downtime down 25–30% vs baseline. Program is on trajectory for 31% reduction by month 12.
The Morning Uptime Dashboard — What the Plant Manager Should See at 6 AM
A plant manager who has to ask three people to figure out how the night shift went is already behind by the time the first day-shift meeting starts. The dashboard below is the six-panel view that surfaces yesterday's uptime performance, today's risk, and the failure mode driving the current Pareto — from one screen on the phone or the desk.
Uptime Dashboard · Yesterday & Today
Auto-refreshed at 05:45 · Line-level detail one tap away
Plant OEE (yesterday)
72.4%
+1.8 pts vs 7-day avg
Unplanned downtime (yesterday)
4.1 hrs
Line 2 filler bearing — 2.4 hrs of it
Top failure mode this week
Seal / gasket
6 events · 14.2 hrs · $58K exposure
PM compliance (rolling 30d)
92.1%
Line 3 conveyor lube overdue 4 days
Predictive alerts open
3
1 critical · 2 monitoring · Line 1 pasteurizer
Today's PM plan compliance risk
Low
14 PMs scheduled · 3 techs on shift · all covered
What Comes Back in Twelve Months — The Real Payoff
Reference facility · mid-sized food processor · 4 lines · $6.5M annual maintenance spend · pre-CMMS baseline
Unplanned downtime
9.4%
6.5%
MTBF critical assets
960 h
1,780 h
MTTR critical assets
4.6 h
1.9 h
Planned : reactive ratio
48 : 52
82 : 18
Maintenance cost per unit
$0.048
$0.032
Annualized production value recovered
$4.8M – $7.2M
Direct maintenance spend recovered
$1.1M – $1.6M
Total 12-month payback
7 – 10× CMMS investment
Expert Perspective
"
The plants I have watched claw back double-digit uptime in twelve months all did the same thing first — they stopped closing downtime tickets without a root cause. That single discipline is worth more than any sensor a plant will buy. Once the Pareto is honest, the improvement path picks itself: which asset class drives the most hours, which failure mode drives the most events, which shift or line owns the concentration of both. From there the levers are well understood. What separates the plants that hit 31% reduction from the ones that stall at 8% is not the CMMS, and it is not the sensors. It is whether leadership treats downtime data with the same seriousness as financial data. That is the whole discipline.
James Okafor, CMRP, MBA
24 years in food and beverage operations · former VP of Reliability at a top-10 North American food manufacturer · specialism in OEE recovery programs and CMMS-enforced downtime root-cause tracking
Frequently Asked Questions
Q1
Is a 31% reduction in unplanned downtime realistic in twelve months for a food plant?
Yes, for a plant starting from industry-average performance and applying all five uptime levers. Plants already near world-class see smaller relative gains but still meaningful absolute recovery.
A short walkthrough maps a realistic trajectory against your own baseline.
Q2
What is the single biggest lever in a food plant uptime program?
Structured root-cause capture on every downtime event. Without it, every improvement effort is guesswork. With it, the Pareto tells the improvement team where the next 30% of unplanned hours are hiding — and every other lever gets sharper because the data underneath is clean.
Q3
How does the uptime program change for a food plant already at 78% OEE?
The last five to seven OEE points come from condition monitoring and predictive analytics on the top-Pareto failure modes, plus operator autonomous-maintenance rollout. The early wins (PM compliance, kitting, root-cause capture) are already done — the gains from here are smaller per intervention but stack cleanly.
Q4
Do we need capital investment in new equipment to hit these uptime numbers?
Rarely. The vast majority of the uptime recovery on a mid-tier food plant comes from better maintenance discipline on existing assets — the equipment is fine, the interventions were not landing at the right time.
Start a free trial to test the uptime module against your own asset registry.
Q5
How quickly does the ROI show up on a food plant uptime CMMS deployment?
Positive ROI typically lands inside 60–90 days for mid-sized food plants. A single avoided major unplanned incident often covers the annual CMMS cost several times over — everything after that is compounding recovery through the twelve-month program.
One CMMS · every stoppage tracked · the whole plant on the same uptime scoreboard
Turn 60% OEE Into 75% Without Buying a Single New Machine
The gap between industry-average and world-class food plants is not capital equipment. It is discipline, data, and a CMMS that catches every downtime event with the root cause captured cleanly. OxMaint is built for exactly the uptime recovery this playbook describes — 31% reduction in unplanned downtime inside twelve months, running the same lines, with the same crew.