A multinational beverage manufacturer operating 28 production facilities discovered they were losing €142 million annually to preventable operational inefficiencies—reactive maintenance consuming 73% of maintenance budgets, energy waste from poorly optimized equipment, packaging material overuse due to quality defects, and logistics costs inflated by uncoordinated production schedules. Traditional cost reduction efforts focused on procurement negotiations and headcount reductions delivered temporary savings that returned within quarters. After implementing systematic operational optimization across maintenance, energy, quality, and supply chain—supported by CMMS integration and real-time analytics—the company reduced total operating costs by 22% in 18 months while simultaneously improving OEE from 68% to 84%. The transformation required no major capital investment; it simply eliminated waste embedded in reactive processes that had become normalized over decades of operations.
FMCG manufacturers face relentless margin pressure—commodity input volatility, retailer consolidation driving price negotiations, labor cost inflation, and energy price spikes. Most companies respond through supply chain renegotiation and workforce optimization, extracting diminishing returns from already-lean procurement. However, the largest cost reduction opportunities hide inside production operations where reactive maintenance, unplanned downtime, energy inefficiency, quality defects, and material waste consume 30-40% more budget than necessary. These losses persist not from lack of awareness but from fragmented systems that obscure true costs and prevent coordinated action. Implementing structured operational management through integrated CMMS, predictive maintenance, energy monitoring, and quality analytics transforms hidden waste into measurable savings that compound year over year. Start a free trial to discover where operational waste hides in your FMCG facilities and eliminate it systematically.
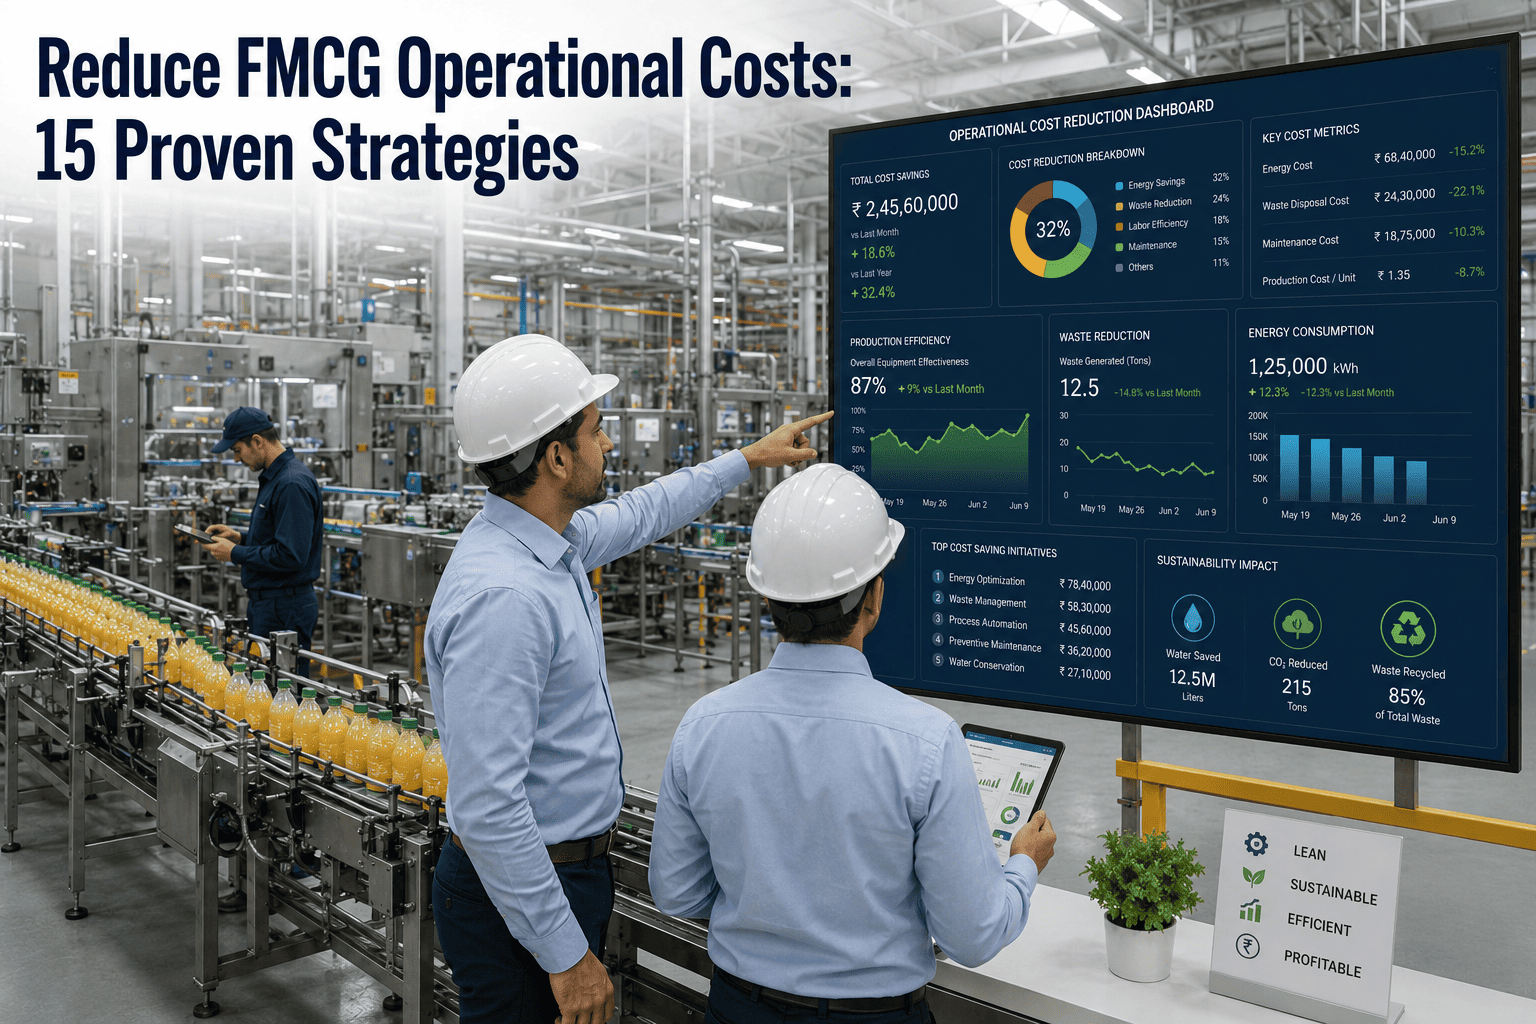
Reduce FMCG Operational Costs: 15 Proven Strategies
Systematic approaches to eliminate waste in maintenance, energy, quality, and supply chain through data-driven optimization and predictive management.
Understanding FMCG Cost Structure
FMCG manufacturing cost profiles follow predictable patterns that reveal optimization opportunities. Direct material costs typically represent 50-60% of production costs, with commodities and packaging driving majority of expense. Labor accounts for 15-20%, though actual burden including benefits and overhead often exceeds 25%. Energy consumption runs 8-12% in food processing, beverage, and personal care manufacturing where thermal processes, refrigeration, and compressed air systems operate continuously. Maintenance costs officially budget 4-6% of asset value annually, but emergency repairs, unplanned downtime, and deferred maintenance push true costs to 8-10% when production losses factor in. Quality defects, rework, and waste add another 3-5% that most facilities underestimate by excluding opportunity costs of lost production capacity.
The hidden multiplier effect makes operational waste more expensive than line-item costs suggest. A mixing pump failure costing €5,000 to repair emergency-style actually costs €38,000 when including lost production time valued at full margin, overtime labor premiums, expedited parts shipping, and downstream disruption to packaging lines awaiting product. Energy waste from a poorly tuned refrigeration compressor running continuously costs €12,000 annually in electricity plus €8,000 in premature equipment failure from excessive runtime—yet appears only as elevated utility bills without clear attribution. Quality defects requiring rework consume production capacity that could manufacture sellable product, effectively doubling ingredient costs while adding labor waste. Understanding these multiplier effects reveals why systematic operational optimization delivers 3-5× the savings of isolated cost reduction initiatives—addressing root causes eliminates cascading waste throughout operations. Book a demo to analyze your specific cost structure and identify highest-impact optimization opportunities.
15 Proven Cost Reduction Strategies
Systematic approaches proven across hundreds of FMCG facilities to reduce operational costs while improving production reliability and quality.
Preventive to Predictive Maintenance
Replace time-based PM schedules with condition-based interventions using vibration analysis, thermal imaging, and oil analysis. Reduce maintenance costs 25-35% by performing work only when needed.
Energy Consumption Monitoring
Install sub-metering on major energy consumers—compressors, chillers, process heating—to identify waste. Real-time monitoring reveals equipment inefficiency and schedule optimization opportunities worth 12-18% savings.
OEE Improvement Programs
Track availability, performance, and quality losses systematically using CMMS data. Address top loss categories sequentially to increase OEE from typical 65% to 80%+, adding production capacity equivalent to new lines.
Spare Parts Optimization
Eliminate obsolete inventory, standardize components across equipment, and implement min-max reorder automation. Reduce spare parts carrying costs 30-40% while improving availability of critical items.
Changeover Time Reduction
Apply SMED (Single Minute Exchange of Die) principles to packaging line changeovers, flavor switches, and format changes. Cut changeover time 40-60%, increasing production flexibility without capital investment.
Compressed Air Leak Elimination
Audit pneumatic systems using ultrasonic detection to find leaks consuming 20-30% of compressor output. Systematic leak repair reduces energy costs €15,000-€50,000 annually per facility.
Quality Defect Prevention
Implement real-time quality monitoring and SPC to catch process drift before defects occur. Reduce rework and waste 50-70% by preventing quality issues rather than detecting them downstream.
Production Scheduling Optimization
Use advanced planning algorithms to minimize changeovers, balance lines, and reduce work-in-process inventory. Improve throughput 8-12% from same equipment capacity through smarter sequencing.
Preventive Work Order Management
Digitize maintenance planning with CMMS to eliminate duplicate work, coordinate shutdowns efficiently, and track completion verification. Reduce maintenance labor costs 15-20% through coordination.
Asset Lifecycle Extension
Track asset condition systematically to optimize replacement timing—neither premature replacement nor run-to-failure. Extend average asset life 20-30% through proactive care, deferring capital expenditure.
Utility Demand Management
Shift non-critical loads to off-peak periods to reduce electricity demand charges. Stagger compressor and chiller startup to avoid demand spikes. Save 10-15% on utility bills through timing optimization.
Process Waste Reduction
Quantify and target startup waste, line purging losses, and packaging material overuse. Digital tracking reveals waste patterns enabling targeted reduction programs worth 5-8% of material costs.
Predictive Inventory Management
Use AI-driven demand forecasting to optimize raw material and finished goods inventory. Reduce carrying costs 25-35% while improving product freshness and reducing obsolescence write-offs.
Multi-Site Coordination
Share best practices, standardize procedures, and coordinate maintenance across facilities. Portfolio-level optimization identifies efficiency opportunities invisible at single-site level.
Real-Time Performance Analytics
Deploy dashboards showing energy, OEE, quality, and maintenance KPIs in real time. Immediate visibility enables rapid problem response before small issues become expensive failures.
Hidden Cost Categories in FMCG Operations
Most FMCG facilities underestimate operational costs by focusing only on direct expenses while overlooking multiplier effects and opportunity costs.
Emergency Maintenance Premium
Reactive repairs cost 4-8× planned maintenance due to overtime labor, expedited parts, production losses, and secondary damage from equipment failure. Hidden cost: €2M-€8M annually in mid-size facilities.
Unplanned Downtime Opportunity Cost
Lost production time valued at full margin typically exceeds repair costs 10:1. A €5,000 pump repair becomes €50,000 total loss when including lost production capacity. Hidden cost: €5M-€15M annually.
Energy Waste from Inefficiency
Equipment operating below efficiency design—fouled heat exchangers, worn pump impellers, poorly tuned burners—wastes 15-25% of energy consumption without obvious symptoms. Hidden cost: €1M-€4M annually.
Quality Defect Cascading Costs
Rework consumes production capacity, requires duplicate materials, and adds labor while displacing profitable production. True cost: ingredient cost + labor + lost opportunity. Hidden cost: €3M-€10M annually.
Excess Spare Parts Carrying Costs
Obsolete inventory, duplicate parts for similar equipment, and over-stocking critical items tie up €500K-€3M in working capital earning zero return while incurring storage and obsolescence risk.
Premature Asset Replacement
Replacing functional assets based on age rather than condition wastes capital. Conversely, running assets beyond economic life increases operating costs faster than depreciation savings. Hidden cost: €1M-€5M annually in mistimed replacements.
How CMMS Enables Systematic Cost Reduction
Modern computerized maintenance management systems transform cost reduction from periodic initiatives into continuous improvement embedded in daily operations.
Maintenance Cost Transparency
Track labor, parts, and downtime costs per asset, revealing which equipment consumes disproportionate maintenance budgets. Prioritize reliability improvements based on actual total cost of ownership data.
Preventive Work Optimization
Schedule preventive maintenance based on runtime, production cycles, or condition monitoring triggers rather than calendar intervals. Reduce unnecessary work while improving reliability through precision timing.
Spare Parts Inventory Control
Automate reorder points based on actual consumption patterns and lead times. Eliminate stockouts of critical items while reducing excess inventory of rarely-used parts through data-driven optimization.
OEE Loss Categorization
Automatically calculate availability, performance, and quality losses from production and maintenance data. Target improvement efforts at highest-impact loss categories using Pareto analysis.
Energy Monitoring Integration
Connect utility meters, sub-meters, and equipment sensors to track energy consumption per production unit. Identify energy waste patterns and verify savings from efficiency improvements.
Multi-Site Benchmarking
Compare maintenance costs, energy efficiency, and OEE across facilities to identify best practices and underperformers. Portfolio visibility reveals opportunities invisible at single-site level.
Reactive Operations vs Optimized Operations
Systematic operational management transforms cost structures by eliminating waste at the source rather than managing symptoms.
| Operational Aspect | Reactive Approach | Optimized Approach |
|---|---|---|
| Maintenance Strategy | Fix equipment when it breaks | Prevent failures through condition-based PM |
| Maintenance Cost | Emergency premium: 4-8× planned cost | Planned work at standard rates |
| Downtime Pattern | Unpredictable failures during production | Scheduled maintenance during planned shutdowns |
| Energy Management | Pay utility bills without analysis | Monitor consumption, optimize timing, eliminate waste |
| Spare Parts | Emergency orders, excess inventory, stockouts | Optimized inventory with automated reordering |
| Quality Approach | Inspect finished product, rework defects | Real-time process monitoring prevents defects |
| Asset Replacement | Replace on failure or arbitrary age | Optimize timing based on condition and economics |
| Production Efficiency | OEE 60-70%, accept losses as normal | OEE 80-85%, systematically eliminate losses |
The cost differential between reactive and optimized operations typically ranges 18-28% of total manufacturing costs in FMCG facilities. A plant with €50M annual operating costs running reactively wastes €9M-€14M compared to optimized operations—savings that compound annually and require minimal capital investment to capture. The transformation requires systematic implementation of proven practices through integrated CMMS, real-time monitoring, and data-driven decision making rather than heroic individual efforts or periodic cost reduction campaigns. Start a free trial to benchmark your current operations against optimized standards and quantify savings opportunities, or book a demo to develop a phased cost reduction roadmap specific to your facilities.
Documented Cost Reduction Results
FMCG manufacturers implementing systematic operational optimization report substantial and sustained cost reductions across maintenance, energy, quality, and productivity.
28-facility beverage manufacturer eliminated operational waste through integrated CMMS, predictive maintenance, and energy monitoring over 18 months.
Shift from reactive to predictive maintenance reduced total maintenance spending while simultaneously improving equipment reliability and uptime.
Sub-metering, compressed air leak elimination, and equipment efficiency optimization reduced facility energy costs without production impact.
Systematic availability, performance, and quality loss reduction increased OEE from 68% to 84%, adding production capacity equivalent to three new lines.
Real-time process monitoring and SPC implementation caught process drift before defects occurred, reducing rework and waste dramatically.
Inventory rationalization, standardization, and automated reordering reduced working capital tied up in spare parts while improving critical item availability.
Frequently Asked Questions
How quickly can FMCG facilities see cost reduction results?
Quick wins typically appear in 60-90 days from compressed air leak repairs, preventive work scheduling optimization, and obvious spare parts inventory rationalization. Substantial savings—15-25% operational cost reduction—require 12-18 months for full implementation of predictive maintenance, energy monitoring, quality systems, and multi-site coordination. Benefits compound over time as reliability improvements reduce cascading failures and data-driven optimization identifies opportunities invisible in reactive operations. Start a free trial to identify quick-win opportunities in your facilities.
What capital investment is required for operational cost reduction?
Most cost reduction comes from process optimization rather than capital spending. CMMS implementation, energy monitoring software, and basic condition monitoring equipment (vibration analyzers, thermal cameras, ultrasonic leak detectors) typically cost €50K-€200K per facility—investment that pays back in 6-12 months from maintenance and energy savings alone. Major equipment upgrades for energy efficiency make sense only after optimizing existing asset operation, as poorly maintained new equipment quickly degrades to inefficient operation.
How do multi-site FMCG companies coordinate cost reduction across facilities?
Centralized CMMS with portfolio-level visibility enables benchmarking, best practice sharing, and coordinated initiatives across facilities. Establish standard KPIs—maintenance cost per production unit, energy per ton, OEE by line type—to identify underperforming sites. Create centers of excellence at best-performing facilities, then replicate proven practices systematically. Coordinate spare parts standardization and bulk purchasing across sites to reduce total inventory while improving availability. Book a demo to see portfolio-level cost optimization for multi-site operations.
Can cost reduction and reliability improvement happen simultaneously?
Yes—proper operational optimization increases both cost efficiency and reliability simultaneously by eliminating root causes rather than managing symptoms. Predictive maintenance costs less than reactive repairs while delivering better uptime. Energy efficiency improvements reduce utility costs while extending equipment life through reduced thermal stress. Quality process monitoring prevents defects more economically than downstream inspection and rework. The apparent tradeoff between cost and reliability exists only in reactive operations; systematic optimization improves both simultaneously by working smarter rather than accepting suboptimal performance as inevitable.
Stop Losing Millions to Preventable Operational Waste
Turn reactive operations into optimized systems that eliminate hidden costs while improving reliability, quality, and productivity.