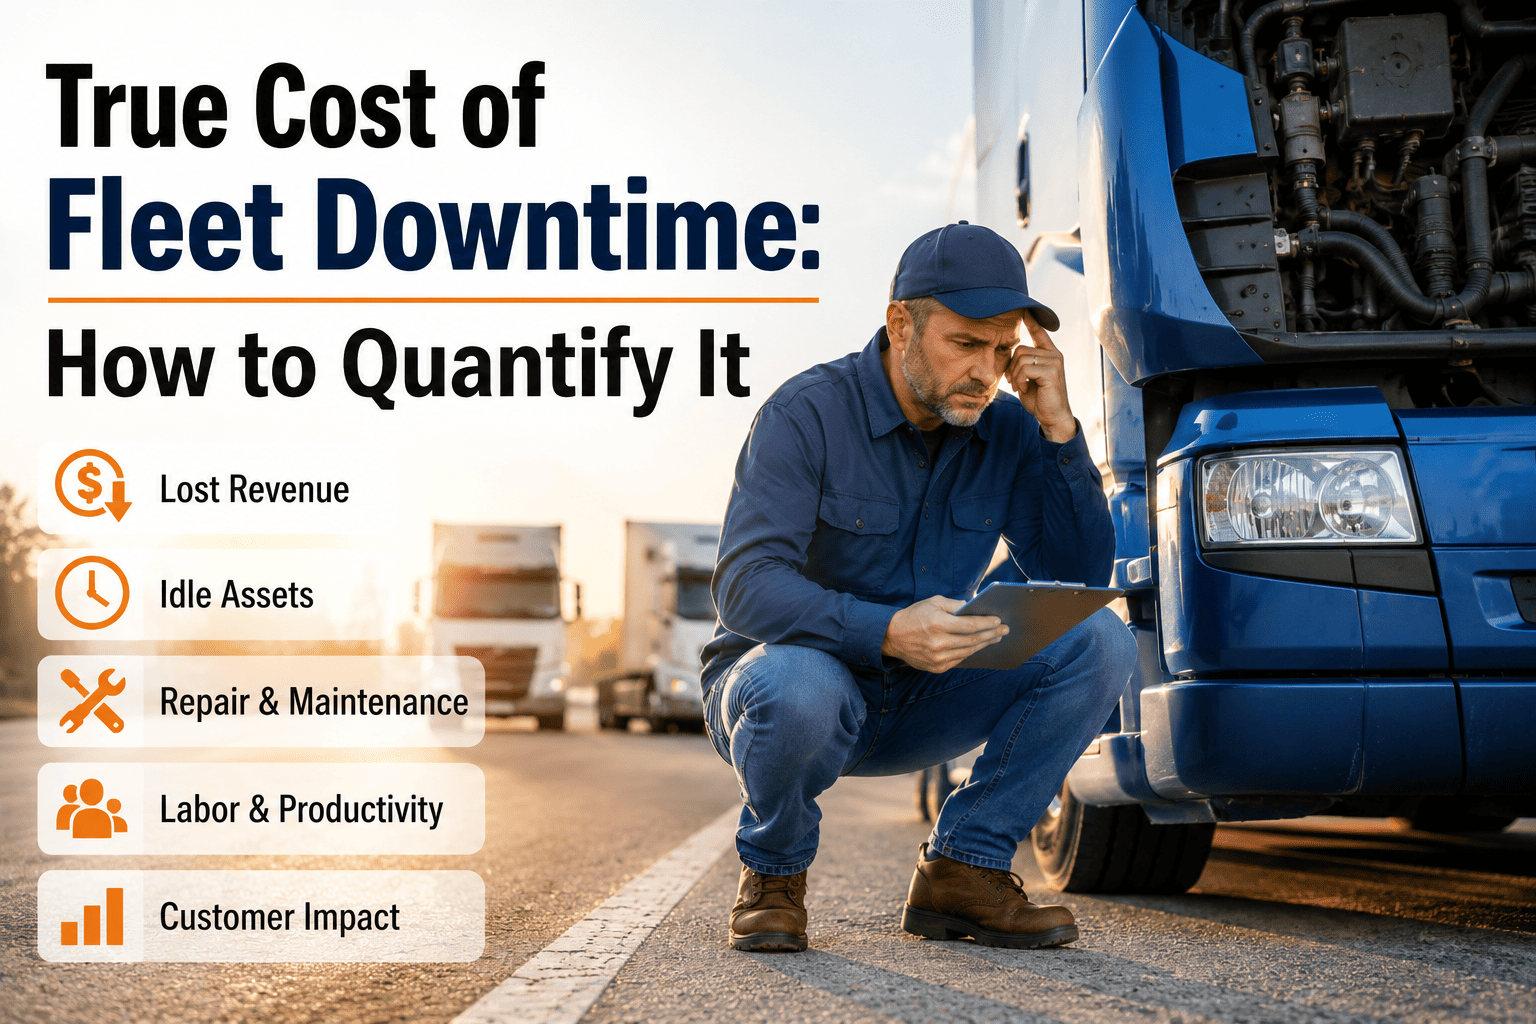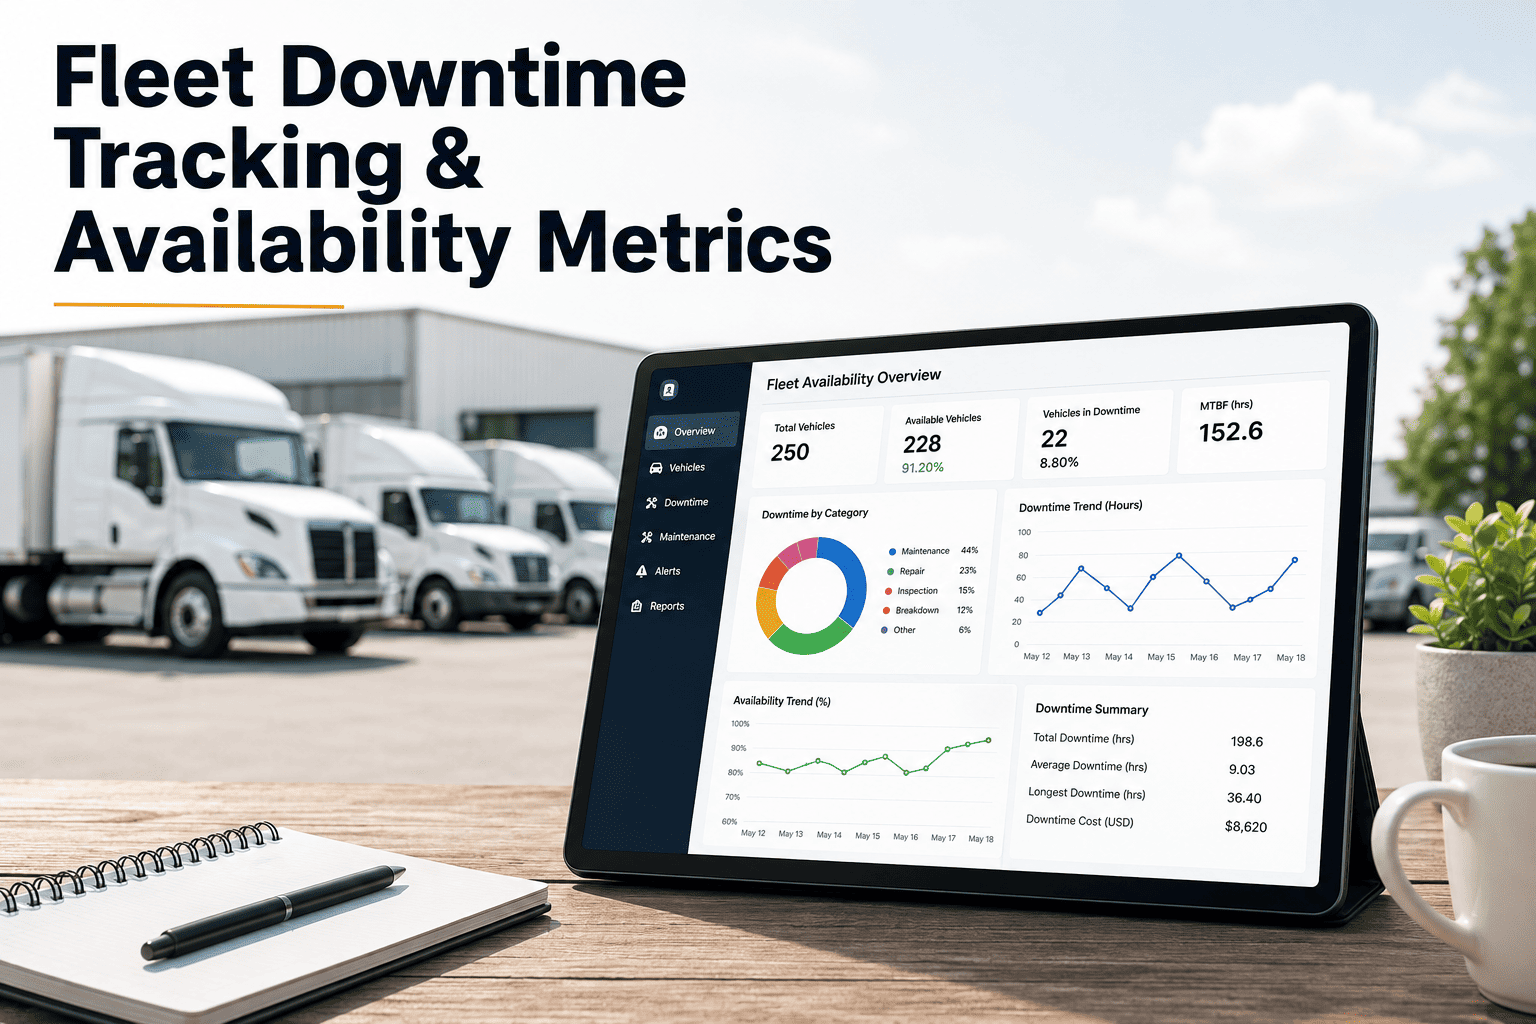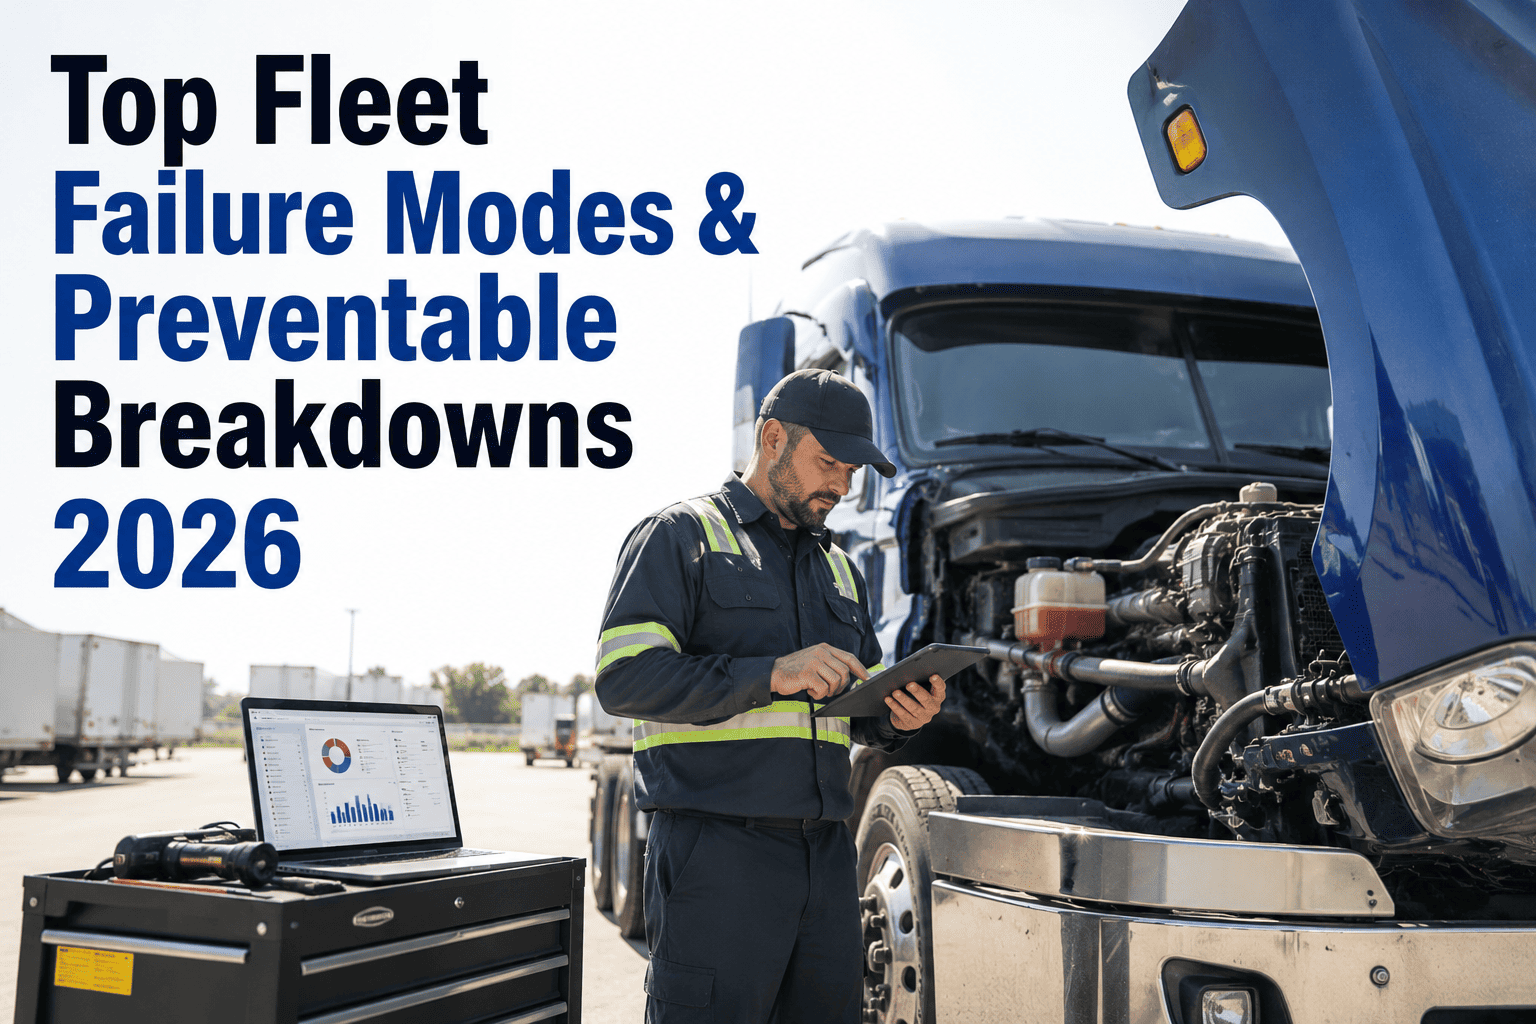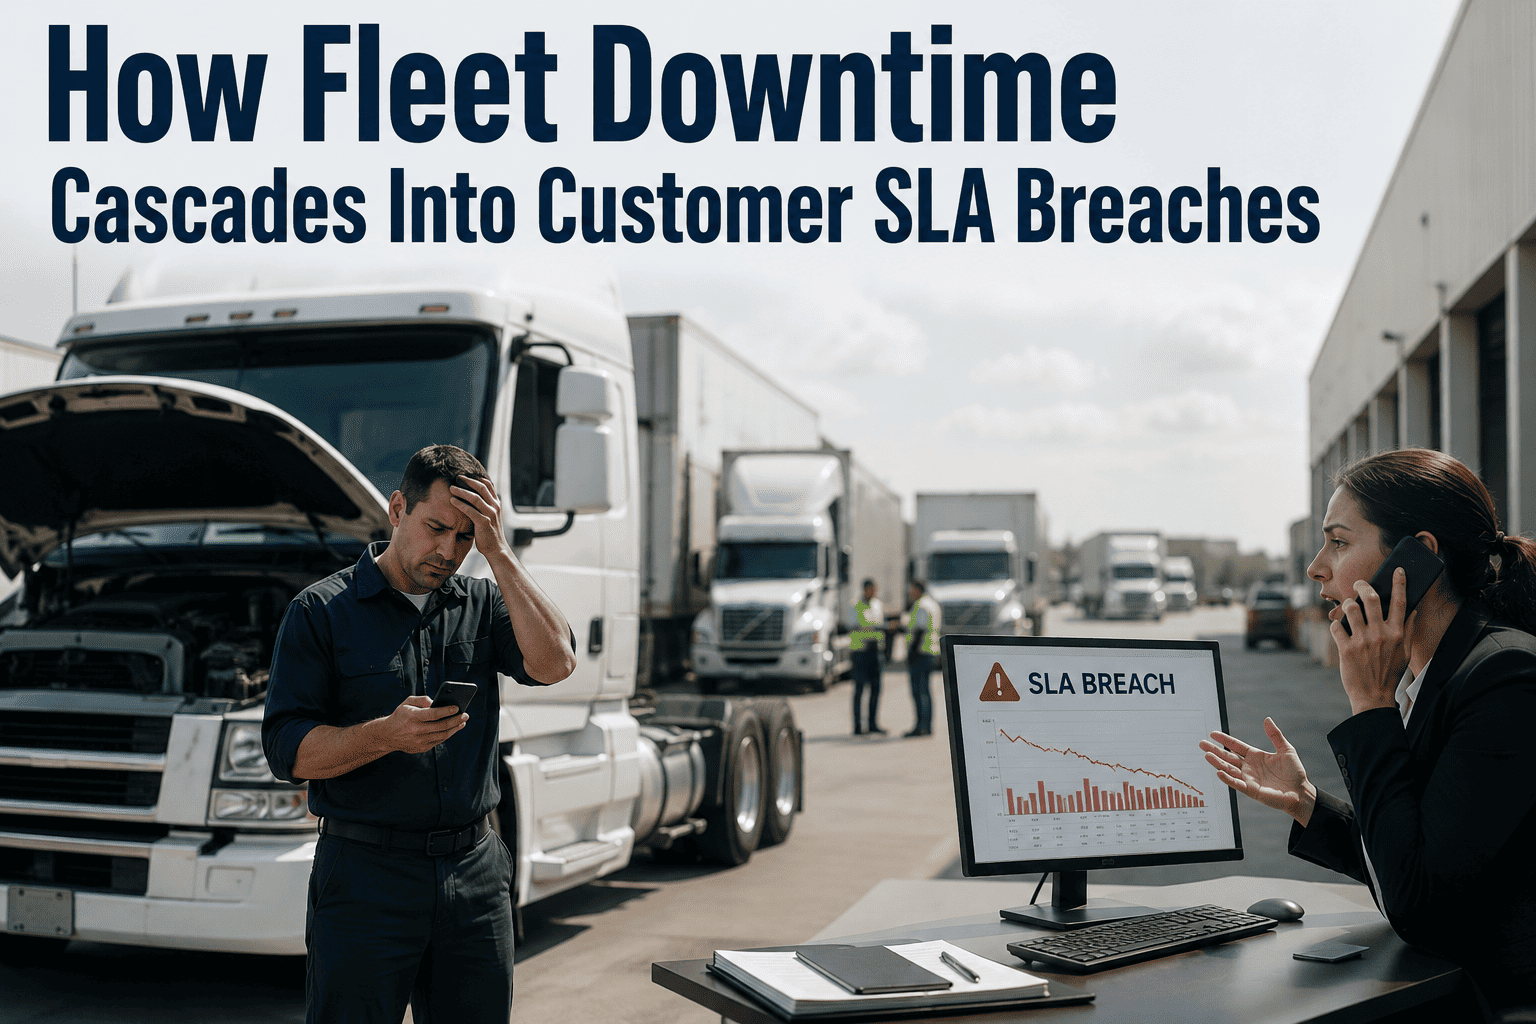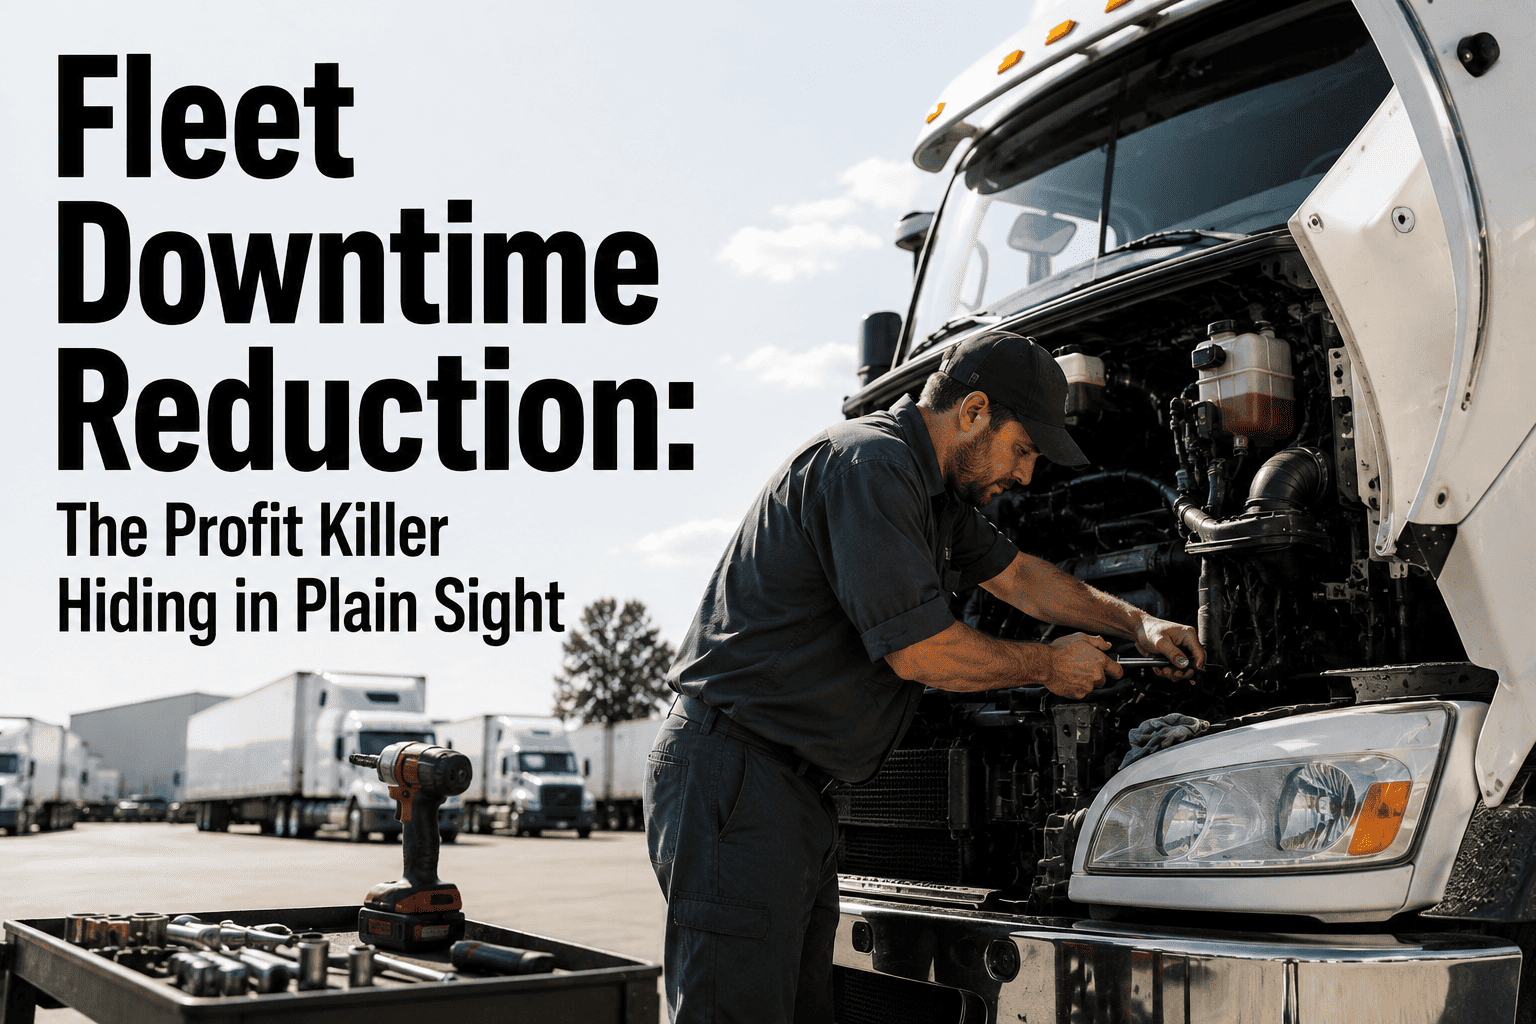
Not all downtime is created equal — and treating every stoppage the same way is the fastest path to wasted maintenance spend. In any modern fleet, preventable downtime (failures you could have avoided through better PM scheduling, inspections, or early intervention) must be cleanly separated from unpreventable failures (catastrophic events, external collisions, and force-majeure incidents outside your control). Downtime categorization is the foundational step for any reliability program, because you cannot reduce what you have not classified. By applying a rigorous fleet downtime classification framework, maintenance teams typically discover that 40–60% of their downtime hours were actually avoidable. Ready to stop losing revenue to fixable failures? You can Start Free Trial of OxMaint and see exactly where your preventable hours are hiding.
How much of your fleet downtime was actually preventable?
Most fleets lump every stoppage into one bucket — and miss the 40–60% of downtime hours that better PM scheduling and early fault detection could have eliminated. Classifying every event into preventable vs. unpreventable is the first step to cutting costs and boosting uptime.
What is preventable vs. unpreventable fleet downtime?
Fleet downtime classification splits every non-operational hour into two root-cause families. Preventable downtime covers failures where a maintenance action — a scheduled PM, a inspection catch, a predictive alert — could have plausibly avoided the breakdown. Unpreventable downtime covers events outside the maintenance function's control. The distinction matters because it tells you exactly where to invest labor and budget for maximum uptime ROI.
| Preventable Downtime | Unpreventable Downtime |
|---|---|
| Missed or overdue preventive maintenance intervals | Catastrophic road accidents and collisions |
| Worn brakes, tires, belts, hoses not caught by inspection | Severe weather, flooding, or natural disasters |
| Lubrication failure due to missed grease points | Vandalism, theft, or third-party infrastructure damage |
| Battery / alternator failure from ignored fault codes | Recalls and manufacturer-defect sudden failures (pre-notice) |
| Spare-parts stockout on a known wear item | Driver-caused accidents unrelated to mechanical condition |
A 5-step framework for classifying fleet downtime
A defensible downtime category guide follows a repeatable investigation process. Teams that standardize this workflow see audit-ready records and can prove their preventable rate to ownership and insurers within 60 days.
Log every stoppage with a root-cause code
Capture the asset, timestamp, failure mode, and technician notes in a central CMMS within 24 hours. Standard codes eliminate fuzzy categories like "miscellaneous."
Check the PM compliance record
If the asset had an overdue PM, missed inspection, or lapsed service interval, the failure is almost always preventable. Flag it immediately.
Review fault-code history and alerts
If a telematics or condition-monitoring alert fired days or weeks before the failure and no action was taken, reclassify the event from unpreventable to preventable.
Apply the "reasonable maintenance" test
Ask: could a competent technician following the OEM service schedule have detected or delayed this failure? If yes — preventable. If no — unpreventable.
Trend the preventable rate monthly
Report the percentage of downtime hours classified as preventable to leadership every month. A falling rate proves your PM and predictive programs are working.
The cost of preventable downtime: a worked example
A 180-asset fleet averaging 14 downtime hours per asset per month at $185/hour (lost revenue + tow + labor) is bleeding $467,400 per year. If 50% is preventable — the industry norm for fleets still running on spreadsheets — that is $233,700 in recoverable margin.
How OxMaint automates downtime categorization for fleets
Manual classification in spreadsheets is slow, inconsistent, and rarely audit-ready. OxMaint's AI-powered CMMS automatically tags every work order and downtime event, surfaces PM-compliance gaps, and gives you a real-time preventable-rate dashboard.
Auto-tagged downtime events
Every work order inherits asset history, fault codes, and PM status — so OxMaint can suggest a preventable or unpreventable classification the moment the ticket closes.
PM compliance tracking
See exactly which assets have overdue or missed preventive maintenance — the #1 driver of preventable downtime — and auto-trigger work orders before intervals lapse.
Preventable-rate analytics
Live dashboards break downtime hours by category, asset class, and root cause — giving you the defensible numbers leadership and insurers expect.
Predictive fault alerts
OxMaint's AI models analyze telematics and inspection data to flag developing failures 7–21 days in advance — converting tomorrow's unpreventable breakdown into today's scheduled fix.
Stop guessing where your downtime comes from
See OxMaint classify your last 90 days of downtime events in a live 30-minute walkthrough — and discover your true preventable rate.
Frequently asked questions about fleet downtime classification
What is the difference between preventable and unpreventable downtime?
Preventable downtime is any stoppage a reasonable maintenance action — a PM, inspection, or predictive alert — could have avoided. Unpreventable downtime stems from events outside maintenance control, like accidents, severe weather, or sudden manufacturer defects. Classifying both correctly is what separates a disciplined reliability program from a reactive one.
What percentage of fleet downtime is preventable?
Industry studies and OxMaint benchmark data consistently show 40–60% of fleet downtime hours are preventable. Fleets without a CMMS or formal PM schedule sit at the high end of that range. You can measure your own rate by Start Free Trial of OxMaint and reviewing the auto-categorized downtime report.
How do you categorize downtime events in a CMMS?
Every work order or stoppage is tagged with a root-cause code, asset ID, and timestamp. The CMMS cross-references PM compliance, fault-code history, and inspection records to suggest whether the event was preventable. A technician or reliability engineer confirms the classification, creating an audit-ready trail.
Why does downtime classification matter for fleet ROI?
Because you can only reduce what you measure. If 50% of your downtime is preventable and you don't know it, you keep spending on reactive tows and emergency labor instead of cheaper scheduled PMs. Classification tells you exactly where each maintenance dollar delivers the highest uptime return.
How quickly can a fleet implement downtime categorization with OxMaint?
Most fleets are live in OxMaint within 2–4 weeks. Asset records, PM schedules, and telematics feeds can be imported during onboarding, and the AI begins auto-suggesting downtime classifications from day one. Book a 30-minute demo to see a tailored rollout plan for your operation.
Turn preventable downtime into preventable profit
Join the fleets using OxMaint to classify, predict, and eliminate avoidable failures — and recover the margin you've been leaving on the shop floor.
Free 14-day trial · No credit card