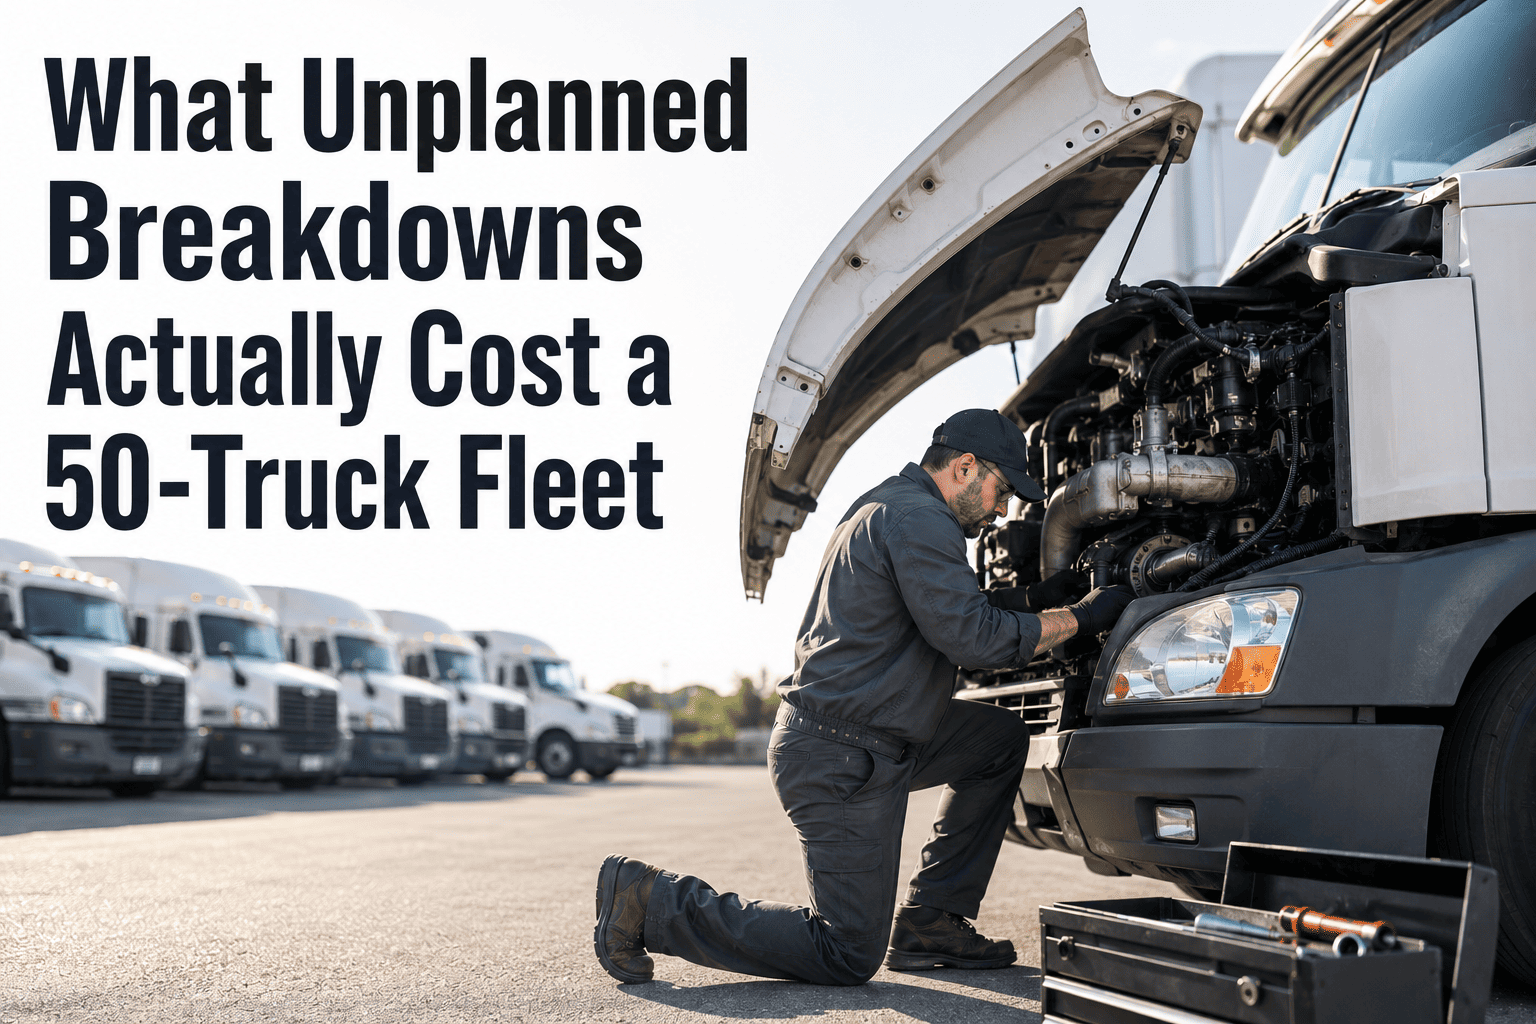
Unplanned breakdowns remain the number one profit killer in trucking, and most fleets don't see the true cost until the invoice arrives. A single roadside failure runs $450 to $1,900 once towing, lost productivity, and driver downtime are added up, and research across fleet maintenance programs shows nearly 8 in 10 of those breakdowns were preventable with the right service schedule. Multiply that across even a modest fleet and downtime stops looking like an occasional nuisance — it becomes a structural drain on margin that shows up every single quarter. Most operations are still running on a reactive model, discovering a failing part only after the vehicle has already stopped moving on a route. OxMaint flips that model by turning routine maintenance data into an early warning system. Start a free trial to see how much recoverable uptime is sitting inside your own fleet data.
Downtime Reduction · Fleet Strategy · 2026
The Hours Your Trucks Sit Idle Are Costing You More Than the Repair Bill
Every fleet tracks repair costs. Almost none track the revenue, wages, and customer commitments lost while a vehicle sits at the gate waiting on a part. Industry-wide, unplanned downtime drains an estimated $50 billion a year from fleet and industrial operations combined, and most of that spend traces back to a maintenance schedule that reacted instead of predicted. OxMaint closes that gap with one system that catches wear before it becomes a breakdown, so the next idle day is one you planned for instead of one that ambushed you.
The Real Number
What an Idle Truck Actually Costs Per Day
These are not projections from a vendor deck — they are the numbers fleet maintenance researchers keep landing on year after year. Read them together and a pattern shows up fast: the fleets losing the most money are the ones with the least visibility into their own vehicles.
$448–$760
Lost per vehicle, per day of unplanned downtime
78%
Of breakdowns trace back to a missed or delayed service
8.7 Days
Average unplanned downtime per vehicle, per year
3–9x
What a reactive repair costs versus the same job done on schedule
$50 Billion
Estimated annual cost of unplanned downtime across industries
40–55%
Share of maintenance that stays reactive without a digital system
Two Paths, One Truck
The Anatomy of a Breakdown, Reactive vs Planned
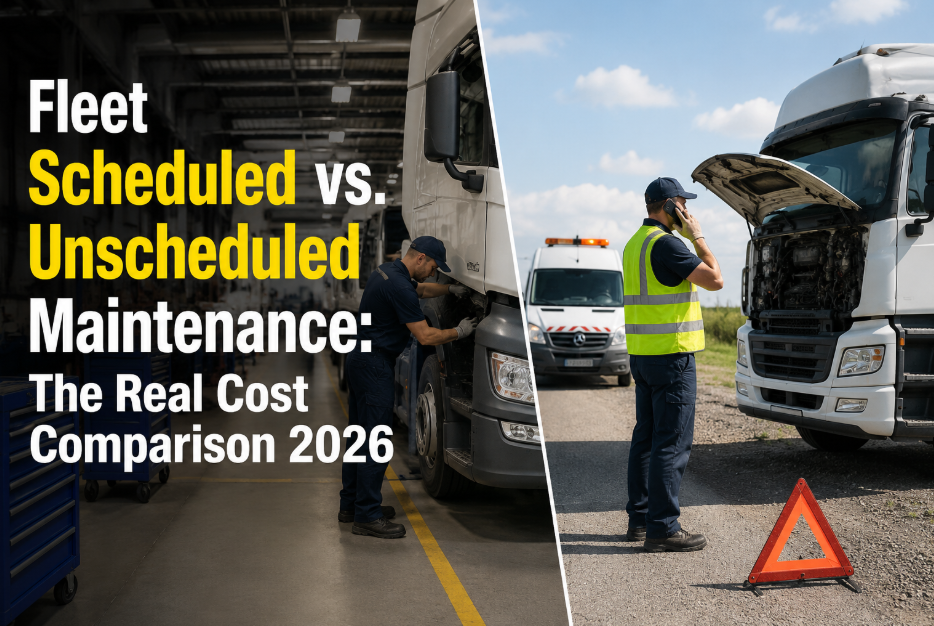
Take the exact same worn component on the exact same truck and run it down two different paths. One ends with a tow bill and a missed delivery window. The other ends with a technician closing a work order before the driver even notices anything changed. The part is identical — only the outcome changes.
Reactive Path
01Vehicle fails mid-route, driver pulls over
02Tow dispatched, truck absorbs premium labor rates
03Shop waits on parts that were never pre-ordered
04Vehicle returns to service two to three days later
05Customer commitment missed, driver hours wasted on standby
Planned Path
01Wear pattern flagged during a routine inspection
02Work order generated, parts staged in advance
03Repair scheduled into an already-planned bay slot
04Vehicle stays on route, service happens overnight
05Route and delivery schedule stay untouched
OxMaint Uptime Engine
OxMaint tracks every DVIR, PM interval, and parts request in one place, so a failing component gets caught during a scheduled inspection instead of on the side of a highway. Work orders build themselves from real inspection data, not from memory or a spreadsheet someone forgot to update.
Where It Hides
Six Places Downtime Builds Up Before Anyone Notices
None of these six causes show up as a single dramatic failure. Each one is small and easy to excuse in the moment — a rushed inspection here, a delayed part order there — and that is exactly why they add up to the biggest line item on a maintenance budget.
Skipped or Rushed DVIRs
A pre-trip inspection done in ninety seconds misses the same defects every time, and those defects are the ones that fail on the road.
PM Intervals Slipping
Fleets without a digital system routinely run at 40 to 55% reactive maintenance, more than double the rate of fleets on a structured schedule.
Parts Ordered After the Fact
Waiting to order a part until the vehicle is already in the bay adds days to every repair that a five-minute forecast could have prevented.
No Early Warning Signal
Without telematics or inspection data feeding a maintenance system, wear only becomes visible the moment it turns into failure.
Aging Vehicles Absorbing Spend
Vehicles over ten years old carry a service cost per mile roughly five times higher than vehicles under five years old.
No MTTR or MTBF Tracking
Fleets that don't measure repair time or time between failures can't tell which vehicles are quietly becoming a liability.
Individually, each of these looks like a minor process gap. Together, they are the reason two fleets running the same trucks on the same routes can post completely different downtime numbers by the end of the year.
Do the Math
What Fixing This Is Actually Worth
Downtime cost is not abstract — it is a formula every fleet manager can run against their own numbers, and the answer usually justifies the fix on its own. Daily idle cost should include lost revenue, driver wages paid while a vehicle sits, any rental or substitute equipment, and the customer impact of a missed delivery window, not just the repair invoice.
Number of Vehicles × Average Downtime Days Per Vehicle × Daily Cost of an Idle Vehicle = Annual Downtime Cost
A 50-Vehicle Fleet Example
Average unplanned days per vehicle, per year8.7
Daily cost of an idle vehicle$600
Estimated annual downtime cost$261,000
A 150-Vehicle Fleet Example
Average unplanned days per vehicle, per year8.7
Daily cost of an idle vehicle$700
Estimated annual downtime cost$913,500
Even a partial reduction in unplanned downtime days changes these totals meaningfully, since every recovered day removes its full daily cost from the annual figure rather than a fraction of it.
Side by Side
A Reactive Fleet Compared to a Planned One
Same trucks, same routes, same drivers — the only variable in this comparison is whether maintenance happens on a schedule or in response to a failure. The gap between the two columns is what a planning shift is actually worth.
Common Questions
Fleet Downtime — What Managers Ask Before They Fix It
How do I calculate what downtime is actually costing my fleet?+
Multiply vehicle count by average downtime days per vehicle by daily idle cost, counting lost revenue, wages, and any rental costs, not just the repair bill.
Start a free trial and OxMaint tracks this automatically per vehicle.
Is most downtime really preventable, or is some of it unavoidable?+
Industry research puts roughly 78% of breakdowns as preventable with proper inspection and PM scheduling, leaving only a small share as genuinely unavoidable. The gap comes almost entirely from catching wear during a scheduled check instead of after it fails on the road.
How fast can a fleet move from reactive to planned maintenance?+
Most fleets generate their first automated PM work orders within about a week of setup, with breakdown rates improving over the following months as inspection data builds up and thresholds get tuned to the fleet.
Do older vehicles need a different downtime strategy?+
Yes. Vehicles past ten years carry disproportionately higher service cost per mile, so they benefit most from tighter inspection intervals, earlier part replacement, and closer tracking of repair trends over time.
What does OxMaint actually do to reduce downtime?+
OxMaint centralizes DVIRs, PM schedules, and parts requests so wear gets flagged and scheduled before it turns into a roadside failure, with work orders and parts staging handled automatically.
Book a demo to see it on your fleet.
OxMaint · Downtime Reduction
Every Day of Downtime You Catch Early Is a Day You Don't Have to Explain to Customers.
OxMaint turns DVIRs, PM schedules, and parts data into one early-warning system, so breakdowns get caught during a routine inspection instead of on the side of a highway. The fleets that make this switch aren't the ones with fewer problems — they're the ones who see the problems first.






.png)