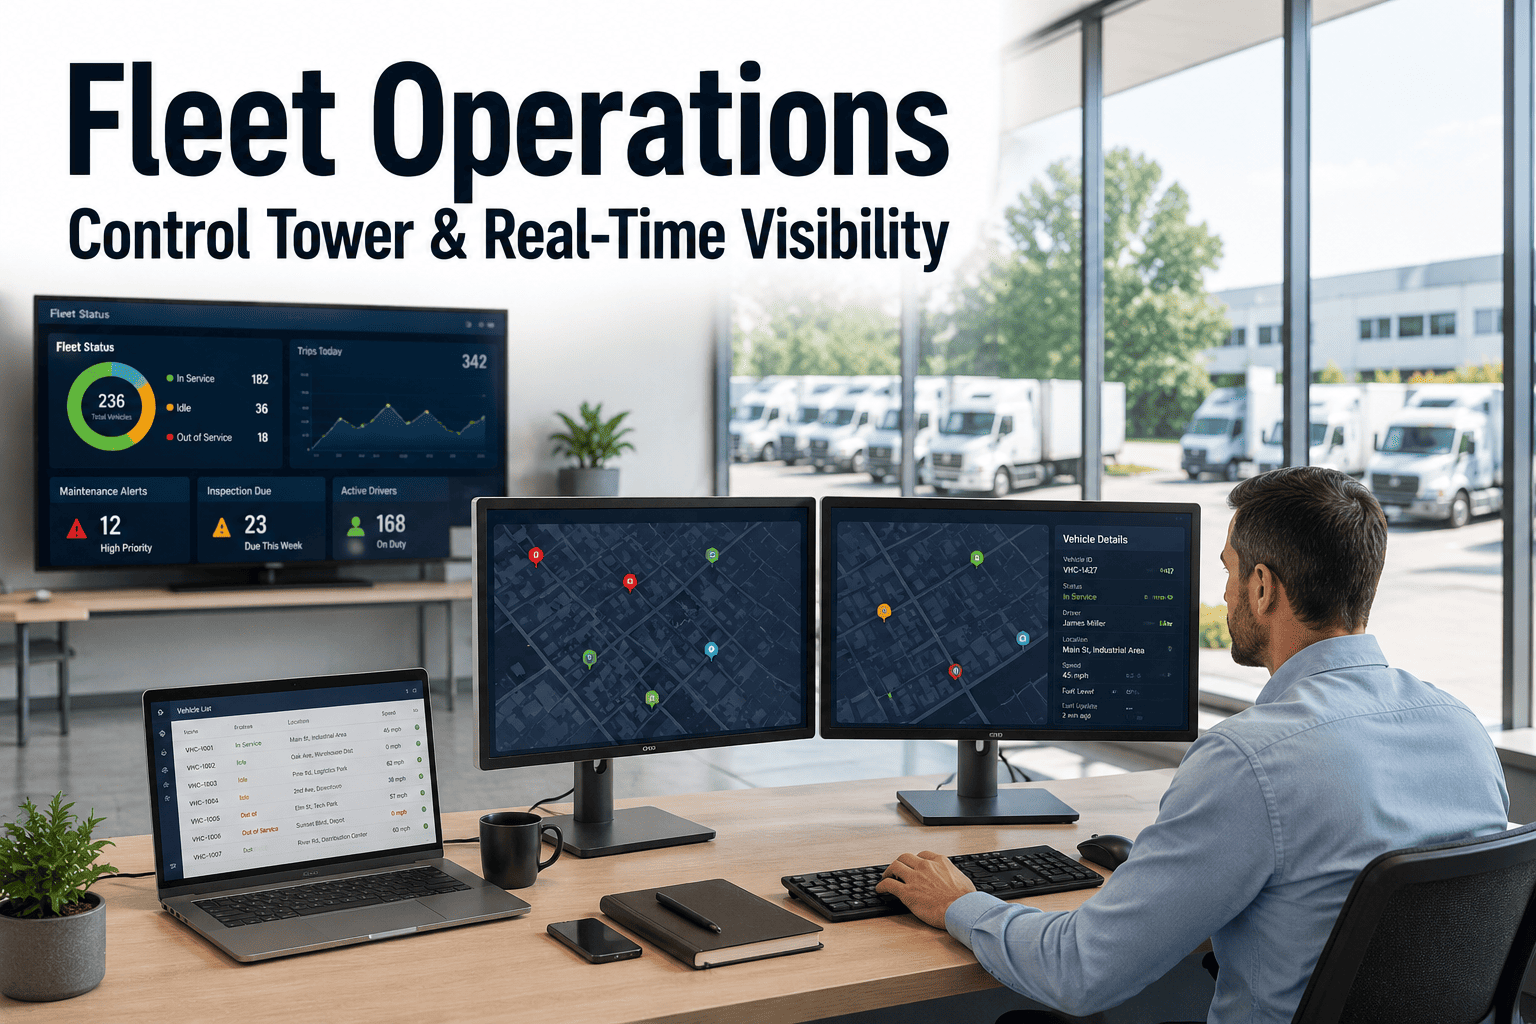
The fleet maintenance dashboard has been the operations center of fleet management for two decades — but a traditional dashboard only shows what already happened. Vehicle breakdowns that occurred yesterday. Work orders completed last week. PM compliance rates that tell you how well you maintained vehicles that may already have problems developing today. A static dashboard is a rearview mirror on a vehicle traveling at speed. In 2026, AI-enhanced fleet maintenance dashboards replace the rearview mirror with a 360-degree live intelligence display — showing not just what has happened, but what is happening right now inside every vehicle, what is predicted to happen in the next 2–8 weeks, and what specific actions are required today to prevent the failures that would otherwise appear as emergency line items on next month's report. A fleet manager operating OxMaint's AI dashboard on a Monday morning sees the same information that used to require: a maintenance coordinator's weekly report, three phone calls to remote depot managers, a manual PM schedule review, a parts inventory count, and a spreadsheet exercise to estimate next quarter's maintenance spend. All of it — in a single real-time view, updated continuously, with alerts already ranked by urgency and work orders already generated for every actionable item. This is not a better version of traditional fleet reporting. It is a different category of operational intelligence entirely. Sign up for OxMaint and deploy an AI-enhanced maintenance dashboard across your fleet today.
Fleet Technology · Guide · 2026
AI-Enhanced Fleet Maintenance Dashboard: Real-Time Monitoring and Alerts
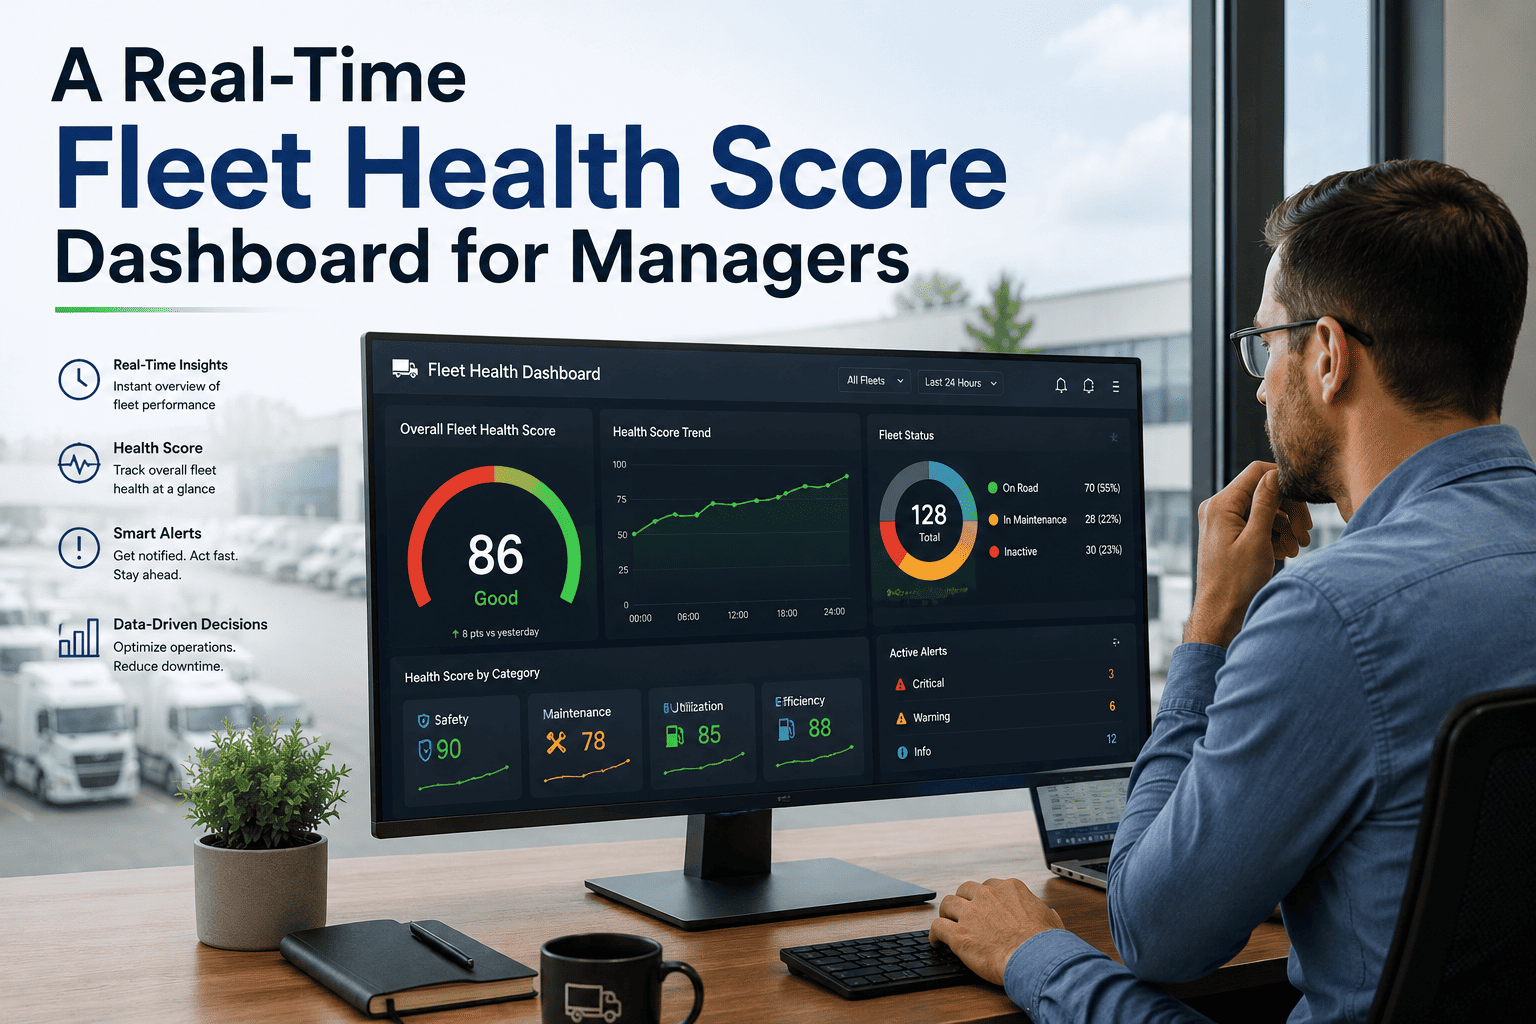
An AI-enhanced fleet maintenance dashboard converts your fleet's real-time telematics and maintenance data into a single operational intelligence view — live vehicle health scores, predictive failure alerts ranked by urgency, PM compliance status, parts availability, technician utilization, and CapEx forecasting updated continuously rather than in weekly reports.
Real-Time
Dashboard updates every 60–90 seconds from telematics — vs. weekly manual report cycles in traditional fleet management
93–97%
Fleet uptime achievable with AI-enhanced dashboard monitoring — vs. 82–88% with time-based PM and manual reporting
2–8 wks
Advance warning AI dashboard alerts provide before component failure — converting emergency spend to planned maintenance events
60%
Fewer emergency repairs in fleets running AI dashboard monitoring — documented across fleet implementations in 2025–2026
What an AI-Enhanced Dashboard Shows That Traditional Dashboards Cannot
Traditional fleet dashboards display historical and current-state data — vehicles on a map, work orders in the queue, PM compliance percentages, fuel spend by month. This data is useful for reviewing what happened. It has no capability to show what is developing right now inside vehicles, what failures are approaching, or what actions are needed today to prevent the emergency events that will appear on next month's report.
Traditional Fleet Dashboard
Vehicle status:Active / Inactive / In Shop — location only, no condition data
Maintenance view:Open work orders and scheduled PM — no developing failure visibility
Alert type:Active fault codes and driver-reported defects — after the symptom appears
Data freshness:Weekly or daily report — reflects past performance, not current state
Action required:Manager reviews report and manually decides what needs attention
CapEx intelligence:Annual exercise — mileage-based estimates assembled separately
OxMaint AI-Enhanced Dashboard
Vehicle status:Live condition score per vehicle — health, maintenance currency, and open defects in one metric
Maintenance view:Predictive alert queue with urgency ranking — flagged 2–8 weeks before failure, work orders auto-created
Alert type:AI-generated condition deviation alerts — surfaces developing failures before fault codes or symptoms
Data freshness:Updated every 60–90 seconds from telematics — current state of every vehicle at every moment
Action required:AI prioritizes and generates work orders — manager reviews exceptions, not full queue
CapEx intelligence:Continuous — condition score per vehicle feeds rolling 5–10 year CapEx forecast automatically
The 8 Dashboard Views in OxMaint's AI Fleet Maintenance Platform
OxMaint's AI-enhanced dashboard is not a single screen — it is eight interconnected operational views, each updating in real time from the same underlying data layer. Fleet managers see every view they need from a single platform rather than navigating between disconnected reporting tools.
Fleet Health Overview
All vehicles ranked by live condition score — a composite health metric updated continuously from telematics, recent work orders, open AI alerts, and inspection results. Condition score range (0–100) enables instant prioritization: low-score vehicles surface to the top of the dispatcher's attention, not buried in a list sorted by license plate number.
Key metric: per-vehicle condition score, updated in real time
Predictive Alert Queue
AI-generated maintenance alerts ranked by urgency and estimated failure window — showing vehicle, flagged system, AI confidence score, estimated days to required intervention, and auto-generated work order status. Managers see the 5 most urgent items every morning without reviewing the full fleet — AI filters, ranks, and escalates the items that require human decision-making.
Key metric: urgency-ranked predictive alert queue with auto-work-order status
PM Compliance Tracker
Preventive maintenance compliance rate per vehicle and fleet-wide — showing vehicles with upcoming PM in the next 7, 14, and 30 days alongside vehicles currently overdue. PM compliance is the leading indicator of emergency repair frequency: fleets maintaining 95%+ PM compliance experience 40–50% fewer unscheduled breakdowns than fleets at 75–80% compliance rates.
Key metric: PM compliance rate by vehicle, depot, and fleet-wide
Work Order Pipeline
Open work orders by status (Created / Parts Pending / Assigned / In Progress / Awaiting Approval / Closed), technician, vehicle, and urgency. Technician utilization rates visible across the shop — surfacing bottlenecks and capacity shortfalls before they delay the maintenance schedule. Average work order cycle time tracked per work order type and per technician.
Key metric: work order velocity, technician utilization, parts-pending delays
Parts Inventory Status
Current inventory levels for all tracked parts against minimum stock thresholds — with AI-projected demand for the next 30 days based on predictive alert queue and scheduled PM work orders. Parts shortfalls visible before they create work order delays. Automated reorder alerts triggered when stock drops below threshold — at fleet scale, preventing the emergency parts sourcing events that cost 15–30% above planned procurement rates.
Key metric: stock-vs-threshold status, AI-projected 30-day demand
Fuel and Efficiency Analytics
Per-vehicle and fleet-wide fuel efficiency tracked against route-normalized baselines — surfacing vehicles with AI-identified mechanical efficiency decline, high-idle vehicles, and routing inefficiencies. Fuel represents 30–40% of fleet operating costs. The dashboard view identifying the 10 highest-waste vehicles by AI efficiency analysis converts a fleet-wide problem into a specific 10-vehicle action list, generating measurable savings within the first operating week.
Key metric: route-normalized efficiency per vehicle, idle-time waste ranking
Maintenance Cost Analytics
Maintenance cost per mile per vehicle tracked over time — identifying high-cost vehicles approaching the economic end-of-life threshold, tracking the trend of planned vs. emergency repair spend ratio, and comparing cost performance across vehicle models and duty cycles. Cost-per-mile data per vehicle converts the abstract fleet budget into a per-vehicle economic conversation that supports replacement decisions and insurance negotiations.
Key metric: maintenance cost per mile, planned vs. emergency spend ratio
CapEx and Lifecycle Forecast
Vehicles ranked by replacement priority from AI condition scoring — showing accumulated component health scores, projected failure risk in 6, 12, and 24-month windows, and maintenance cost trajectory vs. replacement cost threshold. Rolling 5–10 year CapEx forecast updated from daily work order and health data — converting fleet replacement from an annual budget estimation exercise to a continuous condition-data-driven capital planning process.
Key metric: condition-ranked replacement priority, 5–10 year CapEx projection
6 Dashboard Intelligence Gaps That Cost Fleets Before AI
These are the specific visibility failures of traditional fleet dashboards — each one creating an operational blind spot that generates costs, delays, and decisions made without adequate data.
01
No Developing Failure Visibility
Traditional dashboards show active faults and completed maintenance. They have zero visibility into the vehicle whose cooling system is trending 8°F above baseline, whose bearing is generating an increasing vibration frequency, or whose battery internal resistance has increased 20% in 30 days. All three are visible in OxMaint's AI dashboard weeks before they generate any alert in a traditional system.
02
Alert Volume That Creates Fatigue
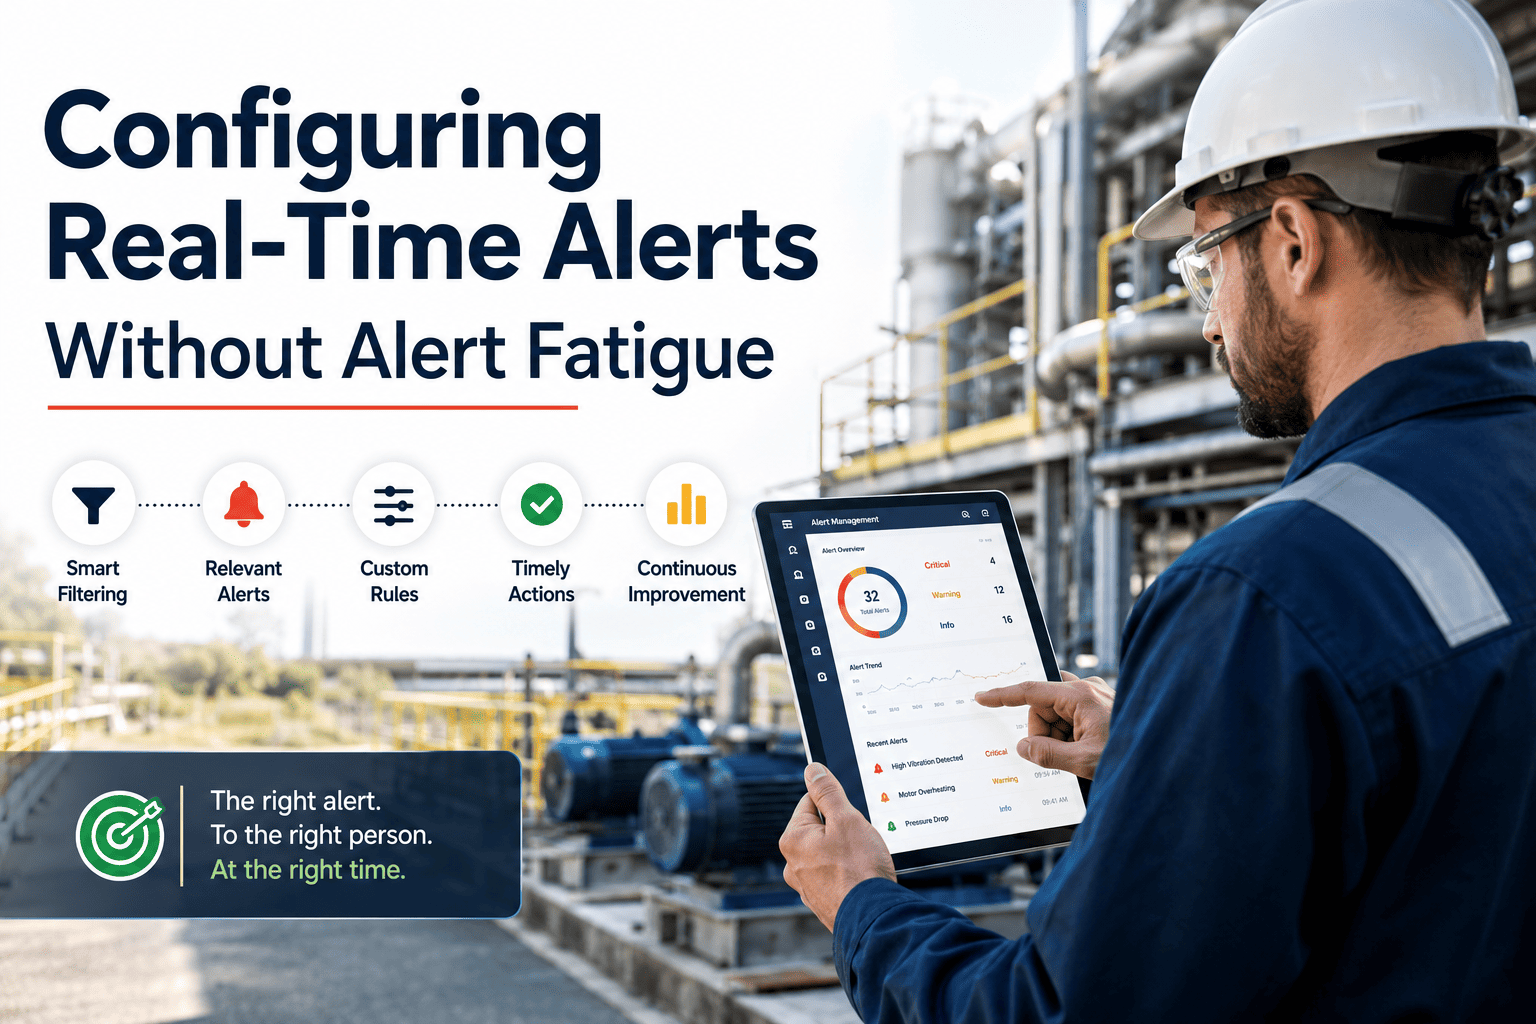
Traditional fleet software that connects telematics and generates threshold-based alerts produces 40–60 alerts per day in a medium-sized fleet — most of them low-priority noise. OxMaint's AI evaluates each alert against each vehicle's own behavioral baseline, reduces false positive rates by 60–70%, and presents only the alerts that require action — ranked by urgency. Alert fatigue is a system design problem, not a human attention problem.
03
Technician Capacity Invisible Until Overflow
Without real-time technician utilization data, maintenance managers discover capacity shortfalls when work orders start backing up — not 3 days earlier when re-prioritization would have prevented the delay. OxMaint's work order pipeline dashboard shows technician utilization in real time — surfacing the capacity issue before the backlog manifests and enabling proactive scheduling adjustments.
04
Parts Shortfalls Discovered After Work Order Creation
Traditional parts management surfaces shortfalls when a technician needs a part for a work order that is already in progress — delaying the repair, disrupting the shop schedule, and forcing emergency parts sourcing at 15–30% cost premium. OxMaint's AI-projected demand view shows which parts will be needed in the next 30 days based on the predictive alert queue — enabling procurement to stay ahead of actual demand.
05
Multi-Site Visibility Requiring Multiple Reports
Fleet managers responsible for vehicles at 3–10 depot locations currently receive separate reports from each site — or make phone calls to collect status updates. OxMaint's unified multi-site dashboard shows every location's fleet health, PM compliance, work order status, and fuel performance in a single view — with drill-down to individual vehicle level at any site from the portfolio overview.
06
CapEx Planning Disconnected From Daily Operations
Fleet replacement decisions are currently made in annual budget cycles from mileage-based estimates with no connection to the daily maintenance data that reveals actual vehicle condition. OxMaint's CapEx dashboard view is updated continuously from work order data and AI health scores — meaning the replacement priority ranking is always current, always condition-based, and always ready to support a budget conversation with investors or ownership groups.
How OxMaint's AI Dashboard Delivers Fleet-Wide Intelligence in Real Time
OxMaint's AI-enhanced dashboard is not a reporting layer added on top of a CMMS — it is the operational interface of the entire platform, displaying data that is generated continuously by the AI monitoring, work order, and parts systems operating underneath it.
Real-Time Telematics Data Integration
OxMaint connects to telematics data from any provider — Samsara, Geotab, Verizon Connect, Motive, OEM systems — through open APIs, updating vehicle condition indicators every 60–90 seconds. Temperature trends, vibration readings, efficiency metrics, and fault code frequencies stream into the AI health models continuously, ensuring the dashboard always reflects current vehicle state rather than yesterday's report cycle.
AI-Prioritized Alert Management
OxMaint's alert engine evaluates incoming telematics anomalies against each vehicle's individual behavioral baseline — filtering out single-reading noise and surfacing only trend-confirmed developing failures. Alerts are auto-ranked by estimated time to failure, flagged vehicle criticality, and operational impact — presenting the morning's 5 highest-priority items before the manager opens the inbox, rather than a flat list of 40+ alerts requiring individual triage.
Configurable Role-Based Dashboard Views
OxMaint's dashboard is configurable by role — the fleet manager sees portfolio-wide health overview and CapEx intelligence, the shop supervisor sees technician utilization and work order pipeline, the dispatcher sees vehicle availability and condition scores, and the technician sees their assigned work orders with full vehicle history. Each role sees the data relevant to their decisions without information overload from other operational layers.
Custom Alert Thresholds Per Vehicle and Fleet Type
OxMaint allows fleet managers to configure custom alert thresholds calibrated to their specific operation — tighter thresholds for high-value refrigerated cargo vehicles, more conservative thresholds for light-duty support vehicles, duty-cycle-specific monitoring intensity for extreme-load construction equipment. Custom thresholds combined with AI vehicle-specific baseline comparison delivers alert precision that generic fleet software cannot replicate.
Mobile Dashboard Access for Field Teams
OxMaint's dashboard is fully accessible on mobile — same real-time data, same AI alert queue, same work order pipeline — on any smartphone or tablet without a separate mobile app download for basic dashboard access. Fleet managers traveling between depots, maintenance supervisors on the shop floor, and operations executives in board meetings see the same live fleet intelligence as desktop users. No scheduled report required to know the fleet's current status.
Investor-Grade Portfolio Reporting
For fleet portfolios owned by investors, ownership groups, or corporate real estate operators, OxMaint's dashboard generates portfolio-level fleet condition reports — aggregating per-vehicle health scores, maintenance cost trajectories, PM compliance rates, and CapEx forecasts across all owned assets. Reports that previously required multi-day manual compilation from multiple site reports are available from the OxMaint dashboard in the time it takes to set the date range filter.
Replace Weekly Reports With a Real-Time AI Fleet Intelligence Dashboard
OxMaint's AI-enhanced dashboard converts your fleet's live telematics data into real-time health scores, predictive alert queues, PM compliance tracking, work order pipeline visibility, parts demand forecasting, and CapEx intelligence — all from a single platform that updates every 60–90 seconds. Free to start. No hardware required.
Traditional Fleet Reporting vs. AI-Enhanced Dashboard: The Operational Intelligence Gap
2–8 wks
Advance warning before component failure — from AI dashboard predictive alerts
Each alert converts a potential 4.8× emergency repair into a planned maintenance event — the primary ROI driver from AI dashboard deployment
60–70%
Reduction in false positive alerts vs. threshold-based systems
Vehicle-specific baseline comparison eliminates the alert fatigue that causes maintenance teams to disable monitoring systems
15–30%
Lower parts cost from AI-projected demand vs. reactive procurement
30-day parts demand forecast from the predictive alert queue converts emergency sourcing to planned purchasing across the fleet
93–97%
Fleet uptime achievable with AI dashboard real-time monitoring
vs. 82–88% with time-based PM and weekly reporting — 45% fewer unplanned downtime events from continuous AI condition monitoring
Frequently Asked Questions
What data sources does OxMaint's AI fleet maintenance dashboard connect to — and how is it set up?
OxMaint's AI dashboard draws from three primary data sources that connect during initial platform setup. The first is telematics integration: OxMaint connects to any telematics provider through open APIs — Samsara, Geotab, Verizon Connect, Motive, and OEM telematics systems. This integration streams vehicle condition data — engine temperature, vibration, fuel efficiency, fault code frequency, battery health, and brake performance — into OxMaint's AI health models every 60–90 seconds. The second source is the OxMaint CMMS work order layer: every work order creation, completion, parts usage, and technician action updates the dashboard in real time. PM schedule data, inspection results, and defect reports from driver DVIR submissions also feed the dashboard continuously. The third source is the parts inventory module: current stock levels, minimum thresholds, pending purchase orders, and AI-projected demand all display on the dashboard and generate proactive alerts when shortfalls are projected. Initial setup typically takes 1–3 days for telematics connection, vehicle data import, and PM schedule configuration. The dashboard begins displaying live data immediately after telematics connection. AI health models require 60–90 days of fleet-specific data to reach full accuracy — during this period, the dashboard displays all available current data with improving predictive precision over time.
Sign up free to begin your dashboard setup today.
How does OxMaint's AI dashboard reduce alert fatigue — and what makes its alerts different from threshold-based systems?
Alert fatigue is one of the most common reasons fleet maintenance AI projects fail — teams receive 40–60 alerts per day from threshold-based systems, discover that most are false positives caused by normal vehicle-to-vehicle variation, and progressively stop responding to alerts that have a poor signal-to-noise ratio. OxMaint's dashboard addresses this through vehicle-specific baseline comparison rather than fleet-wide thresholds. Instead of firing an alert when any vehicle's temperature reading crosses 220°F, OxMaint evaluates each reading against that specific vehicle's own historical temperature profile at equivalent load and route conditions. A vehicle that always runs at 215°F is not generating an alert at 217°F. A vehicle whose baseline is 200°F is generating a genuine anomaly at 208°F that warrants monitoring. This approach reduces false positive alert rates by 60–70% compared to threshold-based systems. Additionally, OxMaint requires trend persistence before escalating to a maintenance work order — a single anomalous reading increases monitoring frequency on that vehicle, but only a confirmed trend over 3–7 days generates a prioritized work order. Alerts that do reach the dashboard's priority queue are sorted by estimated urgency (days to required intervention), not by vehicle ID or alert timestamp. Fleet managers see the 5 most urgent items every morning without manually triaging a 40-item list. This combination of baseline-based filtering and urgency-ranked presentation converts alert management from a daily cognitive burden into a focused 5-minute morning review.
Book a demo to see the alert queue in operation for a fleet similar to yours.
How does the AI dashboard handle multi-site fleet operations — and what does portfolio-level visibility look like?
OxMaint's multi-site dashboard architecture is built on a single data layer that spans all locations — there is no separate reporting system for each depot that feeds a consolidated view manually. When a vehicle at a remote depot generates an AI alert, it appears in the central portfolio dashboard immediately — at the same urgency ranking and with the same work order automation as a vehicle at the home base. The portfolio-level dashboard view shows all sites simultaneously: fleet health scores by site, PM compliance rates by site, open predictive alerts by site, technician utilization by site, and maintenance cost per vehicle by site — all in a single screen with drill-down to individual vehicle level at any site from the top-level view. For multi-site fleet managers who currently spend Monday mornings collecting status reports from 4–8 depot managers by phone, this single-screen portfolio view replaces that process entirely. For investors and ownership groups evaluating fleet condition across a portfolio of assets, OxMaint generates portfolio-level reports directly from the dashboard — showing aggregate condition scores, maintenance cost trajectories, PM compliance rates, and CapEx forecasts in the investor-grade format that supports capital allocation decisions. Adding a new location to OxMaint is a configuration exercise — vehicle data import and telematics connection — not a new platform deployment. The portfolio dashboard grows with the fleet without any architectural change.
Sign up free to configure your multi-site portfolio dashboard.
How does the AI dashboard support CapEx planning and fleet replacement decisions — and how current is the data?
OxMaint's CapEx dashboard view is updated continuously from daily work order completions and real-time AI health monitoring — not from an annual manual assessment exercise. The replacement priority ranking visible on the dashboard reflects the accumulated condition score of each vehicle: every work order, every AI health alert, every parts replacement, and every telematics condition reading contributes to a per-vehicle condition score that updates daily. This score allows the CapEx view to distinguish between vehicles that should be prioritized for replacement based on actual component degradation — regardless of their odometer reading. A 95,000-mile vehicle with multiple AI-flagged system degradations and escalating maintenance cost per mile ranks higher for replacement than a 140,000-mile vehicle with consistent condition scores and no open health alerts. The rolling 5–10 year CapEx projection visible on the dashboard is generated from three data inputs: the current condition score trajectory per vehicle (extrapolated forward using the AI's degradation rate model), the historical maintenance cost per mile per vehicle (identifying vehicles whose cost trend has crossed the economically rational replacement threshold), and fleet-wide failure pattern intelligence (flagging vehicle models approaching the mileage bands where documented failure patterns emerge). For board presentations, investor updates, and budget cycle conversations, the OxMaint CapEx dashboard provides the engineering-data-backed capital justification that mileage-based estimates cannot offer.
Book a demo to see the CapEx dashboard configured for your fleet's age and condition profile.
Stop Managing Your Fleet From Last Week's Report. OxMaint Shows You Right Now.
OxMaint's AI-enhanced fleet maintenance dashboard delivers real-time vehicle health scores, urgency-ranked predictive alerts, live work order pipeline visibility, 30-day parts demand forecasting, and continuous CapEx intelligence — all from a single platform updating every 60–90 seconds. Free to start. No hardware required. First prevented failure pays for the platform. Join 1,000+ organizations running AI-enhanced fleet dashboard intelligence with OxMaint.