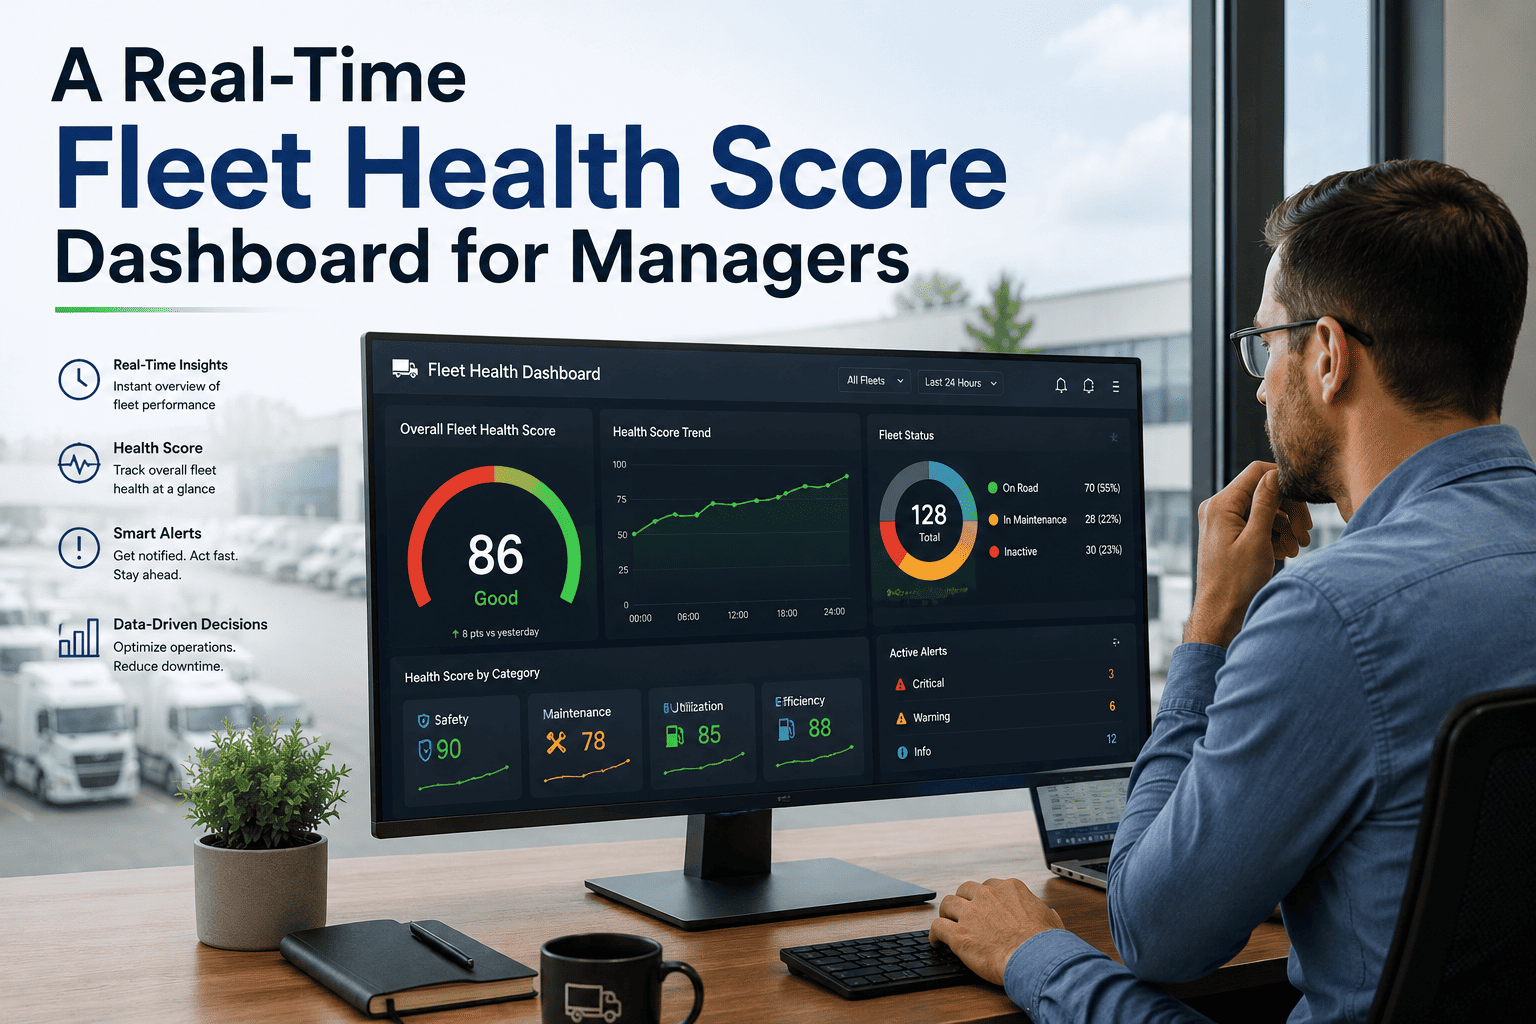
Every morning, a fleet manager opens five different screens before they can answer one simple question: is my fleet actually healthy today? Telematics shows fault codes, the maintenance system shows overdue work orders, the compliance log shows expiring inspections, and the three rarely agree with each other. By the time someone stitches the numbers together in a spreadsheet, the picture is already hours old and the risk has already moved on to the next vehicle. A fleet health score fixes this by pulling telematics, maintenance, and compliance data into one number per vehicle that updates as the data arrives, not once a week. See how OxMaint builds a live health score from data your fleet already generates.
Fleet Health Score Dashboard — OxMaint
One Score Per Vehicle. Zero Screen-Switching.
Telematics, maintenance, and compliance data rolled into a single, continuously updated health score for every asset in your fleet.
Why Fleet Managers Are Drowning in Dashboards, Not Insights
More data was supposed to mean better decisions. Instead, most fleet managers now sit in front of dashboards with thirty or more metrics competing for attention, and the one number that actually matters gets buried under noise. A health score exists to reverse that.
68%
Of fleet managers report feeling overwhelmed by the volume of raw telematics data hitting their screens every day, according to 2025 industry surveys.
50%
Fewer breakdowns are typical once preventive maintenance compliance climbs from an average 70% to a best-in-class 94%.
10 sec
The industry benchmark for how fast a manager should be able to answer "is my fleet healthy today" from a dashboard — most tools take far longer.
What Actually Feeds a Fleet Health Score
A trustworthy health score is never a single feed pretending to be the whole picture. It has to weigh four categories of live data against each other, then compress them into one number a manager can glance at in seconds and still trust enough to act on.
Mechanical Health
Engine fault codes, oil pressure, coolant temperature, and diagnostic trouble codes pulled straight from OBD-II and J1939 data — the earliest warning a component is degrading before it fails on the road.
Maintenance Compliance
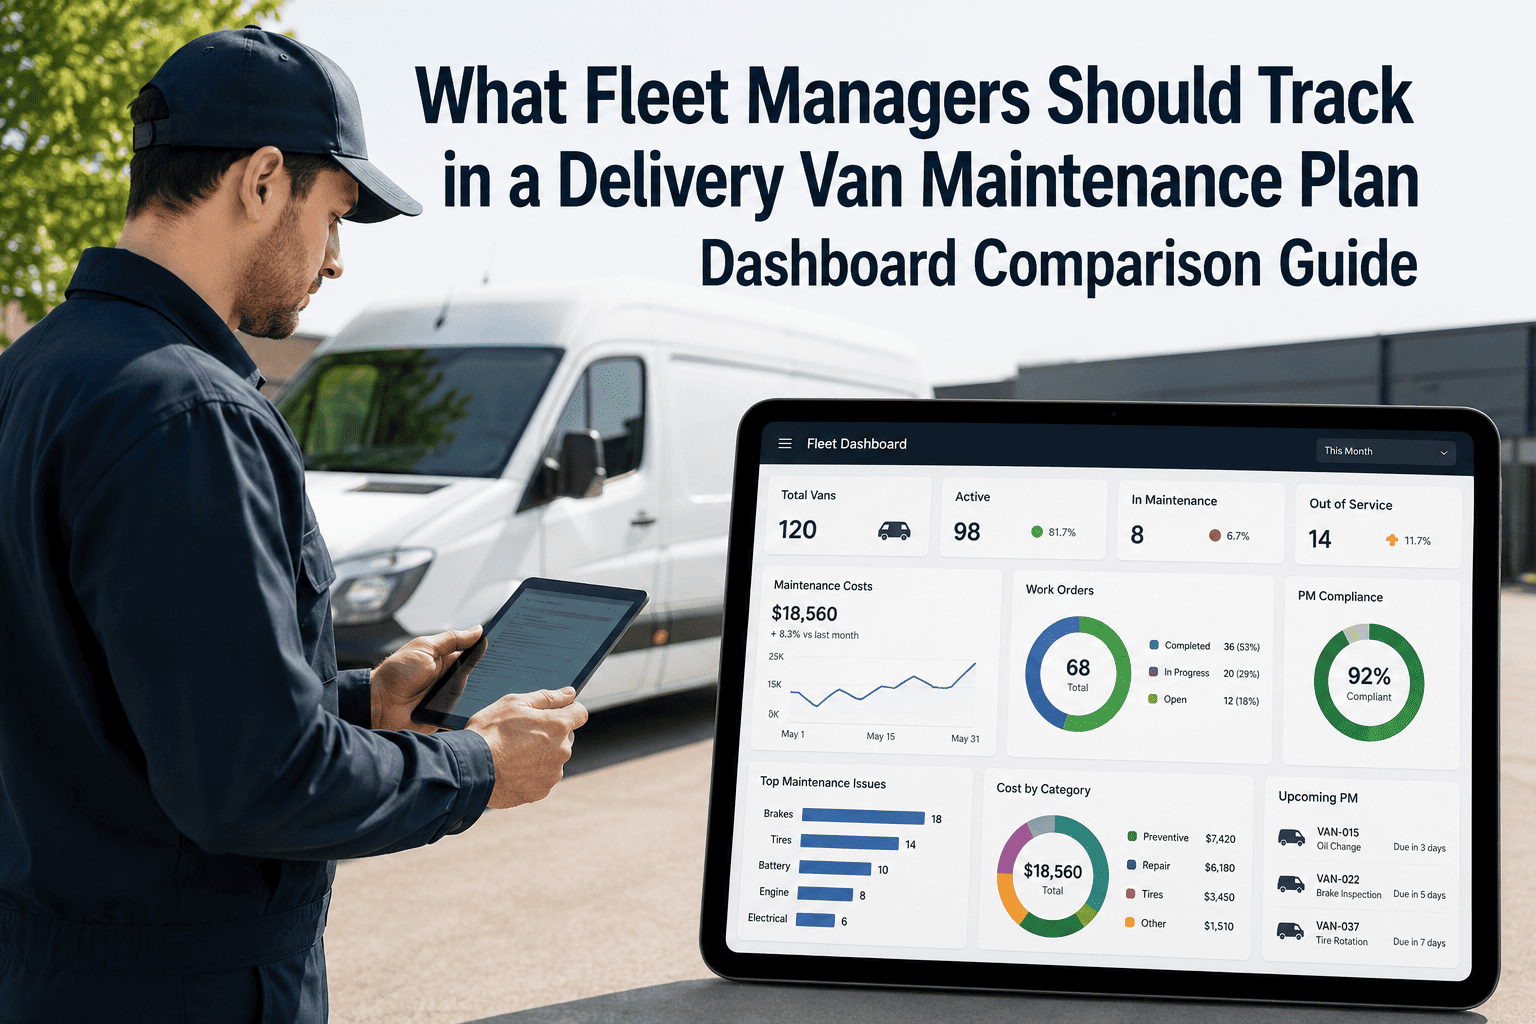
Open work orders, overdue PM intervals, and first-time fix rate. This is the single leading indicator that drags every other score down when it slips, so it carries the heaviest weight.
Compliance & Inspection
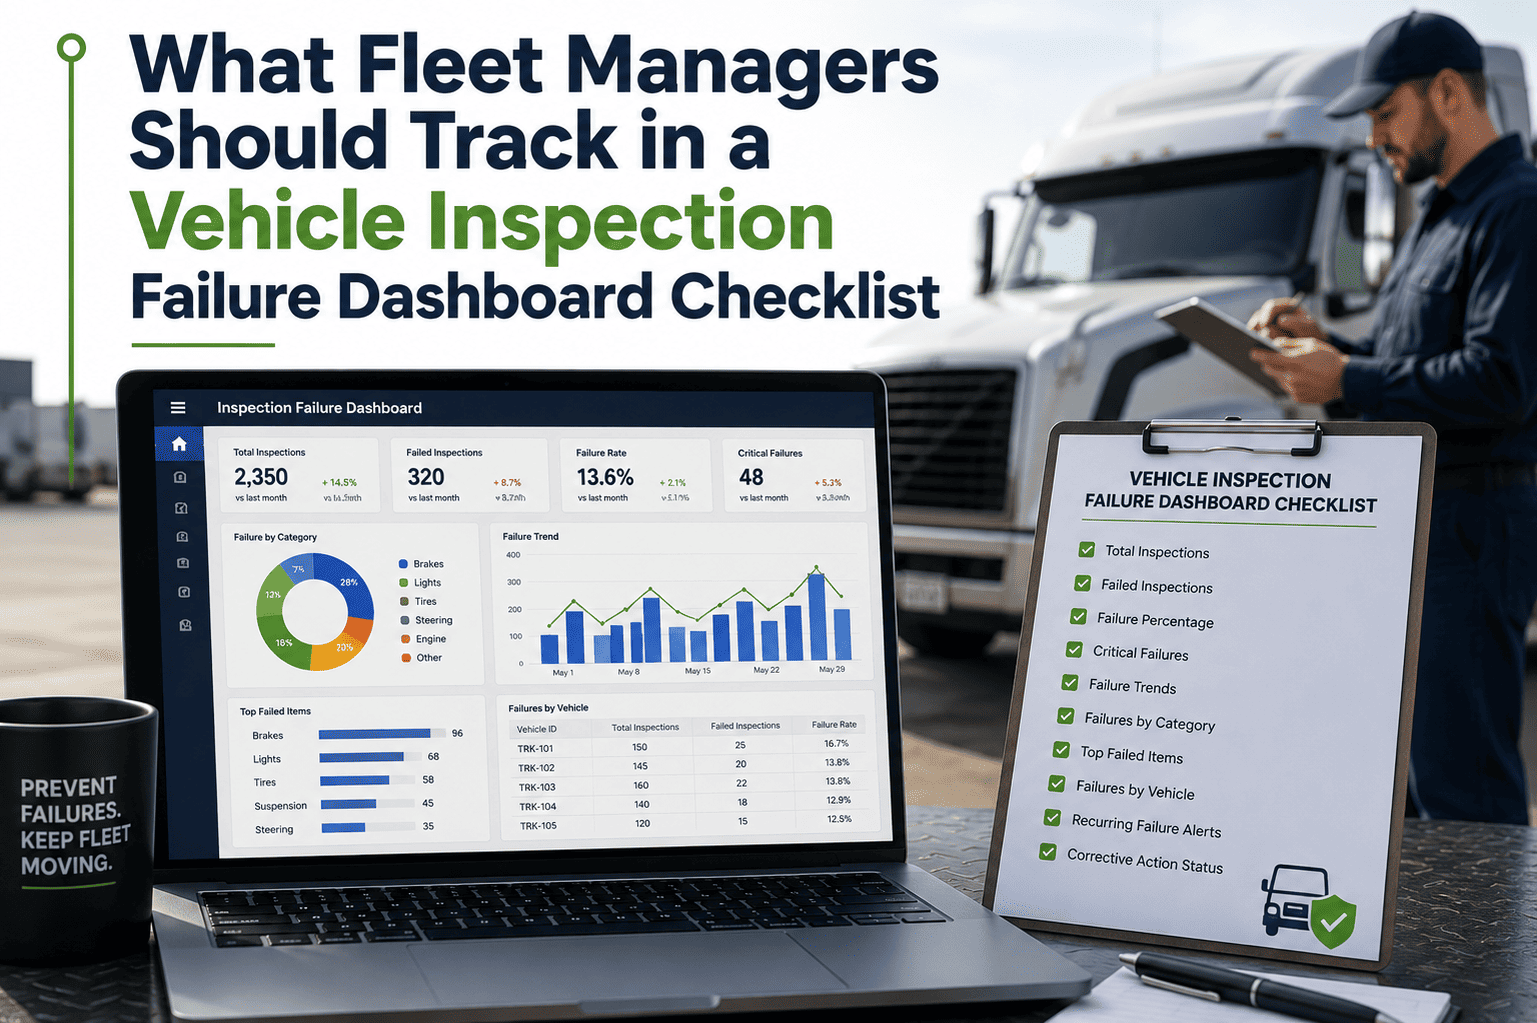
DVIR defect history, photo-verified inspections, and expiring certifications. With CSA scoring now grading driver-observed defects separately, this pillar carries real audit and insurance weight.
Utilization & Safety
Idle time, harsh braking events, and mileage-versus-capacity trends. A vehicle can be mechanically sound and still be a rising risk if it is being driven or scheduled the wrong way.
From Raw Data To a Number You Can Trust — In Four Steps
A health score is only useful if you know exactly what built it. OxMaint keeps every stage of the calculation visible, so the headline number is always one click away from the raw data behind it.
Continuous
Data Ingestion
Telematics feeds, work order history, fuel card transactions, and inspection forms sync in automatically — no manual export, no Friday-afternoon spreadsheet stitching.
Hourly
Score Calculation
Each of the four pillars is weighted and recalculated as new data lands, so a fault code logged at 9am is reflected in the score by 10am, not next Monday.
Live
Dashboard Display
One score per vehicle, per depot, and fleet-wide — colour-coded and ranked so the vehicles that need attention today rise straight to the top of the list.
On Threshold
Alert & Work Order
When a score crosses a set threshold, OxMaint opens a work order automatically — turning a falling number into a scheduled repair instead of a roadside breakdown.
Old Way vs. Health Score Dashboard
The difference isn't just visual polish — it is how fast a manager can act, and how much of that action happens before a vehicle actually fails.
| What You Need To Know |
Spreadsheets & Separate Systems |
Fleet Health Score Dashboard |
| Time to answer "is my fleet healthy today" |
Hours, once data is compiled |
Under 10 seconds |
| Number of screens checked each morning |
Four or five separate systems |
One dashboard |
| Maintenance trigger |
Reactive, after a fault is reported |
Automatic, at score threshold |
| Audit and insurance readiness |
Manual document pull, days |
Exportable report, minutes |
| Data freshness |
Weekly or monthly snapshot |
Continuously updated |
Live In Days, Not Months
Turn Your Existing Fleet Data Into One Trustworthy Score
No new hardware required. OxMaint connects to the telematics, maintenance, and inspection data your fleet is already producing and builds your first health score dashboard fast.
Before this, I could tell you which trucks had open work orders or which ones threw a fault code, but never both at once. Now I open one screen and the vehicles that need me today are already sorted to the top. My morning routine went from forty-five minutes of cross-checking systems to about five.
Maintenance Operations Manager, regional mixed-fleet carrier
What Powers a Real-Time Health Score
A health score is only as good as the systems feeding it. OxMaint's dashboard is built on four integration layers that keep the score accurate without adding extra work for your team.
Telematics & OBD Integration
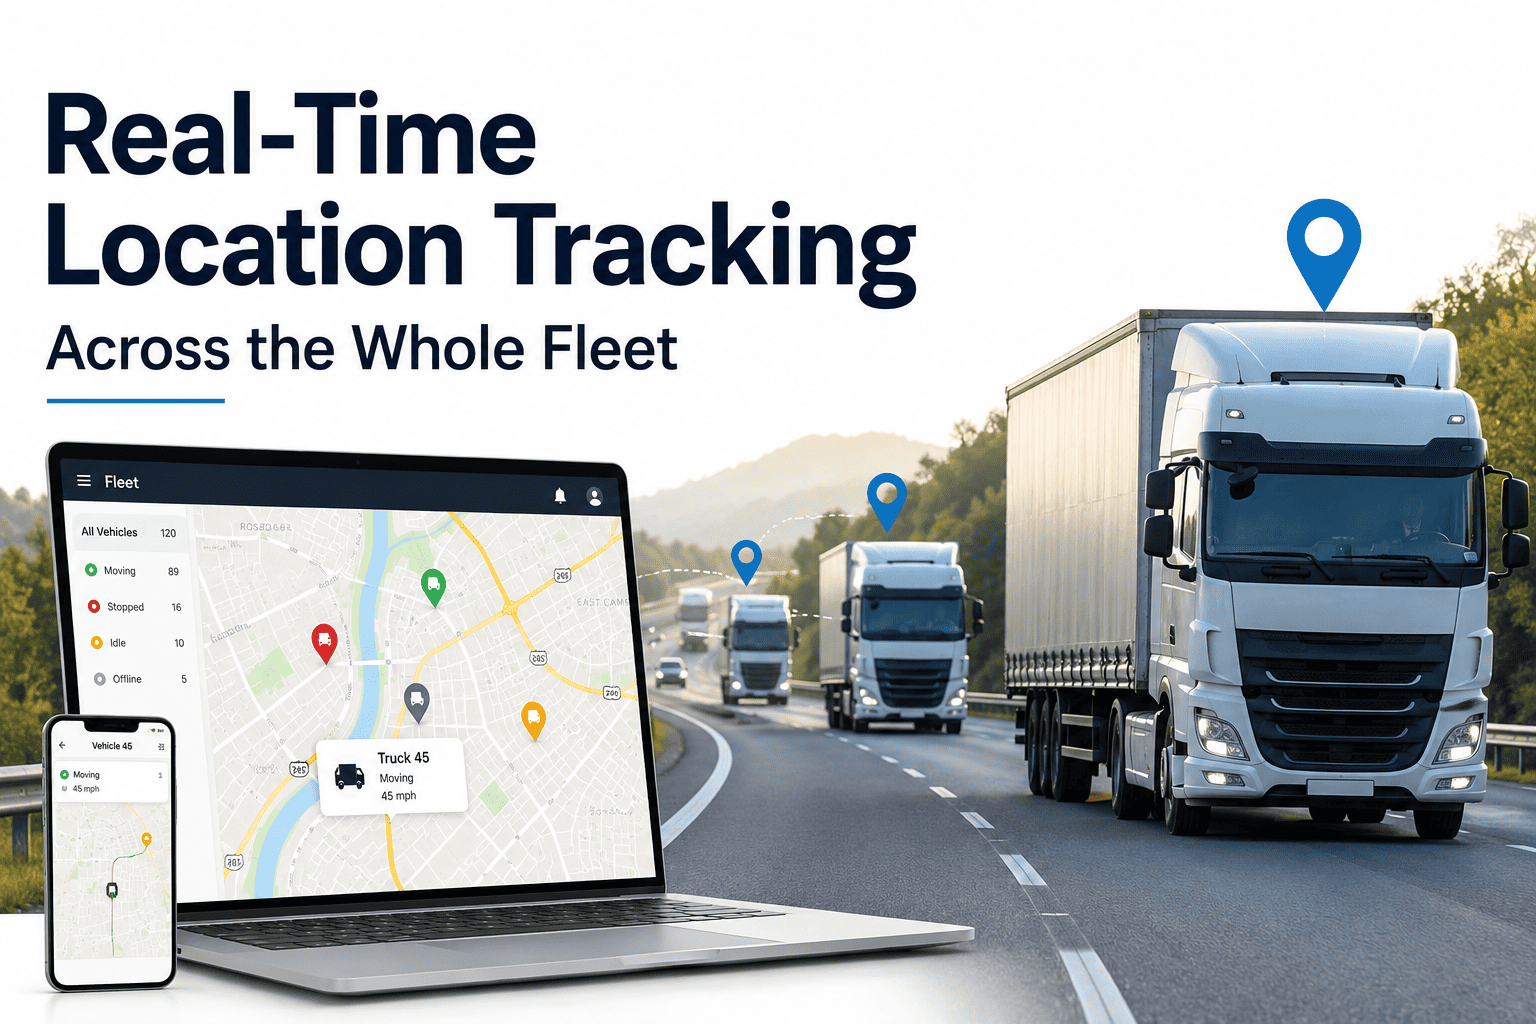
Connects to Samsara, Geotab, Verizon Connect, and most major GPS and ELD providers to pull engine diagnostics, idle time, and driver behaviour straight into the score.
Predictive Scoring Engine
Learns each vehicle's normal degradation pattern and flags when a metric drifts outside it — surfacing the vehicles most likely to fail before the fault becomes visible on a report.
Compliance & DVIR Sync
Photo-verified inspections and defect reports feed the compliance pillar automatically, keeping the score aligned with current CSA and DOT audit expectations.
Mobile Access For Techs & Drivers
Technicians see the score and the reason behind it from the shop floor, and drivers get their own vehicle's status before they even start the engine.
Frequently Asked Questions
What data actually feeds a fleet health score?
How is a health score different from a telematics dashboard?
Telematics shows you raw signals like fault codes and idle time. A health score combines that with maintenance and compliance data into one weighted number, so you know what to act on first.
Does it work for a mixed fleet of diesel and electric vehicles?
Yes. Engine diagnostics and battery health are scored using separate logic, then rolled into the same fleet-wide dashboard so mixed powertrains don't need a second system.
How often does the score actually update?
As new data arrives from telematics, work orders, or inspections, typically within the hour — not on a weekly or monthly reporting cycle.
Can I see this running against my own fleet before committing?
Fleet Health Score Dashboard — OxMaint
Stop Checking Five Screens. Start Checking One Score.
1 score
per vehicle, updated live
4 pillars
mechanical, PM, compliance, safety