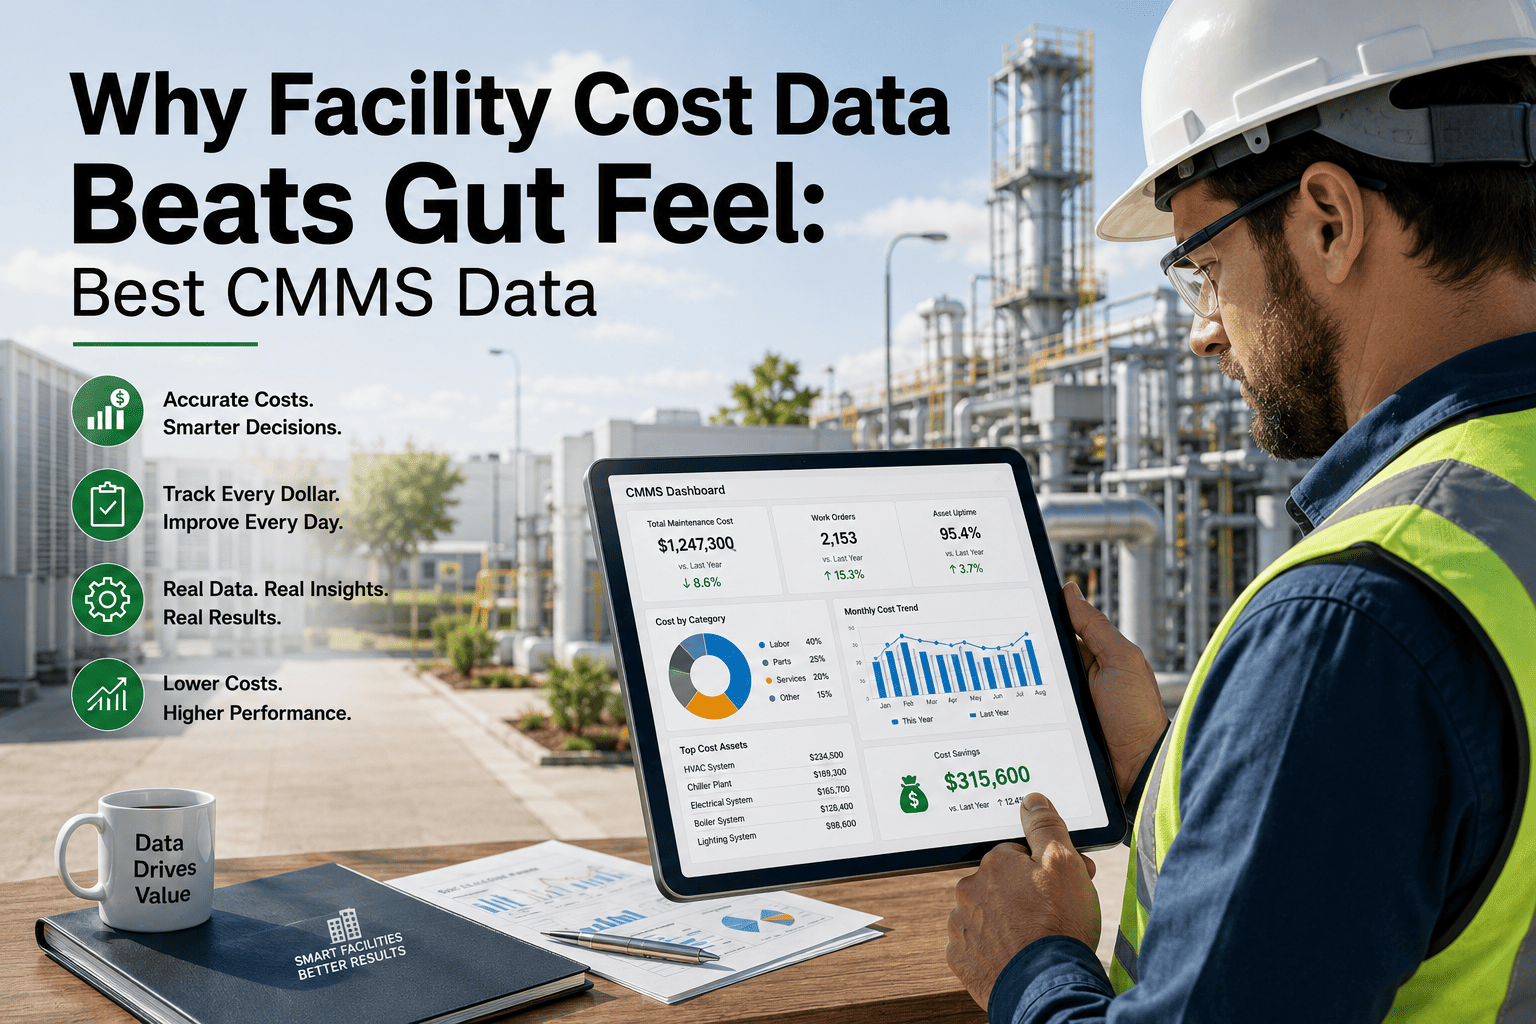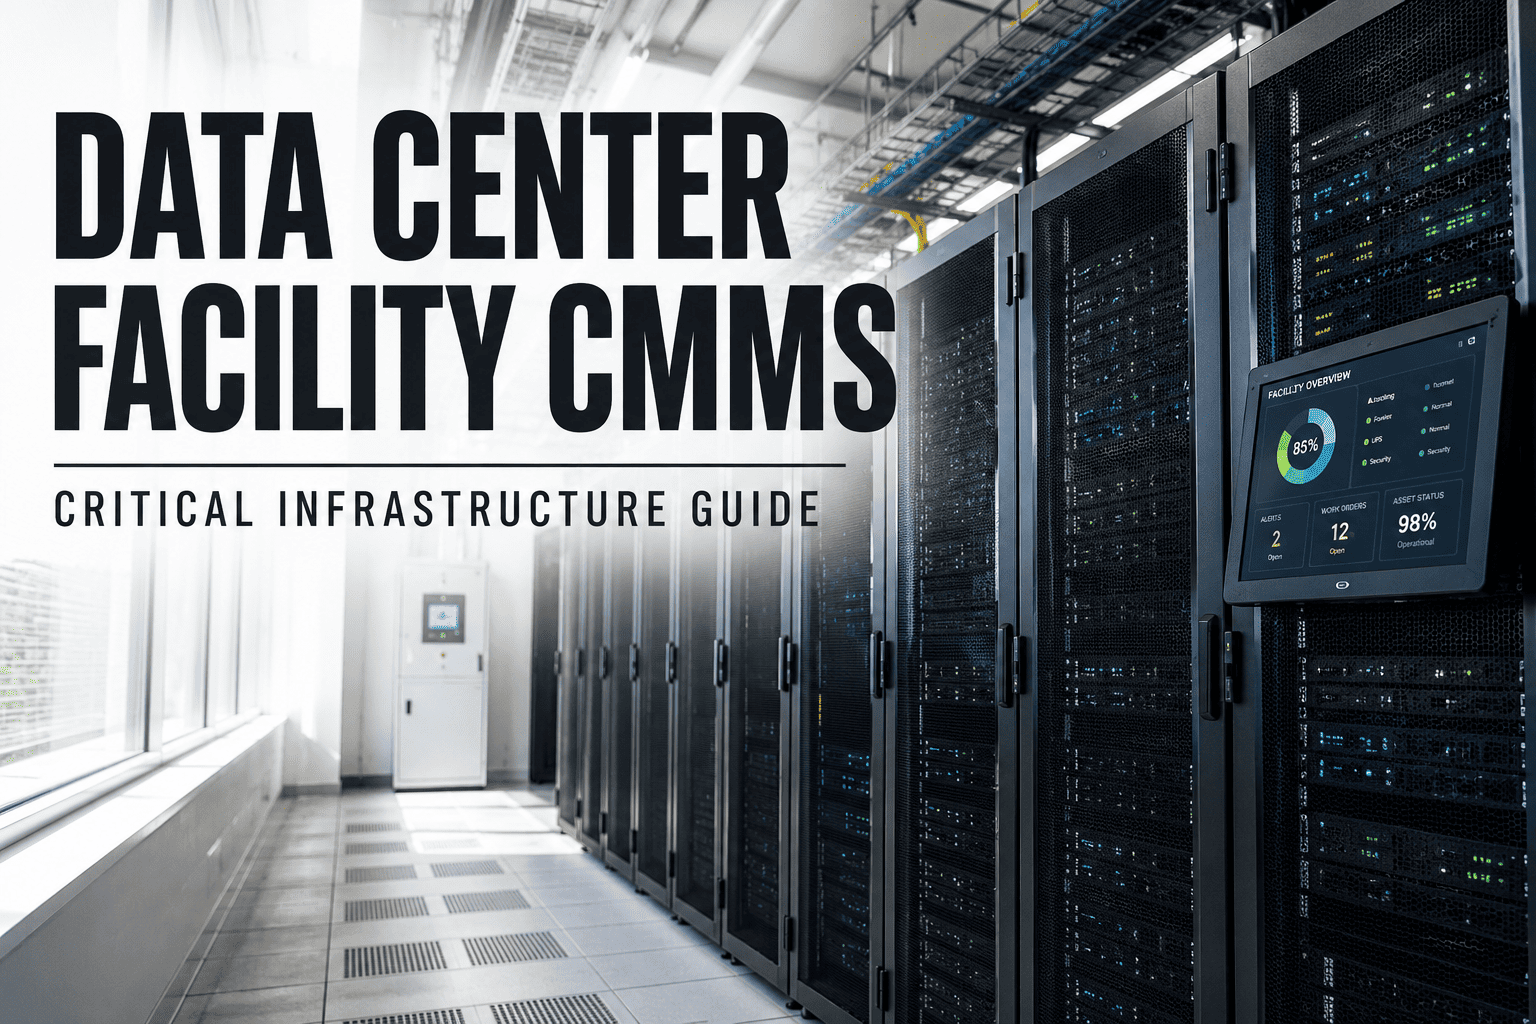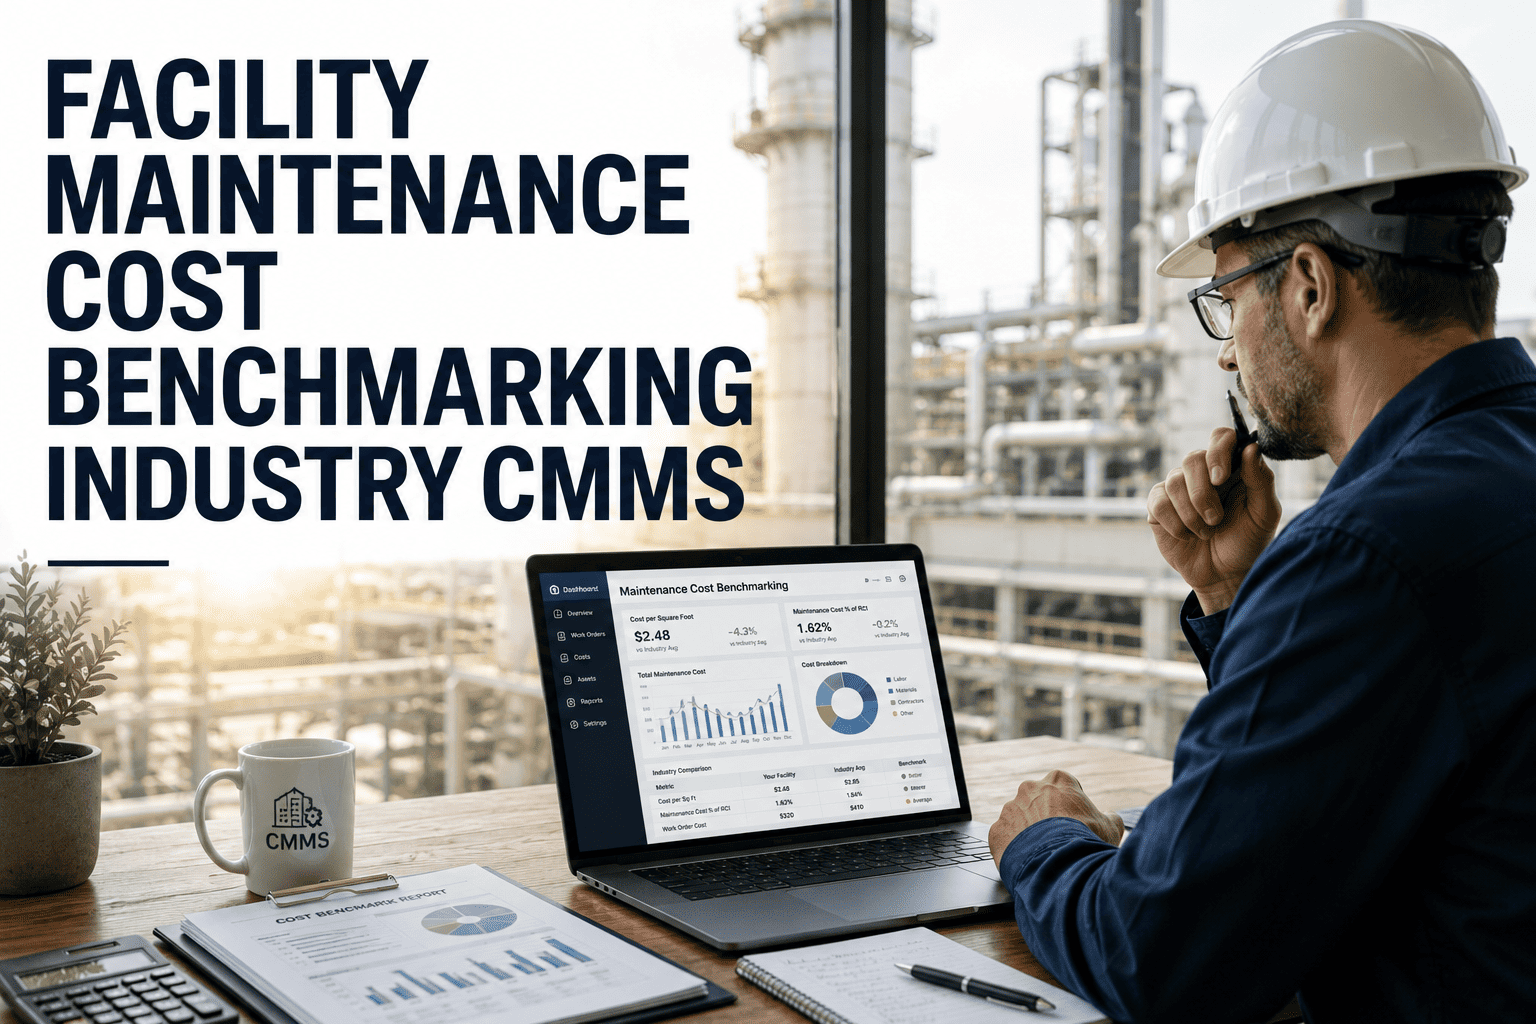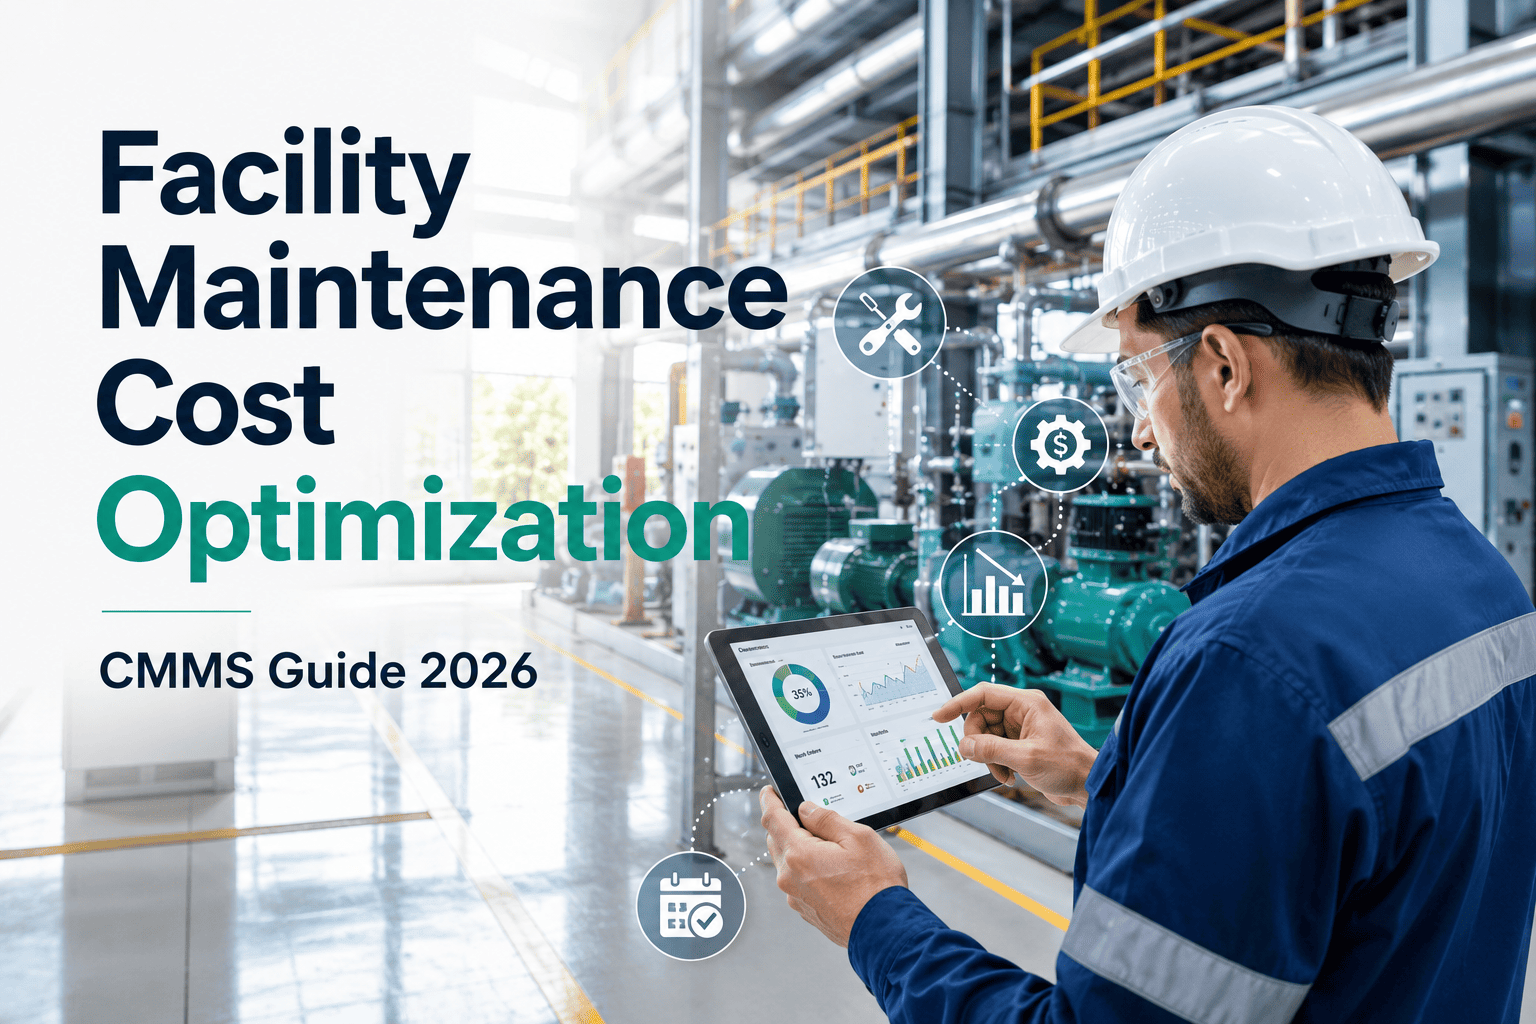
Facility maintenance budget justification fails most often not because the ask is unreasonable, but because the evidence is anecdotal. A data-driven budget facility strategy—anchored in CMMS-generated cost avoidance tracking, asset life-extension metrics, and downtime analytics—gives facility leadership the defensible numbers they need to approve funding with confidence. This guide walks through the exact CMMS facility budget evidence you should present, how to structure your budget approval narrative, and how platforms like OxMaint automate the documentation so nothing slips through the cracks. If you want to skip ahead and see the dashboards in action, Start Free Trial or read on for the full framework.
Can You Prove $1 Spent on Maintenance Saves $5 in Capital Replacement?
Most facility teams lose budget battles because they bring opinions, not evidence. A CMMS turns every work order, asset history log, and downtime event into the cost-avoidance proof your CFO needs to say yes.
How to Build a Data-Driven Facility Budget Justification
A defensible budget package follows a repeatable six-step sequence. Each step produces a specific artifact that facility leadership can audit, question, and ultimately approve.
Baseline Current Spend with CMMS Facility Budget Evidence
Pull 12 months of work-order data from your CMMS. Categorize spend by asset class, failure mode, and labor vs. parts. A 180-asset plant typically discovers 40–55% of labor hours are consumed by unplanned reactive work—exactly the number that frames the urgency for investment.
Document Cost Avoidance from Preventive Maintenance
For every PM completed, log the predicted failure it prevented and the estimated repair cost. Industry benchmarks show every $1 in PM saves $4–5 in corrective repairs. Your CMMS work-order history provides the before-and-after evidence.
Quantify Asset Life Extension in Dollars
Track mean time between failures (MTBF) per critical asset. An HVAC chiller rated for 15 years that averages 18 years under disciplined PM represents $60K–$120K in deferred capital replacement—real money leadership can redirect.
Translate Downtime into Revenue Loss
Multiply unplanned downtime hours by your facility's cost-per-hour. A manufacturing line losing $8,500 per hour of stoppage that drops from 140 to 90 annual downtime hours has saved $425K—far exceeding a $35K CMMS subscription.
Compile the Budget Evidence Package
Assemble a one-page executive summary backed by CMMS analytics dashboards: baseline spend, cost avoidance total, asset life extension value, downtime reduction, and the proposed investment with projected payback period.
Present with Live Dashboards, Not Static Slides
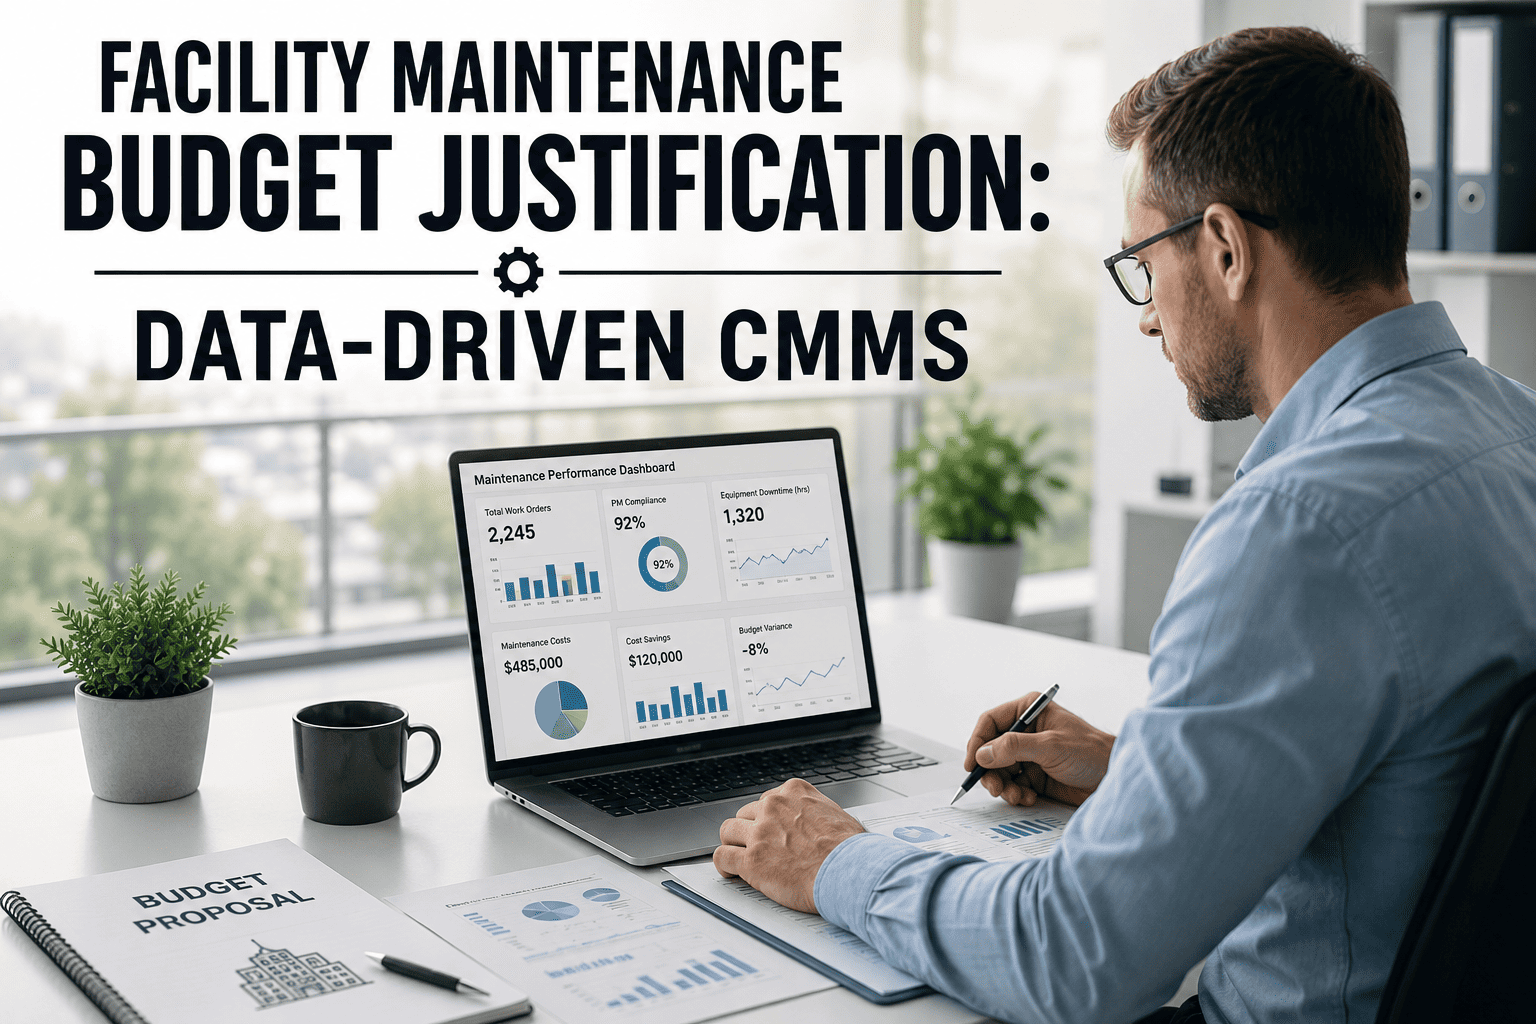
Open the CMMS during the budget meeting. When a CFO can drill into a specific asset's failure trend and cost history in real time, skepticism drops and approval rates climb. OxMaint's live analytics make this effortless.
Facility Cost Avoidance Formulas Every Manager Should Know
Facility leadership budget conversations move faster when you speak in formulas. Here are the four equations that translate maintenance activity into financial proof.
Cost Avoidance per PM Cycle
Example: A $2,200 bearing failure at 70% probability prevented by a $180 PM = $1,360 avoided per cycle.
Asset Life Extension Value
Example: A $90K compressor rated 12 years, extended to 16 = $30,000 deferred per unit.
Downtime Cost Recovery
Example: 50 fewer hours at $8,500/hr = $425,000 recovered annually.
CMMS Payback Period
Example: $35K platform ÷ $520K documented savings = 0.8-month payback.
Spreadsheet vs. CMMS: Which Produces Better Budget Evidence?
The gap between managing maintenance in spreadsheets and running it through a CMMS is the gap between rejected and approved budgets. Here is what changes.
| Budget Evidence Factor | Spreadsheets / Paper Logs | OxMaint CMMS |
|---|---|---|
| Work Order Documentation | Manual entry, 15–30% data gaps, no timestamps | Auto-stamped, mobile-verified, 99%+ completion rate |
| Cost Avoidance Tracking | Reconstructed quarterly; often disputed by finance | Calculated per work order in real time, audit-ready |
| Asset Failure History | Scattered across tabs and binders, incomplete | Full lifecycle per asset, MTBF/MTTR auto-computed |
| Downtime Attribution | Estimated, rounded, often underreported by 20–40% | Tracked to the minute, tagged by cause code |
| Executive Dashboard Readiness | Days of manual chart-building before each review | Live, drill-down dashboards always current |
| Audit & Compliance Trail | Weak; hard to reconstruct who did what and when | ISO 55000-aligned, full user-action history |
Bring Data, Not Opinions, to Your Next Budget Meeting
See how OxMaint automatically generates the cost-avoidance reports, asset life metrics, and downtime analytics your CFO needs to approve funding—live on your own assets.
How OxMaint Generates the Evidence That Gets Budgets Approved
OxMaint doesn't just manage work orders—it automatically produces the four categories of CMMS facility budget evidence that facility leadership needs to see before signing off.
Automated Cost Avoidance Reports
Every completed PM auto-calculates avoided repair cost using your asset-specific failure probability models. Export a quarterly cost-avoidance summary in one click—no manual spreadsheet reconstruction.
Outcome: Finance-grade evidence in minutes, not daysAsset Lifecycle & MTBF Tracking
OxMaint tracks every asset from install to retirement, auto-computing MTBF, MTTR, and lifecycle extension versus manufacturer ratings. Show exactly how many capital-replacement years your PM program has added.
Outcome: Quantify deferred CapEx per asset classPredictive Failure Analytics
AI-driven vibration, temperature, and runtime data analysis predicts failures 2–6 weeks before they happen. Convert predicted downtime hours into dollars saved—before the failure occurs—so the budget case builds itself.
Outcome: Cut unplanned downtime 30–50%Live Executive Dashboards
Pre-built budget-justification dashboards display cost avoidance, downtime trends, PM compliance, and asset health scores in real time. Open one during your budget review and let leadership drill into any number instantly.
Outcome: Approve with confidence, audit with easeA 180-Asset Manufacturing Facility: Budget Justification in Action
Consider a mid-sized manufacturing plant running 180 critical assets on spreadsheets, spending $42K annually on reactive repairs and losing 140 production hours to unplanned downtime. Here is what happened when they deployed OxMaint and rebuilt their budget case on CMMS evidence.
With $387K in documented savings against a $35K OxMaint subscription, payback was under 1.1 months. The facility's next budget cycle approved a 40% increase in preventive maintenance funding—because the evidence was undeniable.
Facility Budget Justification: Common Questions Answered
What is facility maintenance budget justification?
Facility maintenance budget justification is the process of presenting quantified evidence—cost avoidance, asset life extension, downtime reduction, and compliance readiness—to secure funding approval from facility leadership or finance teams. The strongest justifications use CMMS-generated data rather than estimates, giving decision-makers auditable proof that every dollar invested in maintenance prevents $4–5 in future capital and repair costs.
How does a CMMS help justify maintenance budgets?
A CMMS like OxMaint automatically tracks every work order, asset failure, PM completion, and downtime event with timestamps and cost data. This produces real-time cost avoidance reports, MTBF trends, and downtime analytics that translate maintenance activity into financial language. Instead of rebuilding spreadsheets before each budget cycle, you export audit-ready dashboards—see how it works by booking a 30-minute demo.
What metrics should I include in a maintenance budget proposal?
Include five core metrics: annual reactive repair spend, cost avoidance from completed PMs, asset life extension in deferred CapEx dollars, unplanned downtime hours translated to revenue loss, and PM compliance percentage. Pair these with a payback calculation showing the ratio of documented savings to proposed investment. CMMS platforms like OxMaint auto-generate all five in live executive dashboards.
How much money can facility cost avoidance tracking save?
Industry benchmarks show that organizations using CMMS-driven cost avoidance tracking document $3–5 in avoided repairs for every $1 spent on preventive maintenance. For a mid-sized facility with 150–200 assets, this typically translates to $200K–$500K in annual documented savings, depending on asset criticality and downtime cost per hour.
How long does it take to see ROI from a CMMS for budget evidence?
Most facilities see measurable ROI within 3–6 months of CMMS deployment, as PM compliance rises and reactive work drops. Full budget-justification evidence—enough to win increased funding—typically accumulates over 6–12 months of disciplined work-order data. OxMaint's onboarding gets your assets imported and dashboards live within 2–4 weeks, so evidence starts building immediately.
Stop Guessing. Start Proving Your Maintenance ROI.
OxMaint turns every work order and asset event into the budget evidence your leadership team needs. Book a demo and we'll show you exactly how the numbers look on your assets.
Free 14-day trial · No credit card