Most facility managers know their maintenance program is costing more than it should — they just cannot quantify it in numbers that move a budget conversation. Reactive repairs cost 3–5 times more than planned work. Every missed PM is a future emergency. Every hour spent on manual reporting is an hour not spent on the floor. Start a free trial with Oxmaint CMMS and see exactly where your facility's maintenance spend is going — or book a 30-minute demo with our team to walk through a customized ROI estimate for your building type and team size.
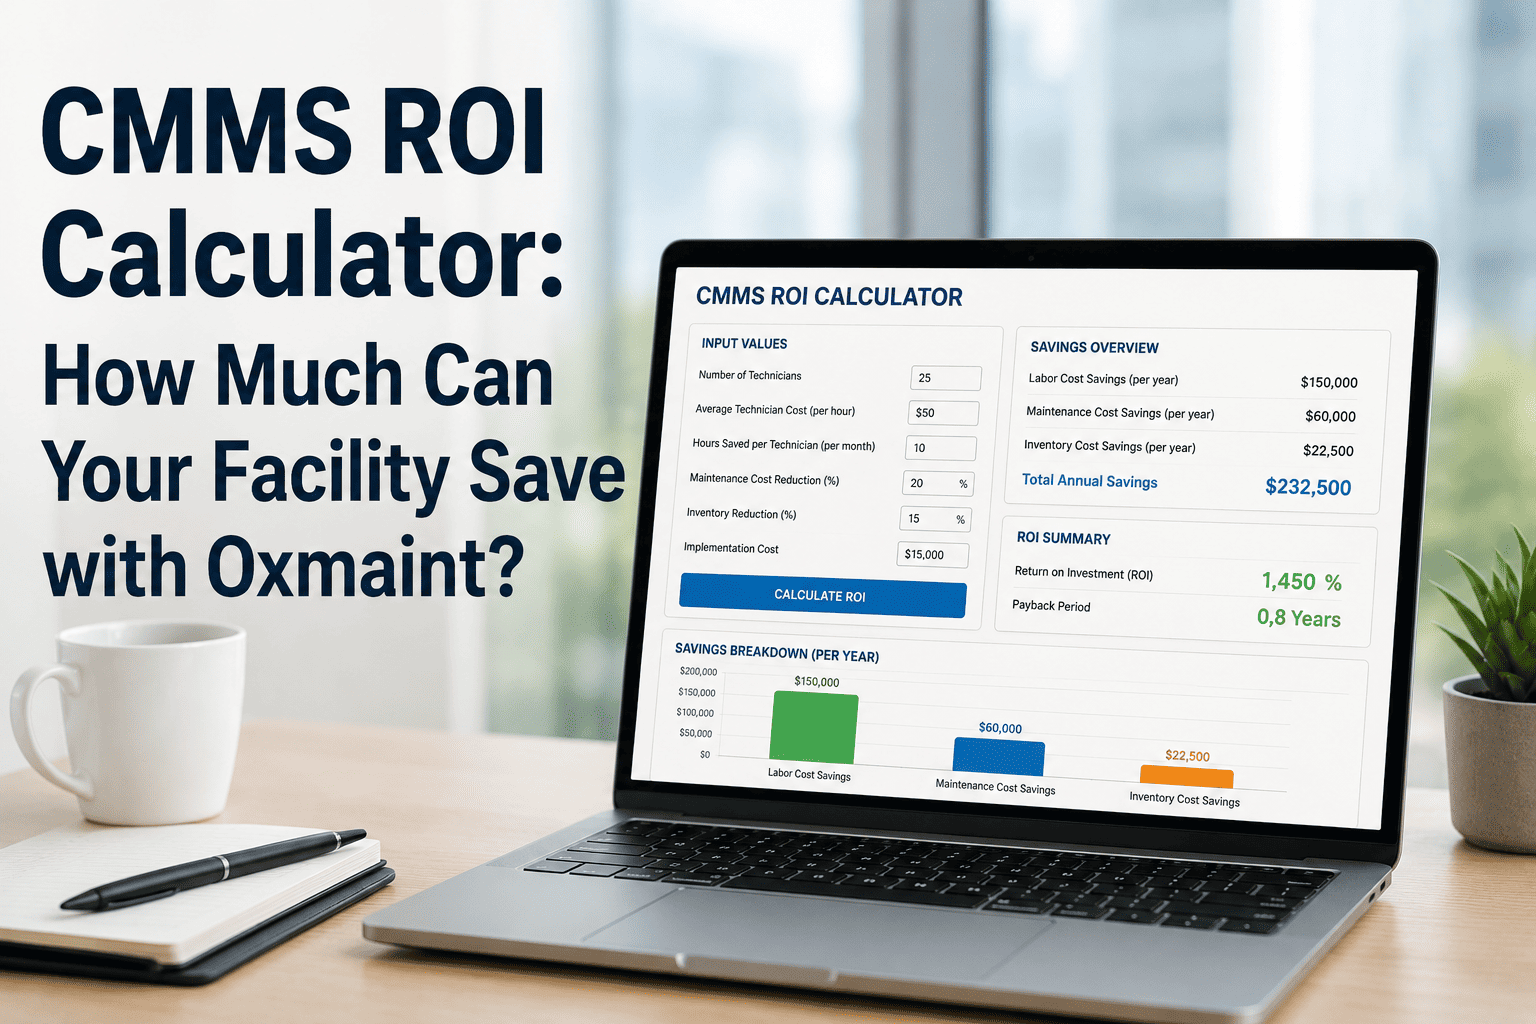
CMMS ROI Calculator: How Much Can Your Facility Save with Oxmaint?
Oxmaint customers save an average of 30% on total maintenance costs within 12 months. Here is the framework to calculate exactly what that means for your facility — by cost category, by team size, by building type.
Five Cost Categories Where Facilities Overspend Without a CMMS
CMMS ROI is not a single number — it is the sum of recoverable waste across five distinct cost categories. Most facilities are leaking in all five simultaneously, which is why the aggregate savings figure consistently surprises finance teams when it is quantified for the first time.
Every unplanned repair carries a premium over the same work performed as a scheduled PM — emergency callout fees, overtime labor, expedited parts shipping, and extended downtime. Facilities averaging 38% reactive work are paying this premium on nearly 4 in 10 maintenance events. CMMS typically reduces reactive ratio to below 20% within 12 months.
Facility teams without CMMS spend 8–14 hours per week manually compiling KPI reports, maintenance logs, and compliance documentation from spreadsheets. At a loaded technician rate of $55–75/hour, that is $22,000–$55,000 in annual labor cost producing reports that a CMMS generates automatically with zero additional effort from the maintenance team.
Equipment that misses preventive maintenance intervals degrades faster, fails sooner, and consumes more energy in its degraded state. IFMA benchmarks consistently show that facilities operating at 80% or higher PM compliance carry 40–50% lower total maintenance cost per square foot than reactive programs — a direct reflection of avoided failures and extended asset life.
HVAC systems with dirty coils, worn belts, and degraded refrigerant charge consume 15–30% more energy than equipment maintained at design condition. The U.S. DOE estimates 5–20% annual energy savings from structured preventive maintenance programs — savings that are invisible on a maintenance budget but significant on a utilities line item that no FM team directly controls.
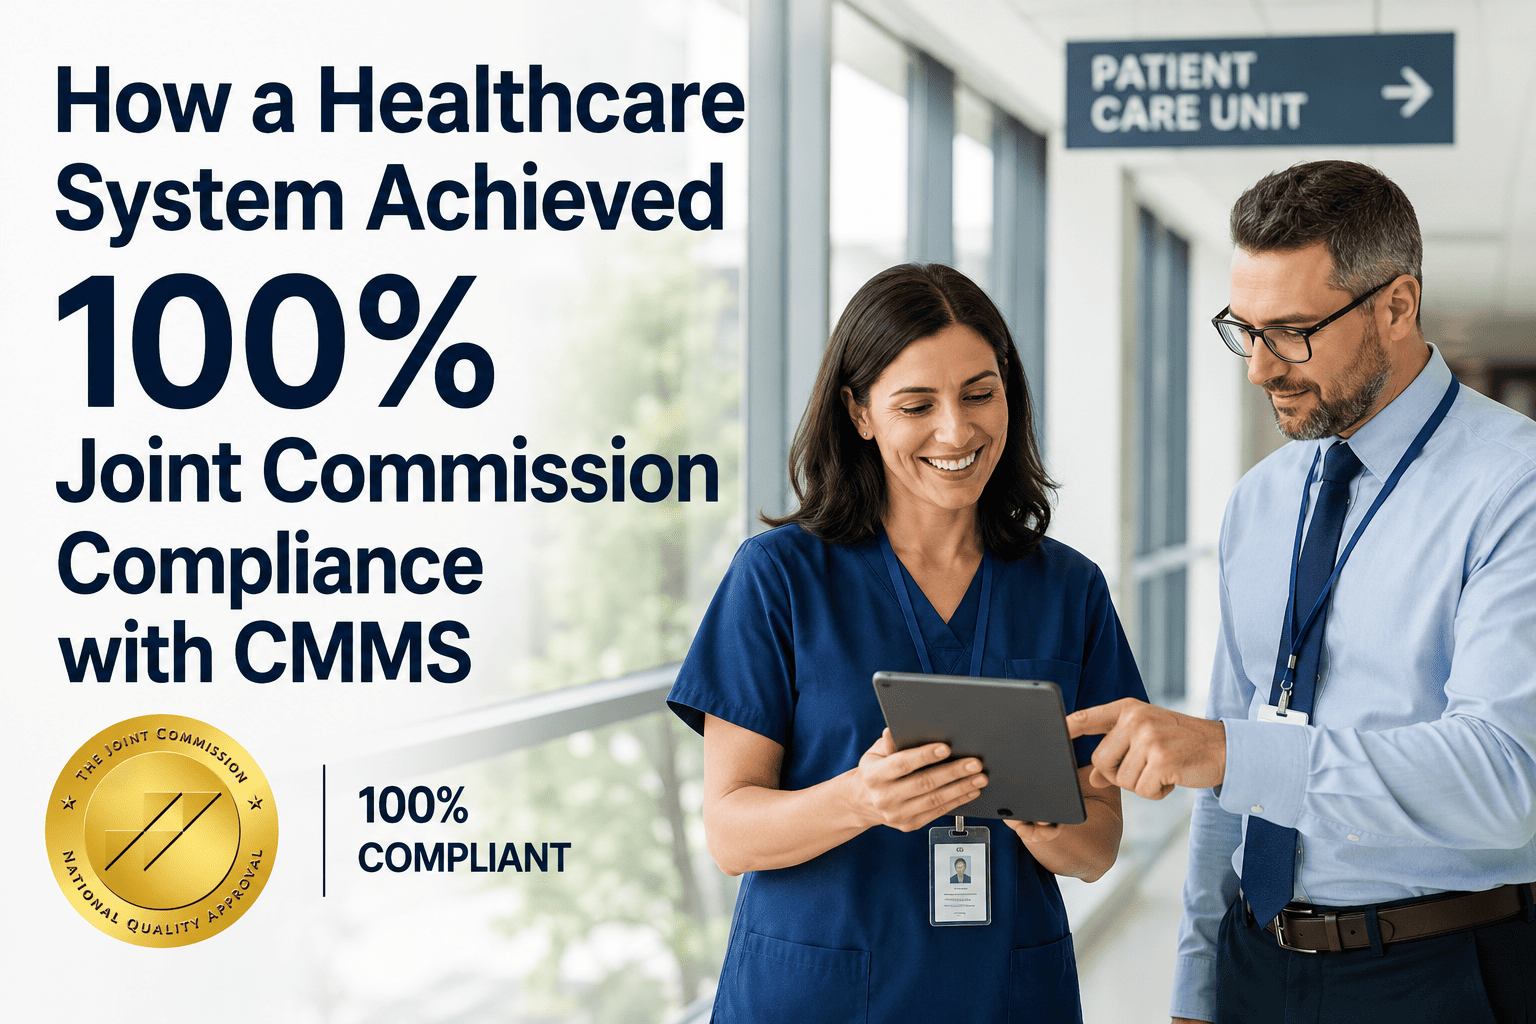
Compliance audits — whether ISO, Joint Commission, OSHA, or tenant SLA reviews — require documented proof of maintenance completion. Without CMMS, that documentation is assembled manually from paper logs and spreadsheets at a cost of 2–3 days per audit cycle. Compliance failures carry financial penalties, insurance premium increases, and in regulated industries, operating license risk.
CMMS ROI Benchmarks — What Facilities Like Yours Typically Recover
| Facility Type | Typical Size | Annual Maint. Spend | Reactive Work Rate | Year 1 Savings | Payback Period |
|---|---|---|---|---|---|
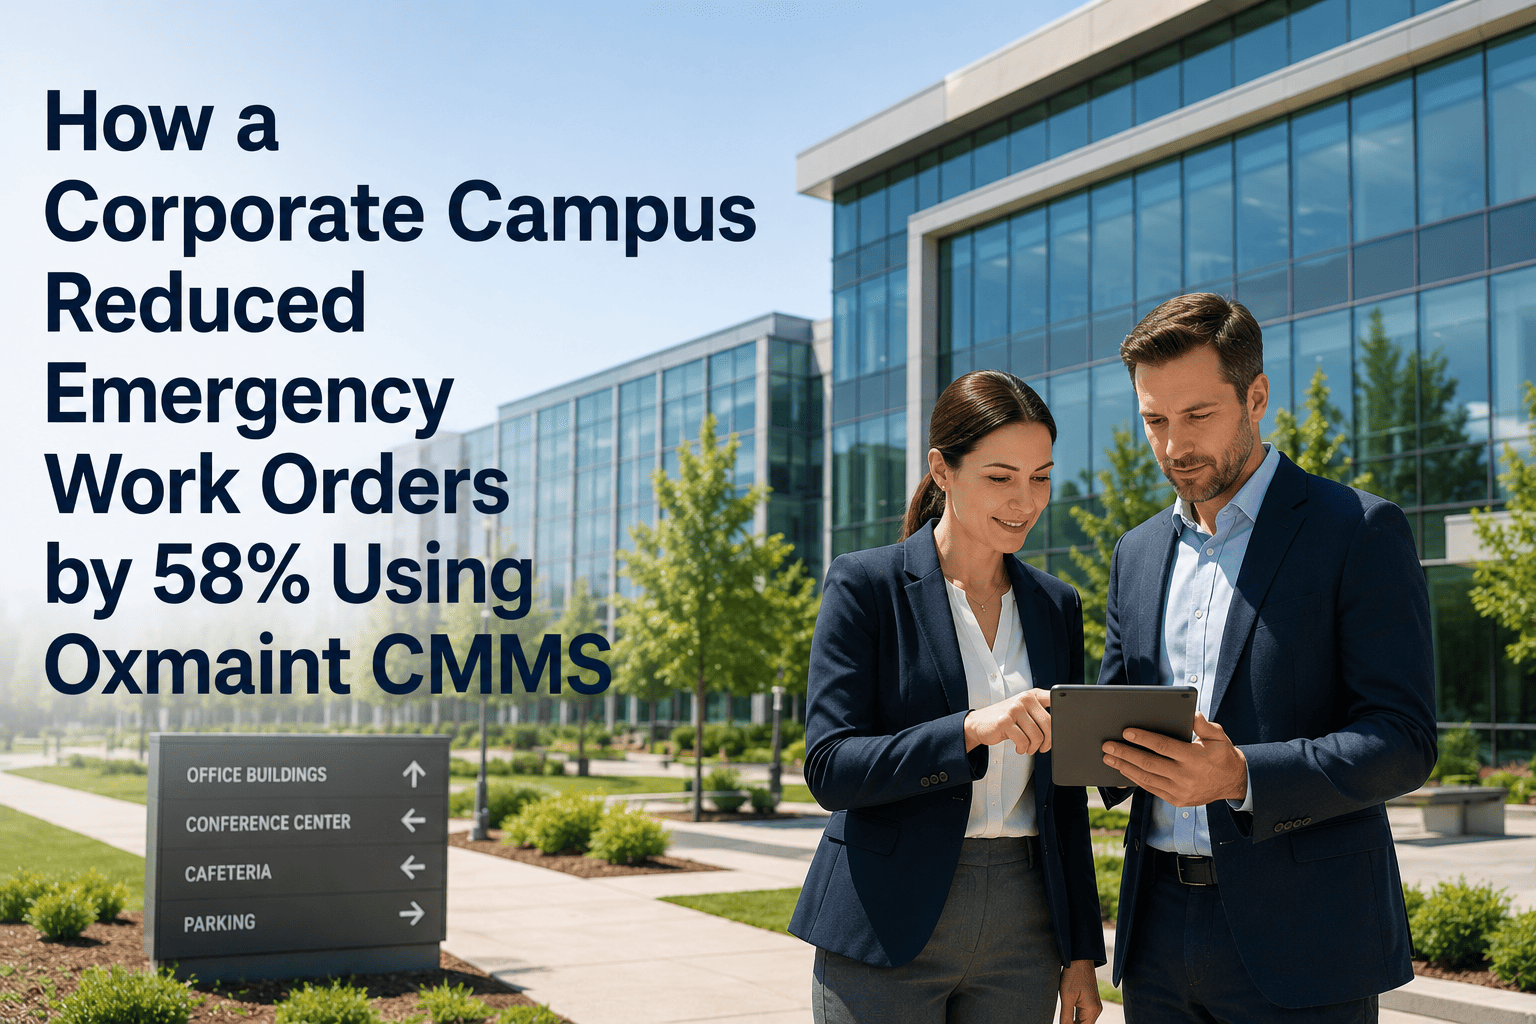
| Corporate Campus | 400K–800K sqft | $900K–$1.8M | 35–45% | $240K–$320K | 6–8 months |
| Healthcare System | Multi-facility | $2M–$6M | 30–40% | $480K–$900K | 4–7 months |
| University Campus | 1M–5M sqft | $3M–$12M | 40–55% | $600K–$1.8M | 5–9 months |
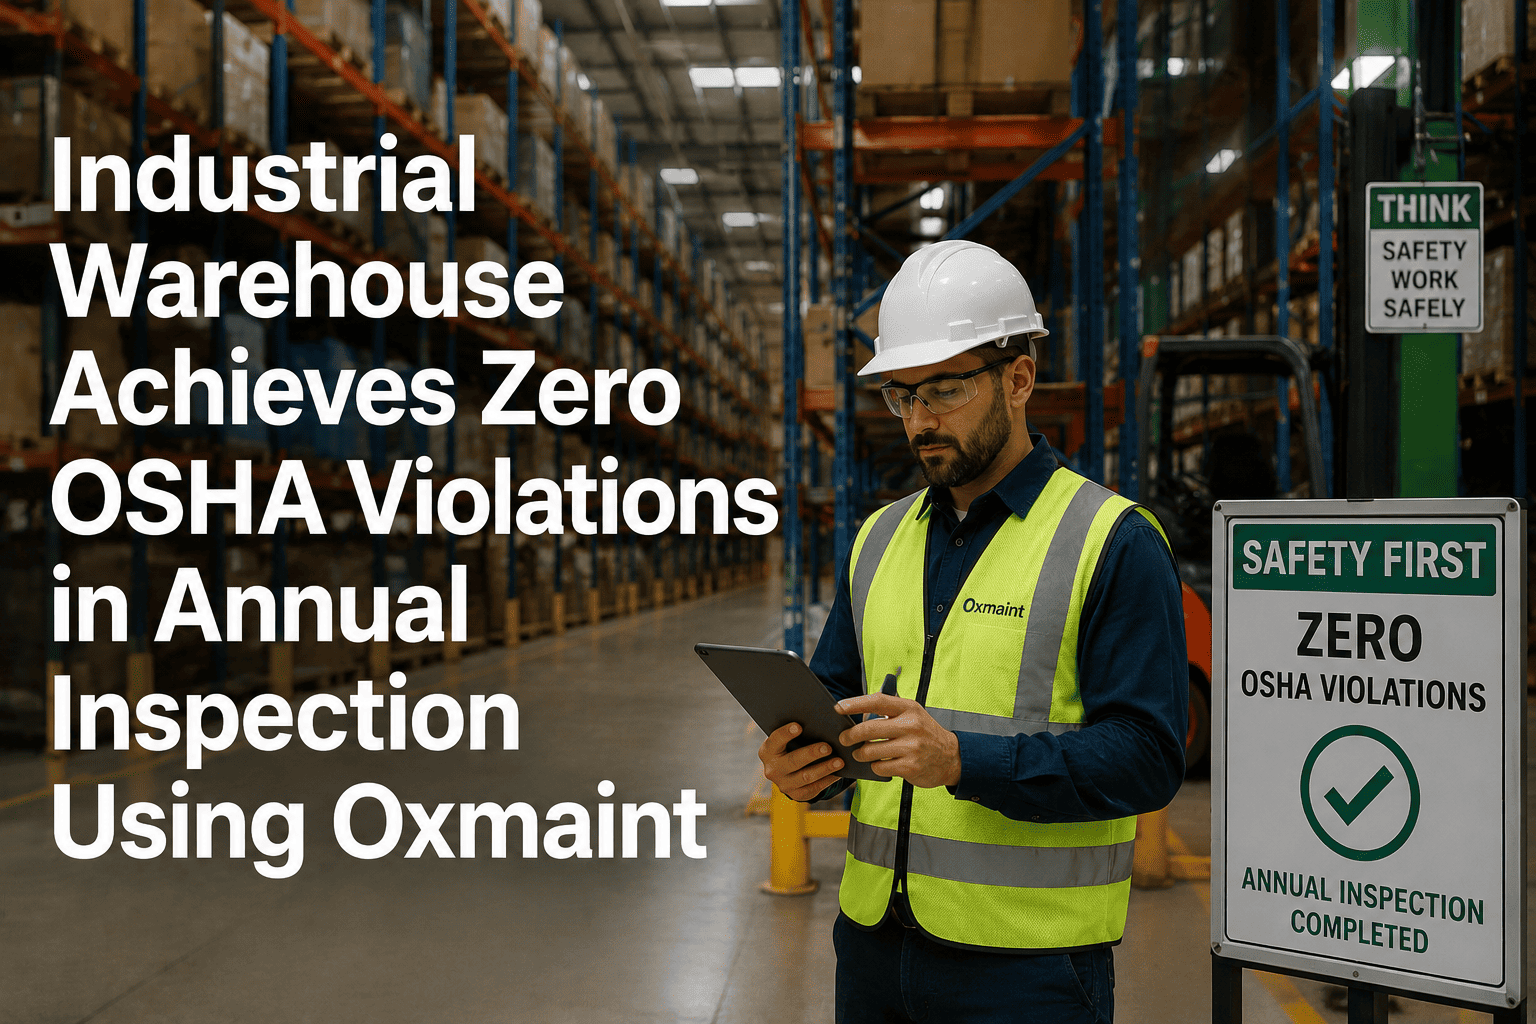
| Industrial Warehouse | 200K–1M sqft | $400K–$2M | 38–50% | $90K–$380K | 7–10 months |
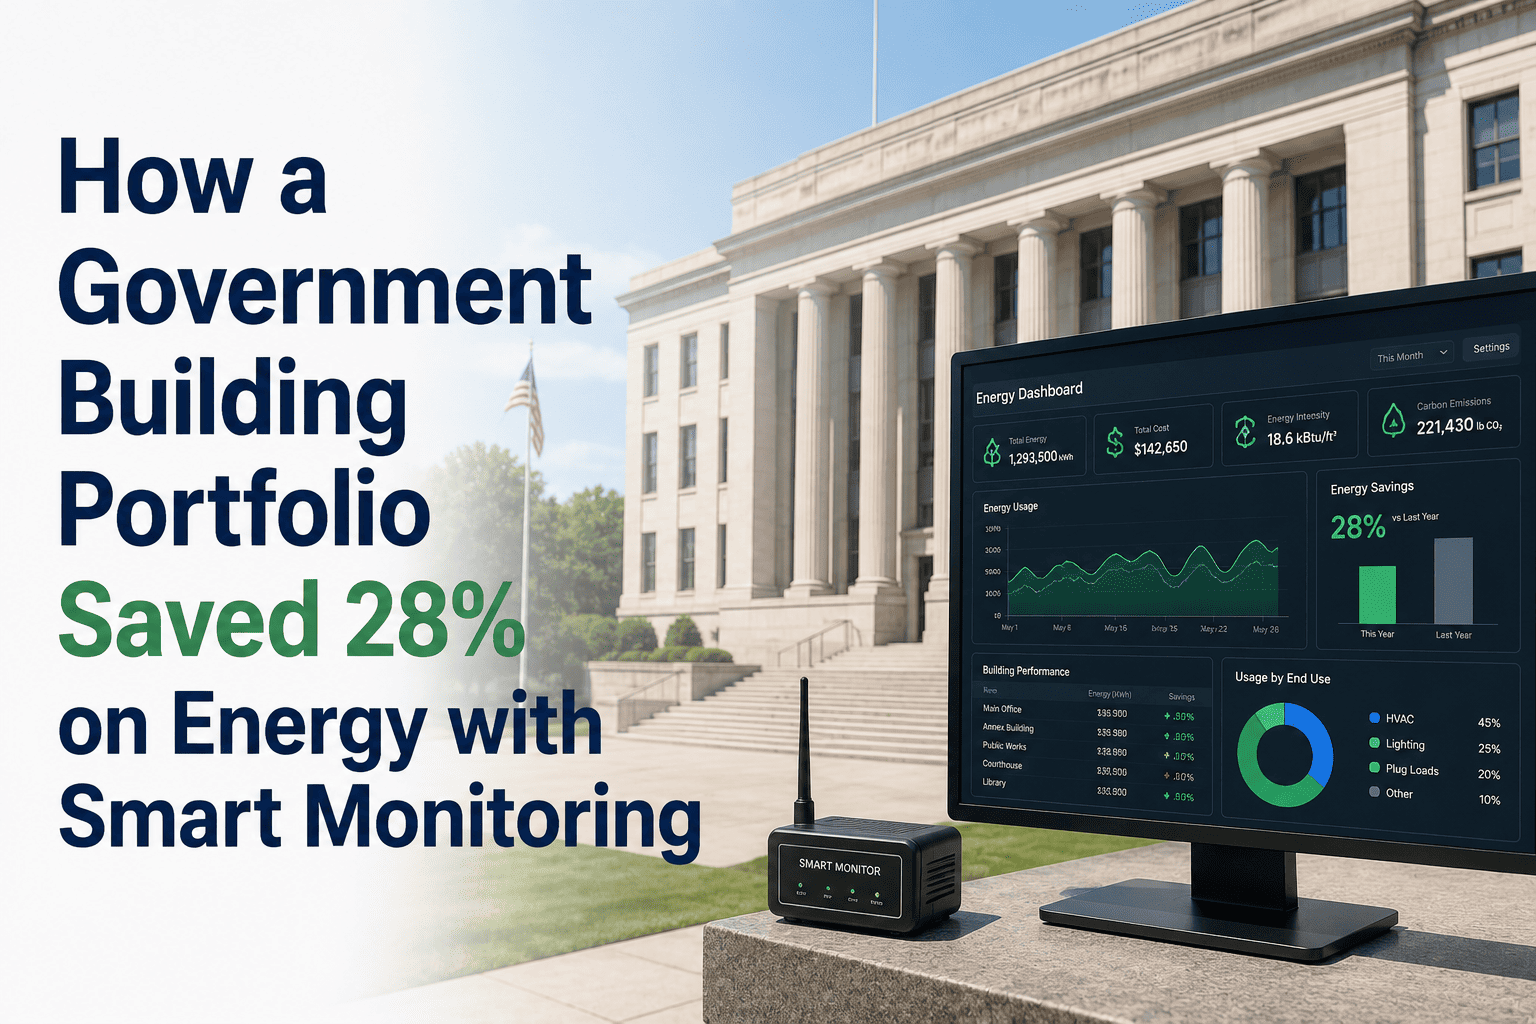
| Government Portfolio | 20–100 buildings | $1.5M–$8M | 35–48% | $320K–$1.2M | 5–8 months |
| Commercial High-Rise | 300K–600K sqft | $600K–$1.4M | 30–42% | $140K–$260K | 6–9 months |
Estimates based on Oxmaint customer outcomes data and IFMA maintenance cost benchmarks. Actual results vary by team size, starting PM compliance rate, and asset mix.
How to Calculate Your Facility's CMMS ROI in Four Steps
Take your total annual maintenance spend. Multiply by your reactive work percentage. Multiply that figure by 3.5 (the industry average reactive repair cost multiplier versus planned work). That is your annual reactive premium. Oxmaint customers typically reduce reactive ratio from 38–45% down to 15–20% within 12 months — recovering 50–60% of that premium in year one.
Count the hours your supervisors and managers spend each week compiling maintenance reports, preparing audit documentation, and updating spreadsheets. Multiply by your loaded labor rate. This is a direct, fully recoverable cost — CMMS auto-generates every report from normal workflow data with zero additional labor from your team.
Take your annual energy spend attributable to HVAC and mechanical equipment. Multiply by 10% (conservative DOE estimate for structured PM improvement). For a facility spending $800,000/year on energy, that is $80,000 in recoverable savings — without any capital investment in new equipment or building systems.
Equipment maintained at proper PM compliance intervals lasts 20–40% longer than reactively maintained assets. Take your annual capital replacement budget for HVAC, mechanical, and electrical assets. A 25% reduction in replacement frequency — achievable at 85%+ PM compliance — defers significant CapEx spend that your finance team can quantify against the CMMS subscription cost directly.
Our team builds a specific ROI projection for your building type, team size, and current maintenance program in 30 minutes. No spreadsheets, no estimates — real numbers based on your facility profile and Oxmaint customer outcome data.
What Financial Leaders Say About CMMS ROI
The CMMS ROI conversation fails in most budget cycles because facility managers present it as a technology investment rather than a cost reduction program. The reframe that works with CFOs is this: your facility is currently paying a 3.5x premium on every reactive repair. That premium is not in the CMMS line item of your budget — it is buried in overtime, emergency contractor invoices, and expedited parts charges spread across twelve months of maintenance spend. A CMMS does not add cost to your budget. It eliminates the hidden cost you are already paying. When I model CMMS ROI for property portfolios, the reactive repair premium reduction alone — moving from 40% reactive to under 20% — consistently produces a 6–9 month payback. The energy savings, labor recovery, and compliance cost avoidance are all incremental to that primary driver. The facilities teams that struggle to get CMMS approved are the ones presenting the subscription fee without the offset. Present the offset first. The subscription fee becomes a rounding error in the context of the waste it eliminates.
Frequently Asked Questions
How quickly do Oxmaint customers typically see measurable ROI?
Most Oxmaint customers report measurable ROI within the first 90 days — primarily from three sources: elimination of manual reporting time (immediate on go-live), reduction in emergency callout costs as PM compliance begins improving, and faster MTTR as technicians access asset history on mobile before every job. Full payback on annual subscription cost occurs at 6–9 months for most facility types. At 12 months, the average customer reports 28–35% lower total maintenance cost per square foot. Book a demo to see a ROI projection for your specific facility profile.
What data do I need to build a CMMS ROI business case for my CFO?
The minimum data set for a compelling CMMS business case is: total annual maintenance spend, current reactive work percentage, number of maintenance staff and their loaded labor rates, annual energy spend on mechanical and HVAC systems, and hours per week spent on manual reporting and compliance documentation. With these six inputs, Oxmaint's team can produce a facility-specific ROI model showing year 1 savings by category, payback period, and 3-year net value. Start a free trial and track your current baseline metrics from day one.
Does the ROI calculation include asset life extension benefits?
Yes — and for many facilities, CapEx deferral is the largest single ROI component, though it is the least visible in annual budget terms. Equipment maintained at 85%+ PM compliance consistently demonstrates 20–40% longer service life than reactively maintained assets. For a facility with $500,000 in annual equipment replacement budgets, a 25% reduction in replacement frequency represents $125,000 per year in deferred CapEx — a benefit that compounds across the asset lifecycle. Book a session to model CapEx deferral benefits for your asset portfolio.
How does Oxmaint's ROI compare to other CMMS platforms?
Oxmaint delivers ROI faster than enterprise CMMS platforms because deployment takes weeks rather than months and technician adoption rates average 90% within 30 days — compared to 6–18 month enterprise implementation timelines where ROI realization is delayed by deployment complexity. Oxmaint's pricing is also structured as a fraction of enterprise CMMS annual fees, meaning the payback calculation starts from a lower denominator. Independent facility management surveys consistently rank Oxmaint in the top tier for time-to-value among CMMS platforms available to mid-market and enterprise facility teams. Start free today — no implementation timeline, no professional services fees.
Book a 30-minute session with our facility ROI team. We build your custom savings projection using Oxmaint customer outcome data and your facility's actual maintenance profile — so you walk in to your CFO's office with real numbers, not estimates.