Energy costs consume 30-50% of a typical campus operating budget — and most of that waste is invisible. HVAC systems do not fail overnight. They degrade gradually: refrigerant levels drop 2% per year, coil fouling increases energy draw by 15-25%, and belt slippage adds 8-12% to fan motor consumption. By the time a building occupant complains about temperature, the system has been wasting energy for months. Universities and school districts that deploy predictive CMMS maintenance through platforms like OxMaint are documenting 18-32% reductions in energy spend within the first year — not by replacing equipment, but by catching the degradation patterns that silently inflate utility bills. When a 500-ton chiller runs at 78% efficiency instead of 95% because nobody tracked condenser fouling, the campus is burning $40,000-$80,000 per year in excess electricity on that single asset alone.
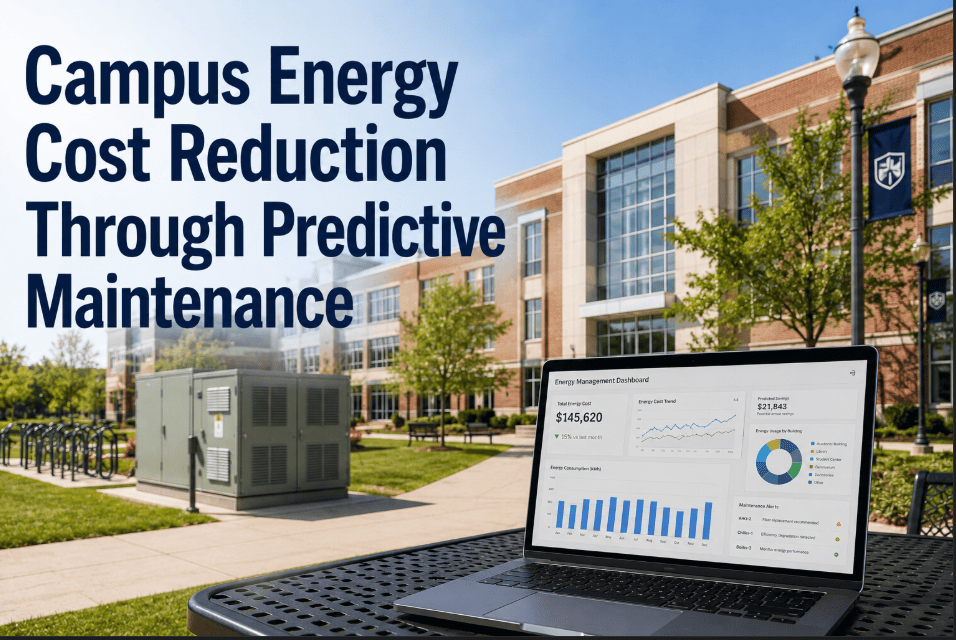
Campus Energy Cost Reduction Through Predictive Maintenance
How predictive CMMS maintenance prevents HVAC degradation, eliminates invisible energy waste, and delivers measurable utility cost reductions across multi-building campus portfolios — without capital equipment replacement.
The Invisible Energy Drain: How HVAC Degradation Inflates Campus Utility Bills
Energy waste on campus is rarely caused by catastrophic equipment failure. It is caused by the slow, steady decline in system performance that nobody measures. Each degradation pattern below adds cost every single day it goes undetected — and none of them trigger a comfort complaint until they are severe. This is why reactive maintenance strategies are fundamentally incompatible with energy cost control.
Dirty evaporator and condenser coils force compressors to work harder. A 1/16-inch layer of grime on condenser coils increases energy consumption by 21%. Most campuses clean coils annually — degradation begins within 60 days of cleaning.
Worn fan belts slip under load, reducing airflow while the motor draws the same power. The building gets less cooling per kilowatt consumed. Belt tension should be checked every 90 days — most campuses check at failure.
Refrigerant systems lose 2-5% charge annually through micro-leaks. A 10% undercharge reduces cooling capacity by 20% while increasing compressor energy use by 10-18%. The system runs longer to achieve the same setpoint — silently inflating bills.
Clogged air filters increase static pressure across air handling units, forcing fan motors to consume more energy to move the same volume of air. Filter replacement intervals based on calendar schedules miss building-specific dust loads — sensor-triggered replacement saves 5-15% fan energy.
Stuck or improperly calibrated economizer dampers prevent free cooling when outdoor conditions allow it. A malfunctioning economizer on a 100-ton rooftop unit can waste $8,000-$15,000 annually in unnecessary compressor runtime — and 90% of economizer failures are undetected for 6+ months.
Failed-open steam traps on campus heating systems waste 25-50 lbs/hr of steam per trap. A campus with 200 steam traps and a 15% failure rate wastes the equivalent of $30,000-$60,000 annually in fuel costs. Most campuses survey traps once per year — failures happen year-round.
Every one of these degradation patterns is detectable with structured preventive maintenance schedules and condition monitoring. The question is not whether your campus has them — it does. The question is whether your maintenance system catches them before they accumulate into a six-figure energy waste problem. Want to see how OxMaint identifies and prevents these patterns across your campus? Start a free trial or book a demo to see the energy impact dashboard.
Reactive vs Predictive Maintenance: The Energy Cost Impact
The difference between reactive and predictive maintenance is not just about equipment uptime — it is about the thousands of dollars in wasted energy that accumulate during every month of undetected degradation. This comparison shows the real financial gap across key campus HVAC operations.
| Energy Factor | Reactive Maintenance Campus | Predictive CMMS Campus (OxMaint) |
|---|---|---|
| Chiller Efficiency (kW/ton) | 0.85-1.10 kW/ton (degraded) | 0.55-0.65 kW/ton (maintained at design) |
| Annual Energy Cost per Sq Ft | $3.20-$3.80 | $2.10-$2.60 |
| Economizer Failure Detection | 6-12 months after failure | Flagged within 48 hours via condition alerts |
| Filter Change Timing | Calendar-based (often too late or too early) | Pressure differential triggers — right on time |
| Coil Cleaning Frequency | Annually (degradation starts at 60 days) | Condition-scored quarterly with photo verification |
| Refrigerant Leak Response | Detected at comfort complaint (months of waste) | Superheat/subcooling trends flagged at 5% deviation |
How OxMaint Delivers Measurable Energy Savings
OxMaint does not just schedule maintenance — it connects maintenance actions directly to energy performance outcomes. Every PM task, condition score, and work order contributes to a data system that makes energy waste visible, traceable, and preventable. Here is how each capability translates to lower utility bills across your campus buildings. See it in action — book a demo or start a free trial today.
OxMaint triggers maintenance based on actual equipment condition — filter pressure drop, coil fouling scores, vibration trends — not arbitrary calendar intervals. This means coils get cleaned when they need it (saving 15-25% energy draw), not once a year when half the savings window has already passed.
Every HVAC asset receives a condition score updated with each inspection and PM task. Scores trending downward correlate directly to energy efficiency loss. Facility managers see which buildings and which systems are drifting from design efficiency — and intervene before the utility bill reflects the damage.
When a condition threshold is breached — economizer damper stuck, refrigerant charge deviation detected, belt wear measured — OxMaint auto-generates a prioritized work order assigned to the right technician. The gap between detection and repair shrinks from months to hours, stopping energy waste before it accumulates.
Campus facility directors see PM compliance, asset condition scores, and open deficiency work orders across every building from a single dashboard. Identify which buildings are falling behind on energy-critical maintenance — and redirect resources before the next utility cycle hits.
OxMaint's rolling 5-10 year CapEx models identify HVAC assets approaching end-of-useful-life based on maintenance history, repair cost trends, and condition scores. Replace aging chillers and boilers when the data says their maintenance cost exceeds the energy savings of a new unit — not when they catastrophically fail mid-semester.
Connect building automation system data — discharge air temps, compressor amps, chilled water delta-T — directly into OxMaint. Anomalies trigger condition-based work orders automatically. A chiller drawing 12% more amps than baseline gets flagged before the energy bill arrives, not after.
Energy Savings Timeline: What to Expect
Energy cost reduction through predictive maintenance is not a multi-year waiting game. The biggest savings come from catching existing degradation in your current equipment — problems that have been silently inflating bills for months or years. Here is a realistic timeline based on campus CMMS implementations.
Asset registry built. First round of condition-based inspections identifies existing degradation — fouled coils, stuck economizers, failed steam traps. Immediate repairs capture low-hanging energy savings that have been bleeding money for months.
Preventive maintenance schedules running at 90%+ compliance. Condition score trends showing which assets are degrading fastest. Refrigerant charge checks, belt inspections, and filter changes happening on condition triggers instead of calendar guesses.
IoT sensor integration feeding real-time condition data. Anomaly detection catching efficiency deviations within 48 hours. CapEx replacement models identifying which aging equipment to prioritize for maximum energy ROI. Budget variance on energy costs drops below 5%.
Historical maintenance and energy data enables building-by-building benchmarking. Worst-performing buildings receive targeted intervention. Equipment replacement decisions backed by 12+ months of condition and cost data. Energy savings compound as asset condition baselines rise across the portfolio.
Documented ROI: Energy and Maintenance Savings
The financial impact of predictive CMMS maintenance on campus energy costs is documented across universities, K-12 districts, and multi-building educational portfolios. These numbers represent what facility teams achieve when maintenance is connected to energy performance — not treated as a separate function.
Frequently Asked Questions
How do we measure the energy impact of maintenance improvements?
Does this require installing new sensors or IoT hardware?
How does OxMaint handle campuses with hundreds of HVAC assets across multiple buildings?
Can we use CMMS energy data to support sustainability reporting and grant applications?
Your Campus Is Wasting Energy Right Now — The Only Question Is How Much
Every fouled coil, every stuck economizer, every undercharged refrigerant system on your campus is adding dollars to your utility bill today. OxMaint makes that invisible waste visible — and gives your maintenance team the structured workflows to eliminate it. Most campuses identify their first quick-win savings within 30 days of deployment. See what predictive maintenance can save your campus.