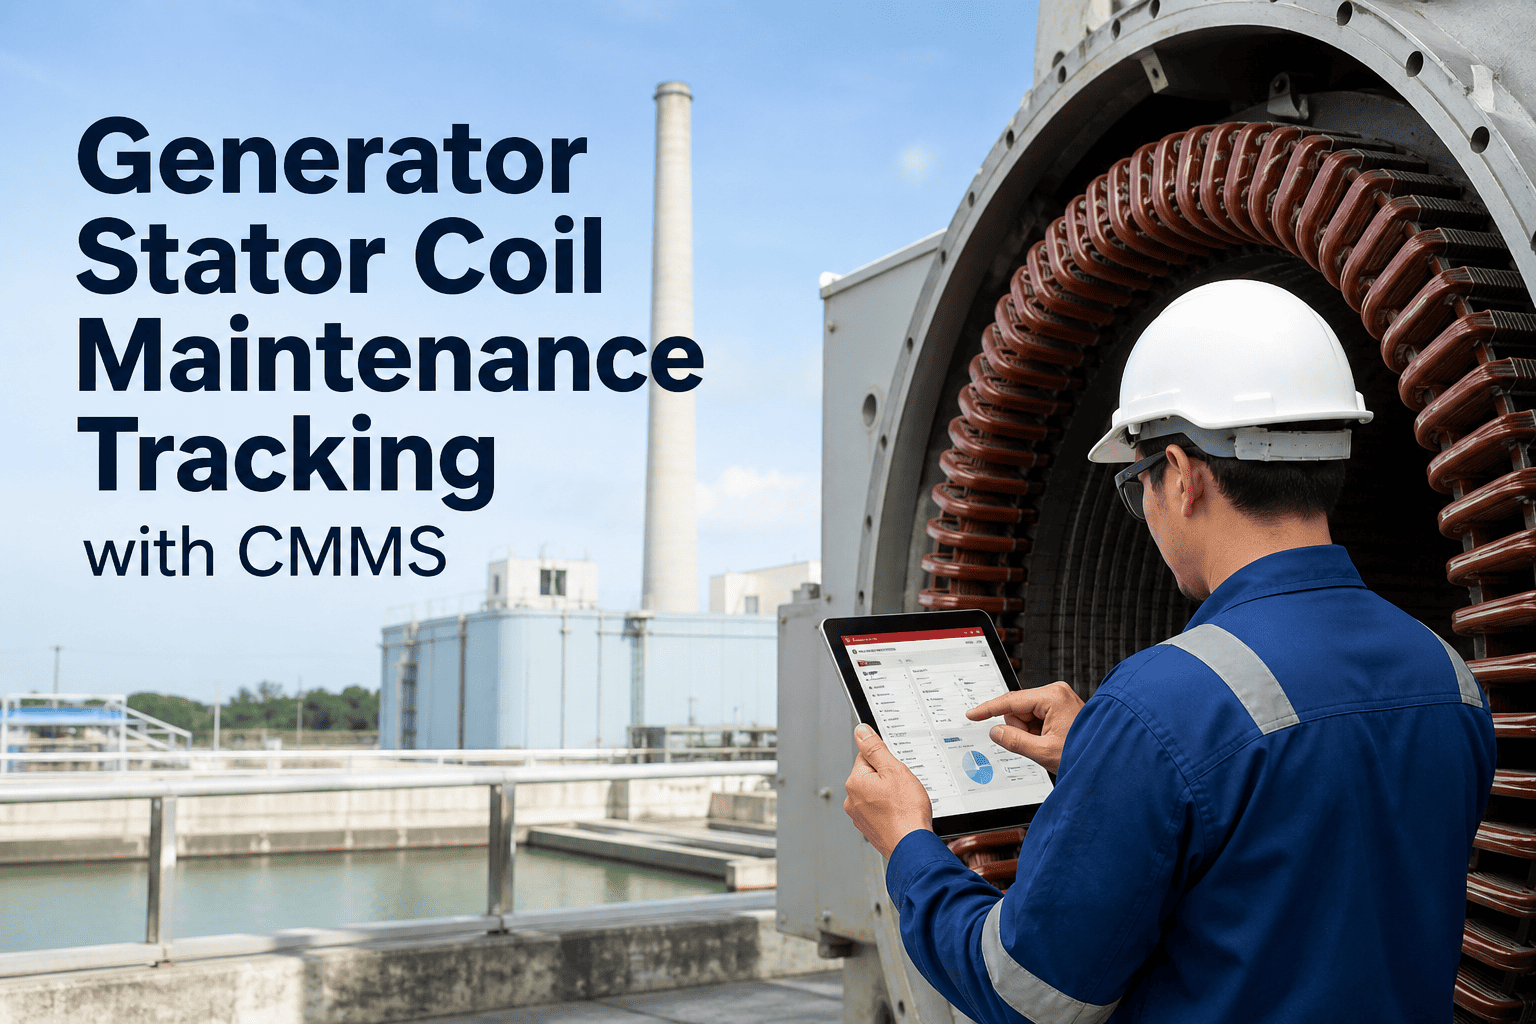
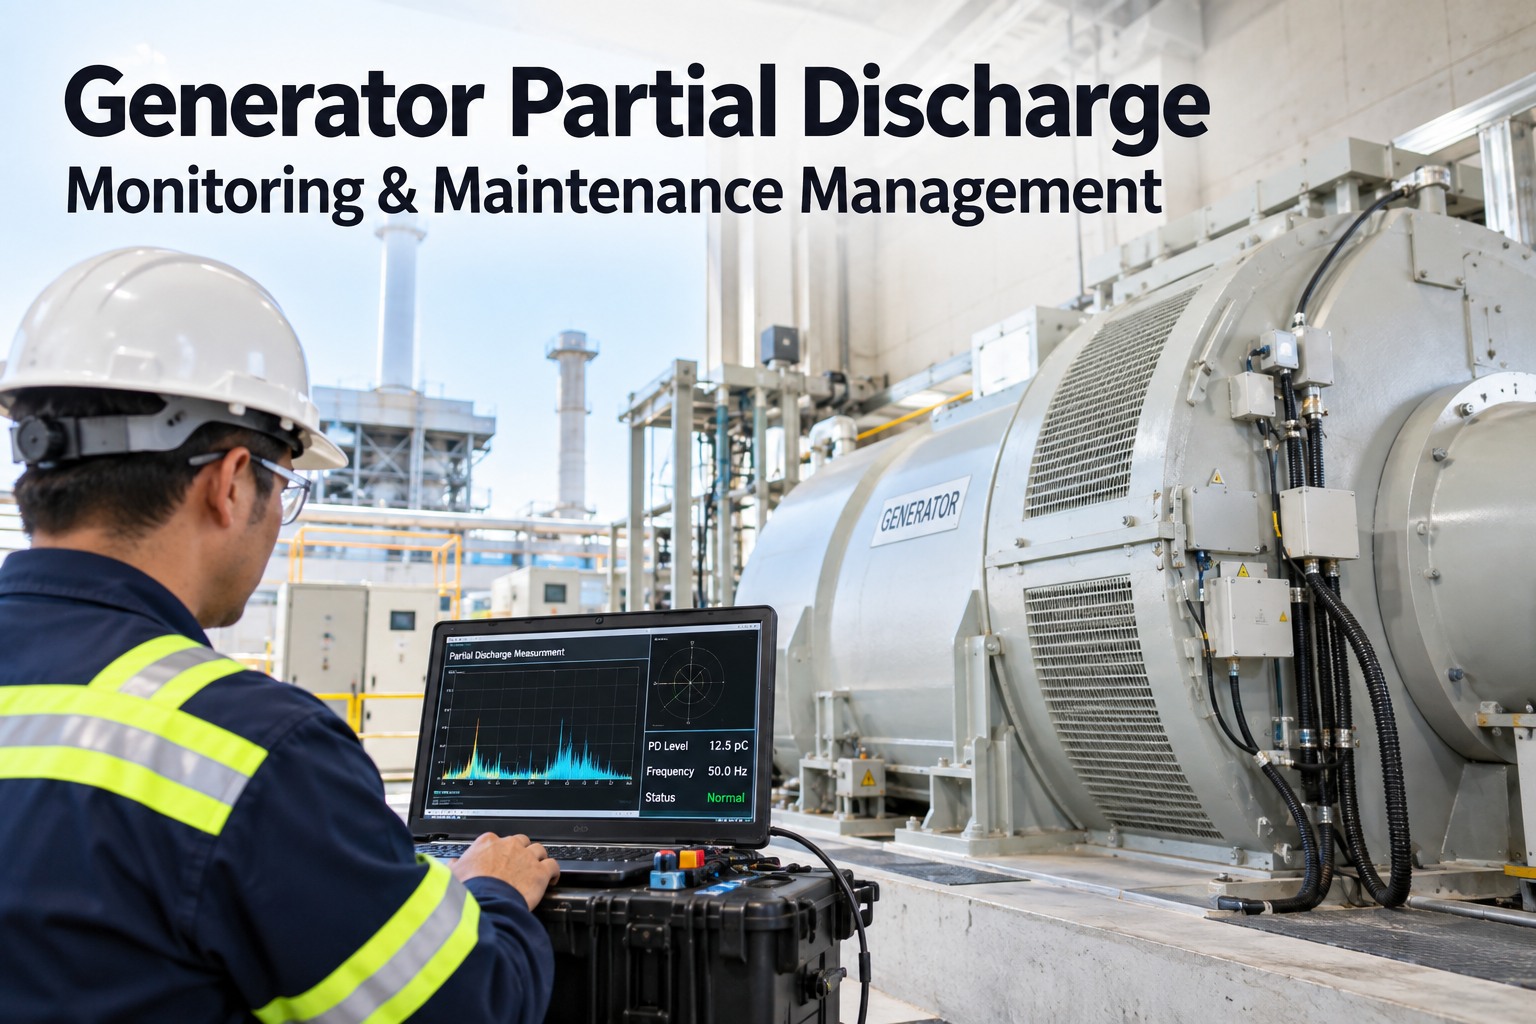
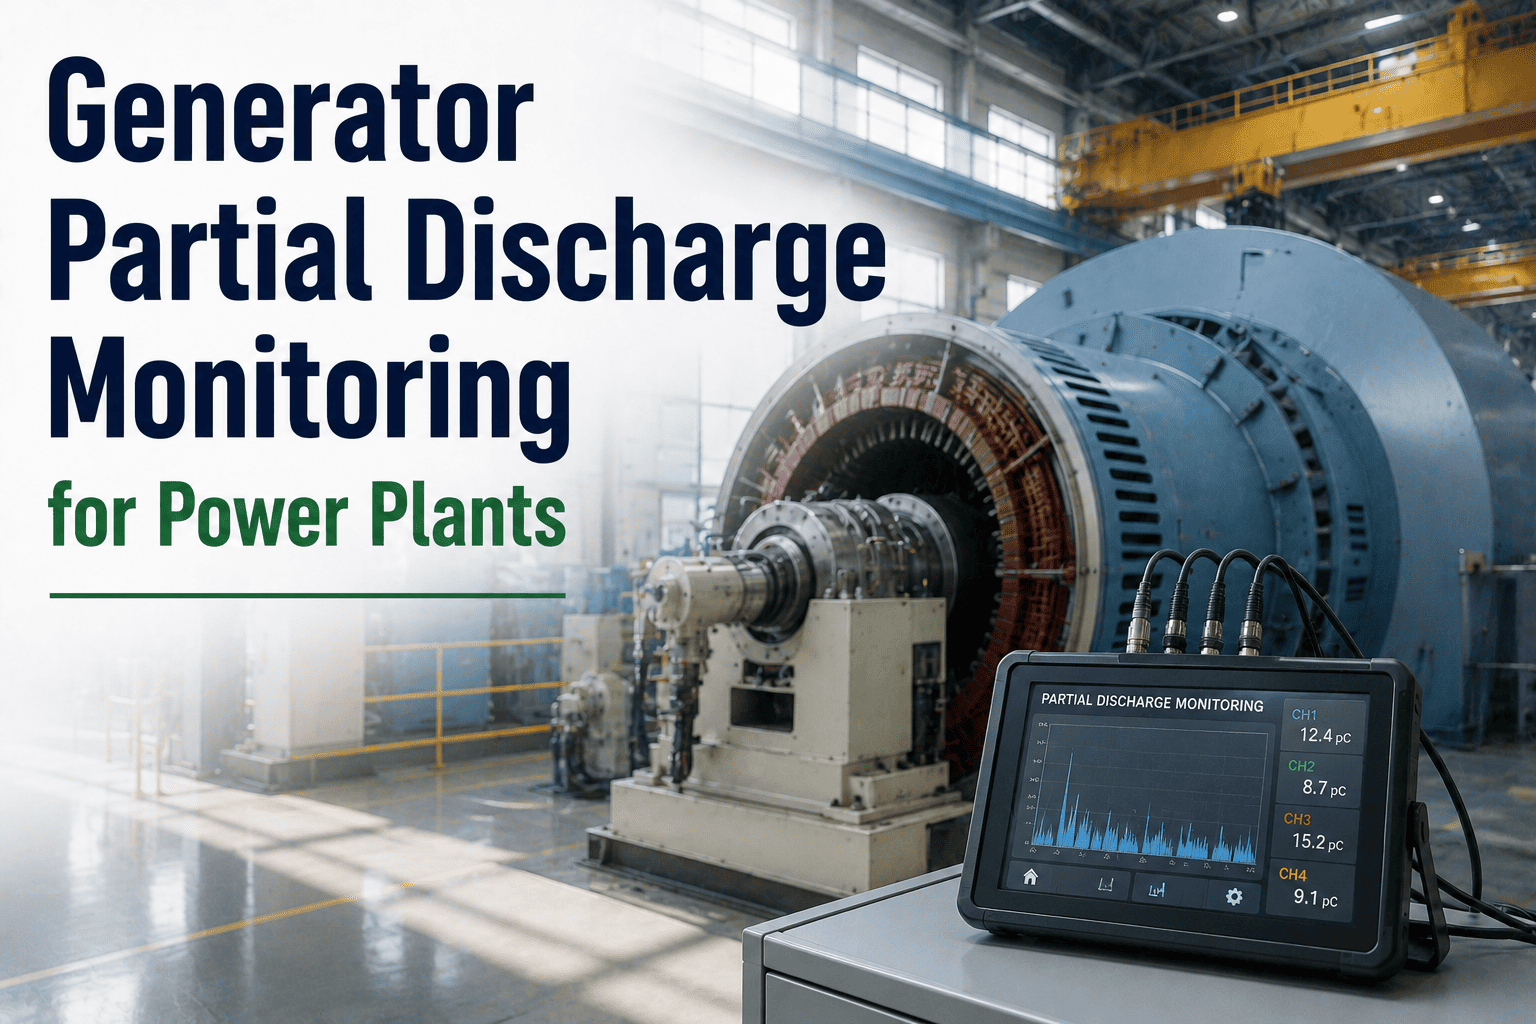
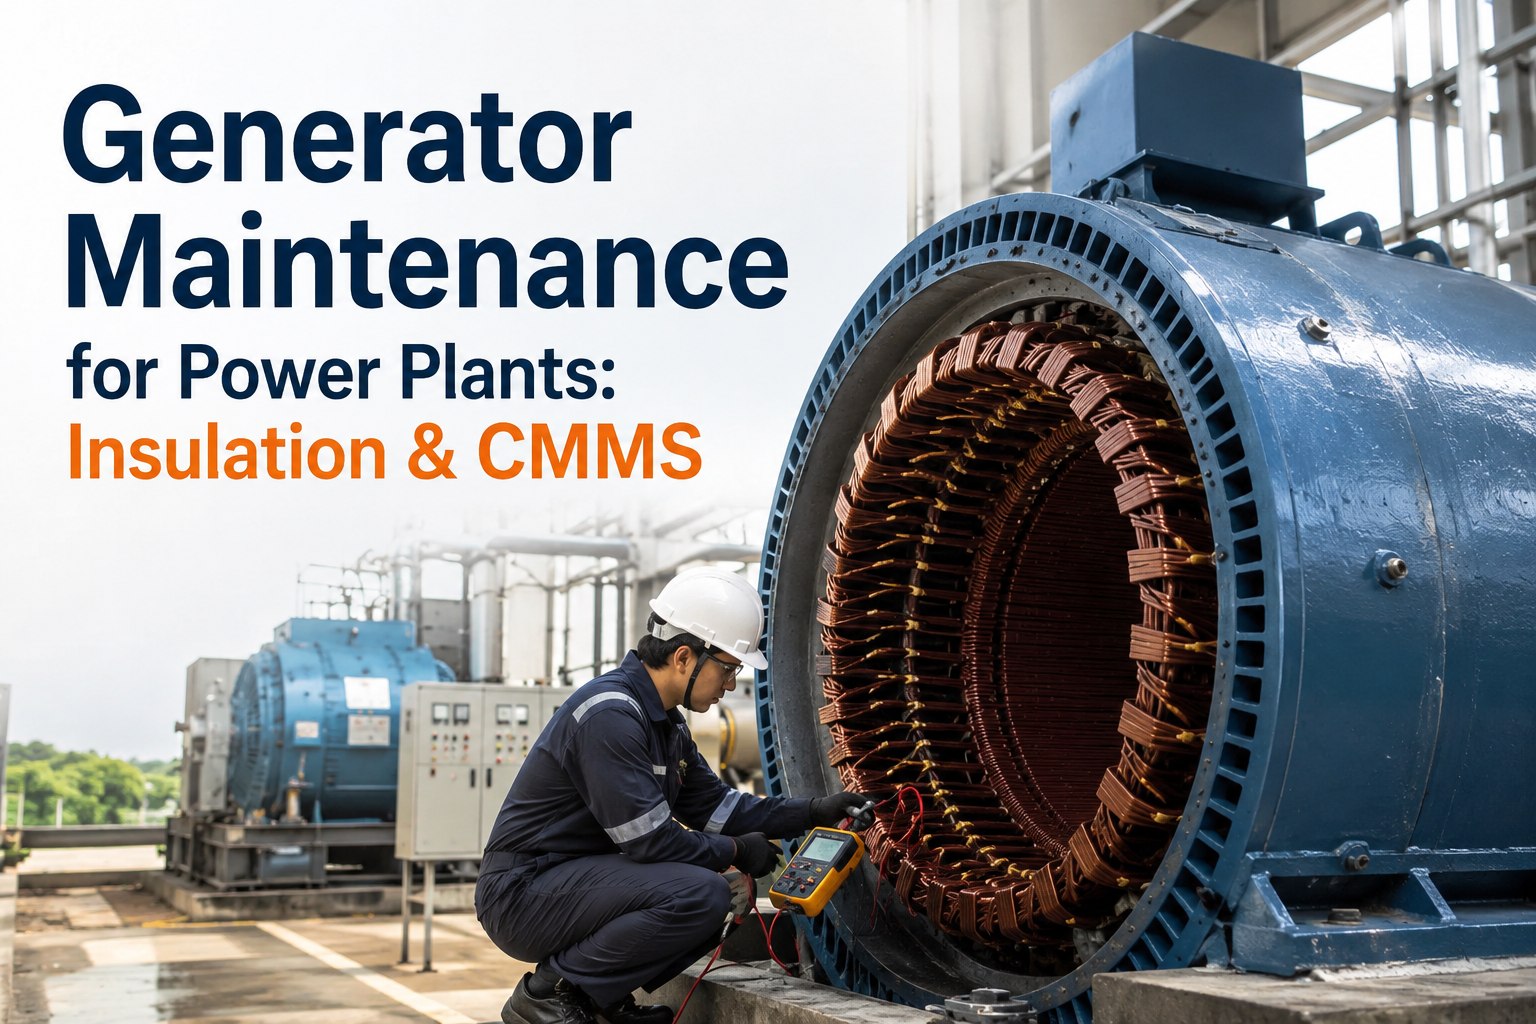
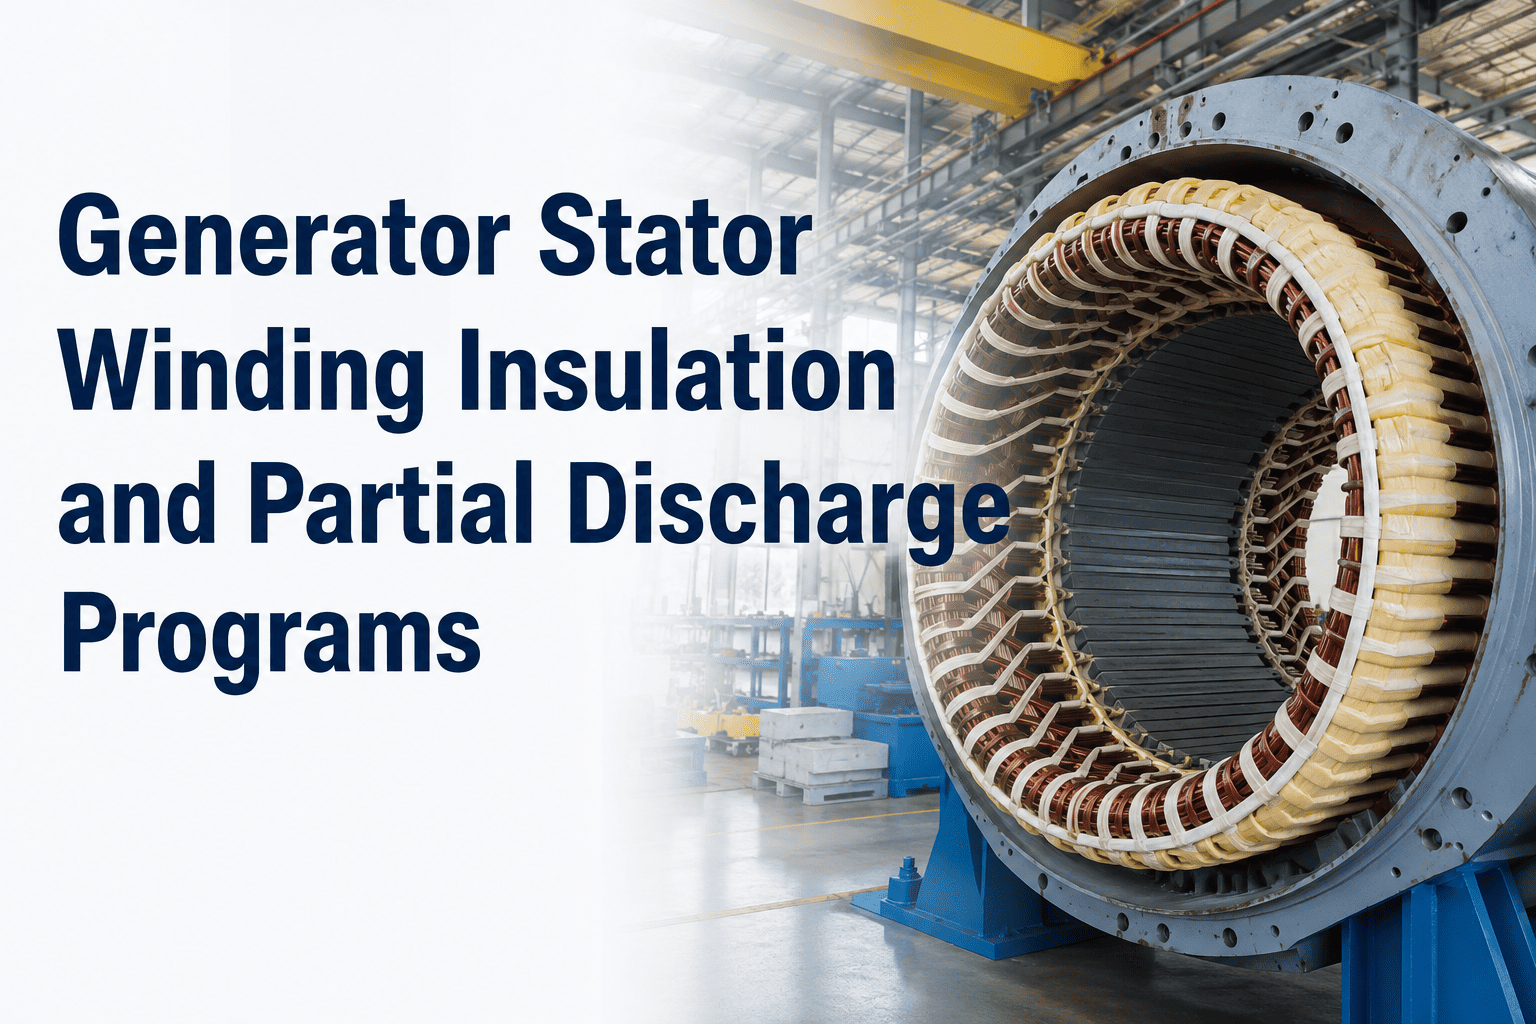
Generator stator windings represent the single most expensive and critical component in power generation assets — a catastrophic insulation failure can destroy a $5 million rotor in seconds, trigger months of forced outage, and cost utilities up to $2 million per day in replacement power purchases. EPRI studies show that 37% of all generator failures originate in stator winding insulation systems, and 80% of these failures could have been detected through systematic electrical testing and trending. OxMaint's CMMS platform transforms stator maintenance from calendar-based inspections into a condition-driven program that tracks insulation resistance trends, partial discharge patterns, and corona activity across the complete asset lifecycle.
Zone 01
Insulation Resistance Testing & Trending
Insulation resistance measurement detects moisture ingress, contamination, and aging degradation before breakdown occurs. Trending shows degradation velocity and predicts when intervention becomes necessary to prevent failure.
Megohm testing performed at rated voltage using calibrated megger with PI and DAR capability — minimum 5000 megohms at 40 degrees Celsius for class F insulation
Electrical Test Technician
•
Insulation resistance certificate
Polarization index calculated as 10 minute resistance divided by 1 minute resistance — PI below 2.0 indicates contamination or moisture requiring investigation
Electrical Test Technician
•
PI calculation record
Temperature correction applied to all readings normalized to 40 degrees Celsius reference temperature — resistance halves for every 10 degree rise
Electrical Engineer
•
Temperature correction log
Historical trend plot generated showing resistance values over past 5 years — declining trend slope indicates active degradation mechanism
Reliability Engineer
•
Resistance trending dashboard
Phase-to-phase balance verified within 10% — significant imbalance between phases suggests localized contamination or winding damage
Electrical Test Technician
•
Phase balance comparison
Core iron resistance measured separately from winding insulation — low core resistance indicates shorted laminations or frame ground faults
Electrical Test Technician
•
Core isolation test report
Test results uploaded to CMMS asset record with test voltage, ambient temperature, humidity, and technician certification attached as supporting documentation
Test Coordinator
•
CMMS data integration
Zone 02
Partial Discharge Testing & Diagnostic Analysis
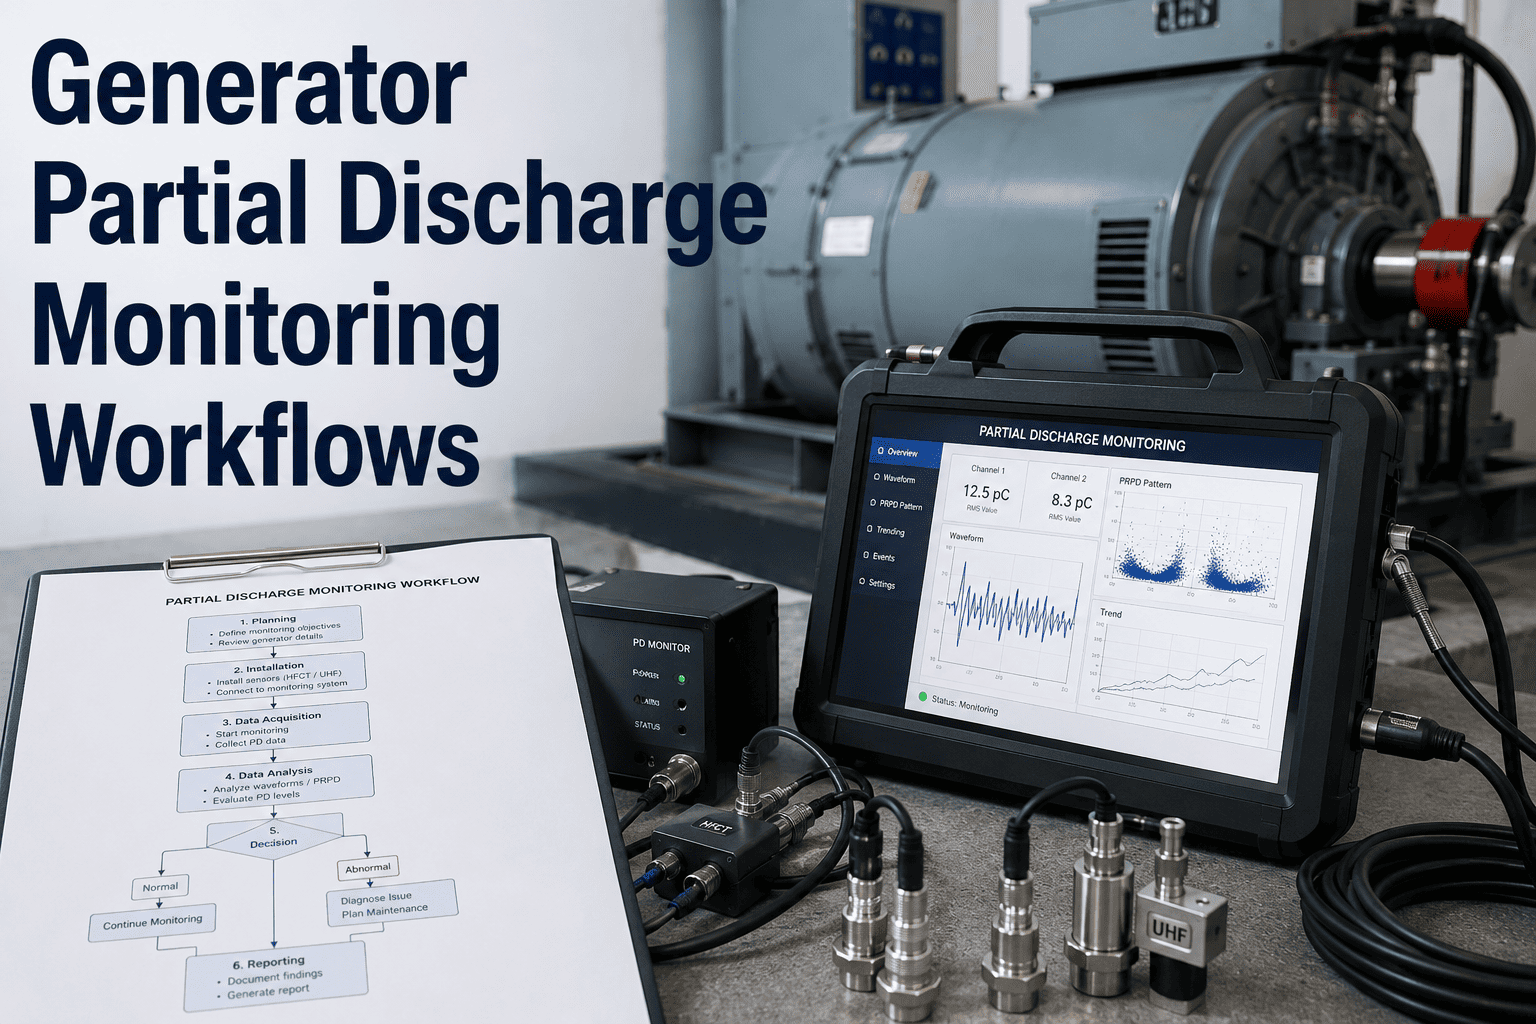
Partial discharge activity indicates localized insulation breakdown creating ionized gas channels that propagate through the winding system. Online and offline PD testing detects deterioration invisible to resistance measurements.
Offline partial discharge testing conducted at 1.5 times rated phase-to-ground voltage using IEC 60270 compliant measurement system with calibrated sensors
PD Test Specialist
•
PD test certificate
Partial discharge magnitude recorded in picocoulombs at inception voltage and extinction voltage — trending upward magnitude indicates active void growth
PD Test Specialist
•
PD magnitude trending
Phase-resolved PD patterns analyzed to distinguish internal voids, slot discharge, and end winding corona — pattern recognition critical for diagnosis
Diagnostic Engineer
•
Pattern classification report
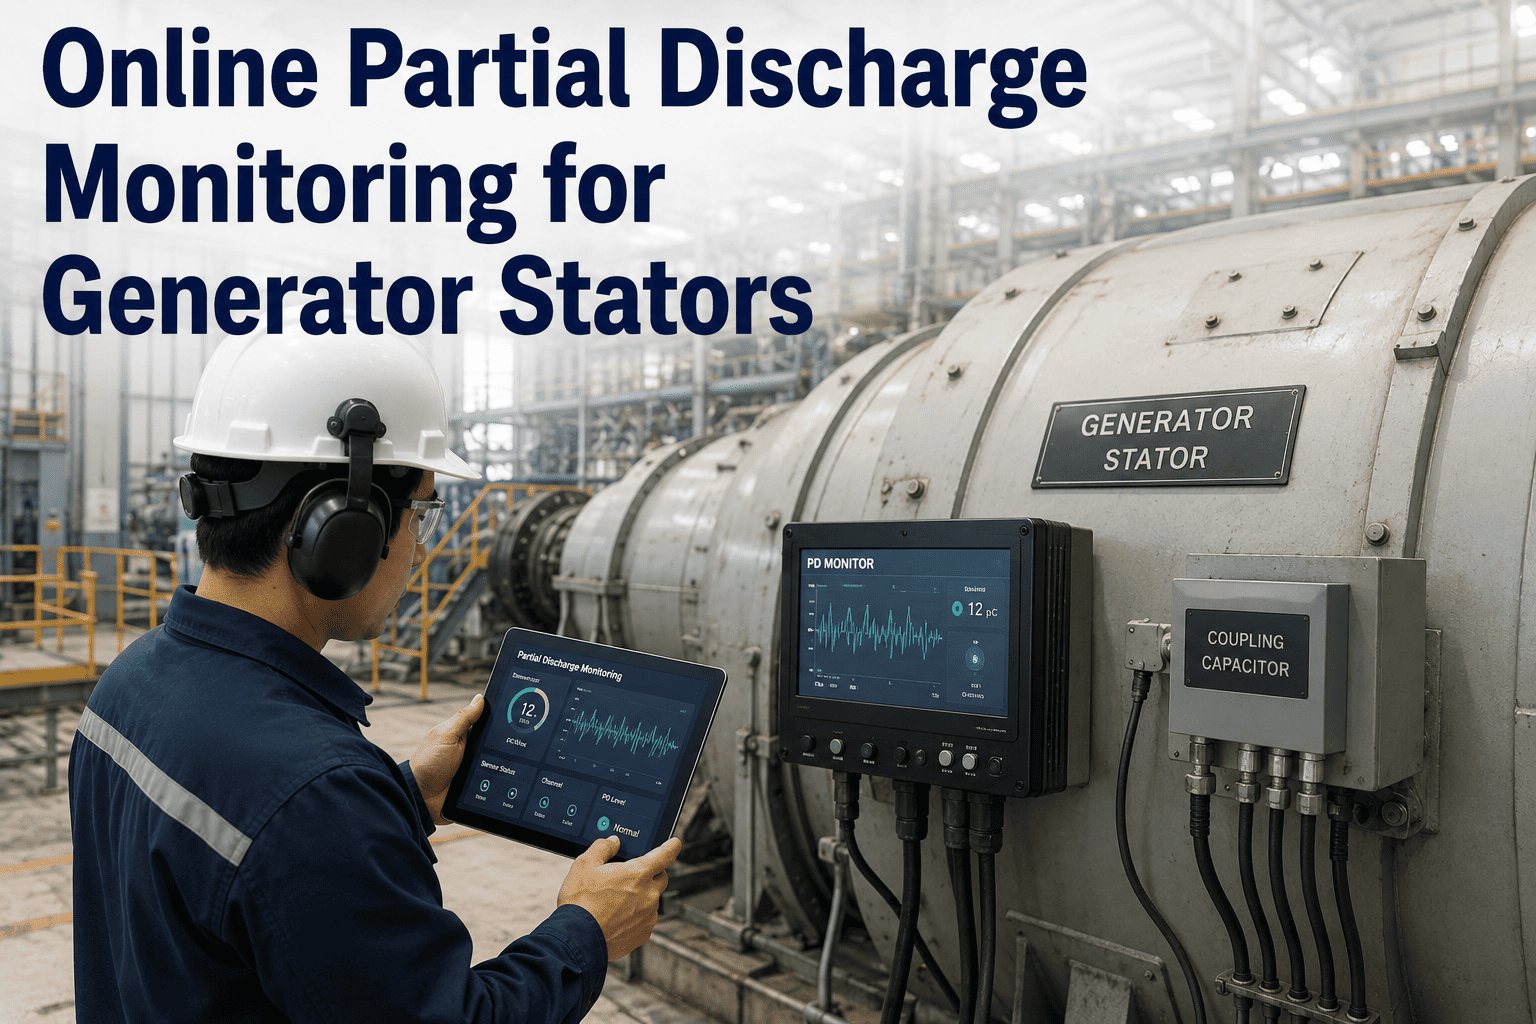
Online PD monitoring sensors permanently installed on operating generators — continuous trending detects sudden changes indicating developing faults
Instrumentation Engineer
•
Online PD system config
Background noise measurements taken before testing to establish baseline and identify external interference sources affecting PD detection sensitivity
PD Test Specialist
•
Noise floor assessment
Comparison against IEEE 1434 acceptance criteria — PD magnitude above 1000 picocoulombs requires immediate diagnostic investigation and risk assessment
Chief Electrical Engineer
•
Acceptance criteria matrix
Historical PD magnitude trend plotted against operating hours and thermal cycles — correlation analysis identifies acceleration factors driving degradation
Reliability Engineer
•
PD progression analysis
Track Every Test Result Against Asset History
OxMaint stores every insulation resistance reading, partial discharge measurement, and diagnostic test result in a unified asset timeline — with automated threshold alerts, multi-year trending graphs, and work order generation when test values drift outside acceptable ranges.
Zone 03
Corona Detection & End Winding Inspection
Corona discharge at end windings erodes stress grading systems and accelerates insulation aging. Visual, acoustic, and chemical detection methods identify corona activity before it causes measurable electrical degradation.
Darkened enclosure visual inspection for corona light emission during offline high potential testing — purple-blue glow indicates active discharge sites
Test Engineer
•
Visual corona inspection
Ultrasonic corona detection performed during operation using directional microphone — acoustic signature triangulates discharge location on end windings
Diagnostic Technician
•
Acoustic survey report
Ozone concentration measured in generator enclosure during operation — elevated ozone above 0.1 ppm confirms active corona discharge activity
Environmental Monitor
•
Gas analysis record
Stress grading coating condition assessed for delamination, cracking, or erosion — damaged coatings create electric field concentrations initiating corona
Inspection Technician
•
Coating condition survey
End winding support blocks inspected for looseness or degradation — vibration-induced movement damages insulation and creates discharge paths
Mechanical Inspector
•
Support structure check
Thermographic imaging during load operation identifies hot spots from localized corona heating — temperature differentials above 10 degrees Celsius warrant investigation
Thermography Technician
•
Thermal imaging analysis
Zone 04
Dissipation Factor & Capacitance Measurement
Power factor tip-up testing reveals insulation aging and moisture absorption invisible to DC resistance measurements. Capacitance changes indicate physical degradation or delamination within the winding structure.
Dissipation factor measured at 0.2 kV and 0.6 kV using precision bridge or tan delta test set — baseline DF below 0.5% indicates healthy insulation
HV Test Engineer
•
Tan delta test certificate
Tip-up value calculated as difference between high voltage and low voltage dissipation factor — tip-up exceeding 0.3% indicates non-linear degradation
HV Test Engineer
•
Tip-up trending report
Capacitance measurement recorded and compared to baseline values — decreasing capacitance suggests delamination or void growth in groundwall insulation
HV Test Engineer
•
Capacitance trend analysis
Phase-to-phase capacitance balance verified within 5% tolerance — significant imbalance indicates asymmetric degradation requiring phase-specific investigation
HV Test Engineer
•
Phase balance verification
Temperature and humidity documented during testing — both parameters significantly affect dissipation factor measurements requiring correction factors
Test Technician
•
Environmental conditions log
Multi-year trending plots generated showing dissipation factor evolution — accelerating degradation rate triggers proactive maintenance planning
Reliability Engineer
•
Long-term degradation model
Zone 05
Vibration Monitoring & Mechanical Integrity
Excessive vibration damages stator coil insulation through cyclic flexing and abrasion. Monitoring vibration amplitude and frequency content detects mechanical degradation before electrical symptoms appear.
Stator core vibration measured at multiple locations during rated load operation — vibration above 5 millimeters per second indicates loose core or winding support
Vibration Analyst
•
Core vibration survey
End winding vibration monitored at 120 Hz and harmonics — excessive amplitude at twice line frequency suggests electromagnetic force imbalance
Vibration Analyst
•
End winding vibration log
Core support wedge tightness verified through impact testing or direct measurement — loose wedges allow core lamination movement damaging insulation
Mechanical Technician
•
Wedge tightness report
Slot ripple spring condition inspected for compression set or cracking — degraded springs allow coil movement abrading slot insulation
Inspection Technician
•
Spring compression check
Core lamination tightness assessed using electromagnetic core imperfection detector — loose laminations create localized heating and vibration
EL CID Specialist
•
EL CID test results
Historical vibration trends correlated with electrical test degradation — simultaneous increases in both parameters confirm mechanical-electrical failure linkage
Diagnostic Engineer
•
Multi-parameter correlation
Zone 06
Thermal Monitoring & Cooling System Verification
Thermal aging is the dominant life-limiting mechanism for stator insulation. Monitoring winding temperature, cooling system performance, and thermal gradient distribution prevents accelerated degradation from overheating.
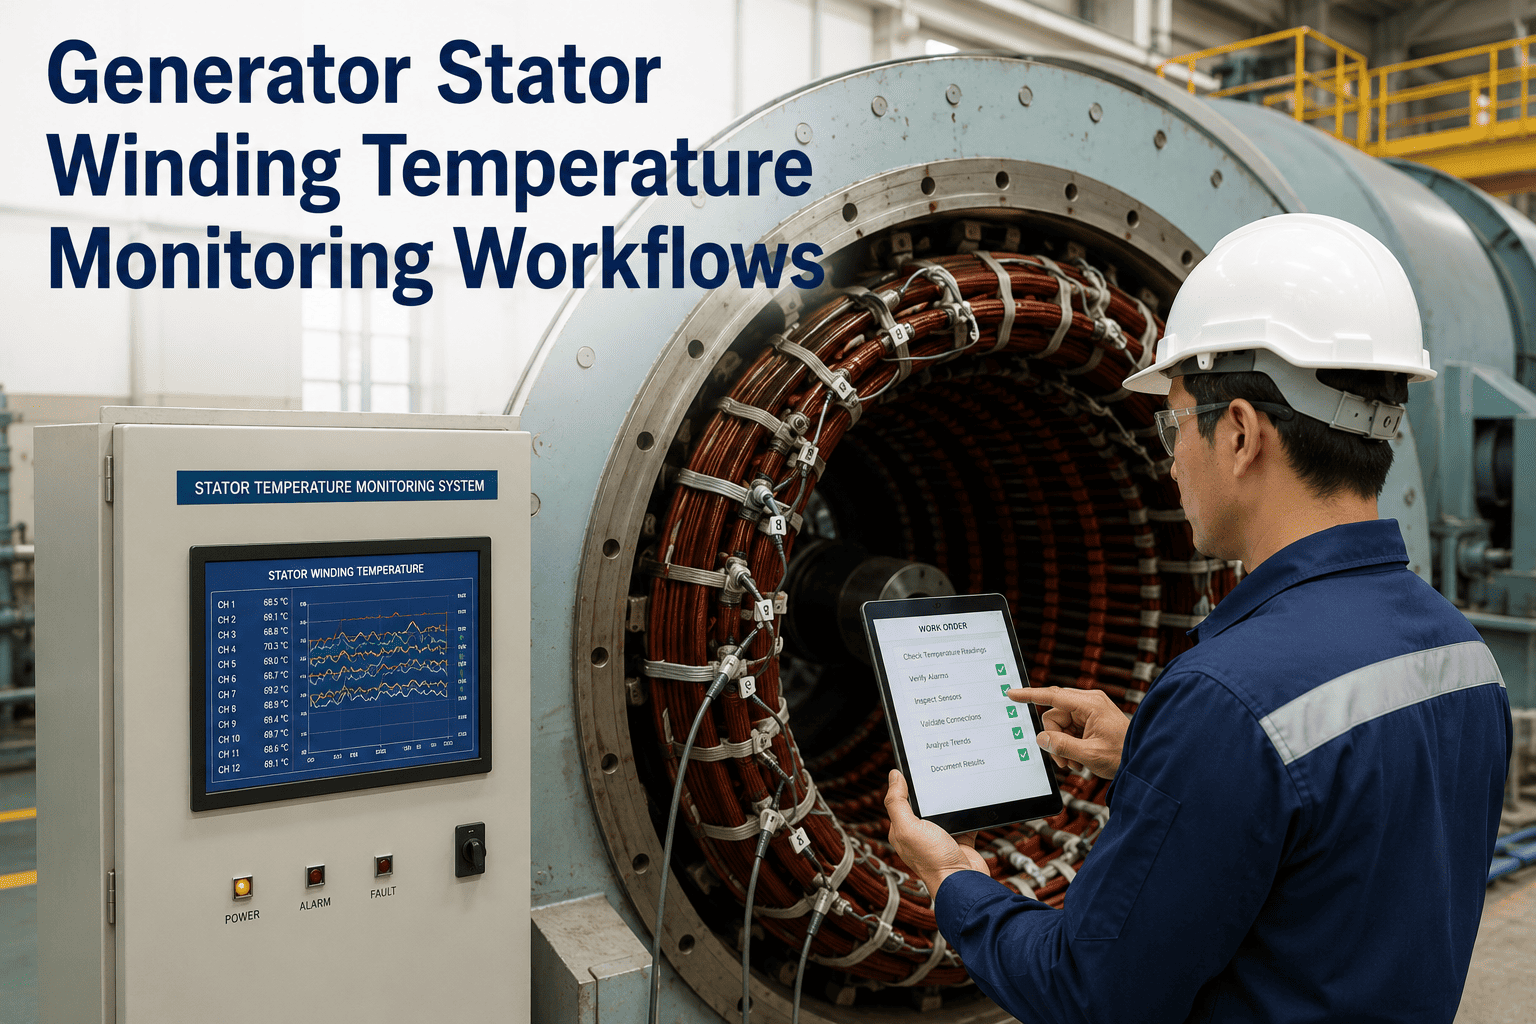
RTD temperature measurements logged continuously during operation — hot spot temperature maintained below 155 degrees Celsius for class F insulation
Control Room Operator
•
Temperature monitoring log
Hydrogen or air cooling system flow rates verified at design values — reduced cooling flow causes temperature rise accelerating insulation aging
Mechanical Technician
•
Cooling flow verification
Cooling gas purity maintained above 95% hydrogen or equivalent — contamination reduces cooling effectiveness and creates corrosion risk
Chemistry Technician
•
Gas purity analysis
Thermal imaging survey conducted during steady-state load to identify blocked cooling passages or localized hot spots indicating internal faults
Thermography Specialist
•
Thermal imaging report
Temperature rise test performed following major repairs to verify cooling system restoration and identify installation defects before return to service
Commissioning Engineer
•
Heat run test certificate
Cumulative thermal stress calculated from operating temperature and load history — insulation life consumption tracking guides rewind timing decisions
Asset Manager
•
Life consumption model
Zone 07
Emergency Response & Failure Investigation Protocol
When electrical faults occur, rapid diagnostic response minimizes damage propagation and secondary failures. Structured investigation protocols capture forensic evidence and prevent recurrence through root cause corrective action.
Immediate isolation and lockout following ground fault or differential relay trip — energized inspection risks personnel safety and destroys fault evidence
Shift Supervisor
•
Emergency isolation protocol
Megohm testing performed on all phases to identify faulted winding — low resistance to ground confirms insulation breakdown location
Emergency Response Team
•
Fault location report
Visual inspection for burn marks, melted insulation, or carbon tracking — photographic documentation preserves evidence for insurance and failure analysis
Failure Analyst
•
Forensic photo record
Historical test data reviewed to identify precursor degradation trends — missed warning signs inform procedure improvements preventing future failures
Reliability Manager
•
Precursor analysis report
Root cause investigation team assembled including OEM technical support — complex failures require expert analysis to prevent recurrence
Engineering Manager
•
Investigation team charter
Failure mode entered into CMMS reliability database — fleet-wide analysis identifies systemic issues requiring design or procedure modifications
Reliability Engineer
•
Failure database entry
Corrective action plan developed with timeline and accountability — lessons learned distributed across fleet to prevent similar failures on sister units
Plant Manager
•
Corrective action register
KPIs
Stator Maintenance Program Performance Metrics
Scroll horizontally on mobile devices to view all data
| Critical Metric |
Calculation Method |
Performance Target |
Measurement Frequency |
| Testing Schedule Compliance |
Completed tests divided by scheduled tests |
100% |
Monthly |
| Insulation Resistance Trend |
Year-over-year percentage change |
Less than 10% decline |
Annual |
| PD Activity Level |
Maximum PD magnitude in picocoulombs |
Below 1000 pC |
Quarterly |
| Unplanned Outage Hours |
Total forced outage hours from stator faults |
Zero hours |
Annual |
| Thermal Limit Excursions |
Hours operated above temperature design limit |
Zero hours |
Monthly |
FAQs
Generator Stator Maintenance Questions
How often should partial discharge testing be performed on operating generators?
Annual offline PD testing during planned outages for critical baseload units. Online continuous PD monitoring provides daily trending for high-value assets. Bi-annual testing acceptable for peaking units with limited operating hours and lower commercial risk.
What is the acceptable insulation resistance value for generator stator windings?
Minimum 5000 megohms at 40 degrees Celsius for modern class F insulation systems. Values below 1000 megohms indicate moisture or contamination requiring cleaning. Absolute values less critical than trend direction — declining resistance signals active degradation.
Can stator winding failures be predicted with certainty?
No test provides absolute certainty but combined monitoring of insulation resistance, partial discharge, dissipation factor, and thermal performance detects 80% of developing failures weeks to months before breakdown. Sudden failures from external events remain unpredictable.
When should a generator stator be rewound versus repaired?
Complete rewind justified when multiple coils show degradation, insulation system exceeds design life typically 30 to 40 years, or core damage requires replacement. Isolated single-coil failures often repairable at 10 to 20 percent of rewind cost.
What documentation is required for generator insurance coverage?
Annual electrical testing reports including insulation resistance with PI, partial discharge measurements, dissipation factor trending, and thermal performance verification. Insurers require documented testing compliance and retention of test certificates minimum 10 years for claims validation.
Electrical Asset Management
Every Test Tracked. Every Trend Analyzed. Every Failure Prevented.
OxMaint creates a unified electrical testing database for your entire generator fleet with automated test scheduling, multi-parameter trending dashboards, threshold-based alerting, and instant access to 20-year test history during outage planning and failure investigations — transforming raw test data into actionable reliability intelligence.